
Powered Cable Puller Market
Powered Cable Puller Market Forecasts to 2030 - Global Analysis By Product (Hydraulic Cable Pullers, Electric Cable Pullers, Battery-Powered Cable Pullers, Pneumatic Cable Pullers, Manual Cable Pullers with Power-assist and Other Products), Diameter (1 Inch, 1-3 Inches and 3 Inches & Above), Application and By Geography

|
Years Covered |
2021-2030 |
|
Estimated Year Value (2023) |
US $1.39 BN |
|
Projected Year Value (2030) |
US $2.17 BN |
|
CAGR (2023 - 2030) |
6.5% |
|
Regions Covered |
North America, Europe, Asia Pacific, South America, and Middle East & Africa |
|
Countries Covered |
US, Canada, Mexico, Germany, UK, Italy, France, Spain, Japan, China, India, Australia, New Zealand, South Korea, Rest of Asia Pacific, South America, Argentina, Brazil, Chile, Middle East & Africa, Saudi Arabia, UAE, Qatar, and South Africa |
|
Largest Market |
Asia Pacific |
|
Highest Growing Market |
Europe |
According to Stratistics MRC, the Global Powered Cable Puller Market is accounted for $1.39 billion in 2023 and is expected to reach $2.17 billion by 2030 growing at a CAGR of 6.5% during the forecast period. A powered cable puller is a versatile tool designed for streamlining cable installation processes, reducing manual labor, and ensuring the efficiency and safety of cable installations in various industries. They generate strong pulling force to draw building wire, datacom cable, and other large-diameter cable through conduit. Powered cable pullers are designed to be robust, durable, and suitable for use in challenging environments.
Market Dynamics:
Driver:
Increasing infrastructure development projects
The surge in construction activities, including the development of roads, bridges, and utility networks, has significantly increased the need for efficient cable installation. Powered cable pullers play a crucial role in streamlining and expediting cable laying processes, enhancing productivity and reducing labor costs. The versatility, reliability, and time-saving advantages offered by these pullers position them as indispensable tools in the modern construction landscape. As governments and private entities continue to invest in expanding and upgrading infrastructure, the powered cable puller market is expected to experience a sustained upward trajectory.
Restraint:
Lack of skilled operators
The specialized nature of operating cable puller equipment requires individuals with specific technical expertise and training. The scarcity of qualified personnel hampers the efficient deployment and utilization of powered cable pullers, limiting their widespread adoption. This constraint not only affects the productivity and effectiveness of cable pulling operations but also poses a barrier to the growth of the market.
Opportunity:
Rising focus on smart cities
Smart cities rely heavily on interconnected networks and seamless communication, making powered cable pullers essential for laying and maintaining cables effectively. These tools enable quicker and more precise cable installations, supporting the development of robust urban infrastructure. As urbanization accelerates globally, the demand for efficient and advanced infrastructure rises. Therefore, powered cable puller market is poised to benefit from the growing investments in smart city initiatives, offering a vital solution for streamlined and technology-driven urban development.
Threat:
Fluctuating energy policies
Sudden shifts in energy policies, such as changes in subsidies or incentives for renewable energy sources, can impact the demand for cable pullers. Additionally, regulatory ambiguity may discourage companies from making long-term investments in innovative and energy-efficient technologies. This uncertainty creates challenges for market players in planning and adapting their strategies, potentially leading to decreased market stability and competitiveness in the powered cable puller industry.
Covid-19 Impact
The covid-19 pandemic significantly impacted the powered cable puller market. Supply chain disruptions, labor shortages, and project delays in the construction and infrastructure sectors led to a decline in demand for cable pulling equipment. However, the increased adoption of remote work and the need for enhanced connectivity in various industries have created opportunities for market recovery. The industry is adapting to the new normal by focusing on technological advancements, safety measures, and product innovations to meet the evolving demands of a post-pandemic market.
The electric cable pullers segment is expected to be the largest during the forecast period
The electric cable pullers segment is estimated to have a lucrative growth. Electric cable pullers streamline the process of pulling and positioning cables in various applications, such as construction sites and industrial settings. They typically consist of a motorized unit with a pulling mechanism, allowing for efficient and precise cable placement. These tools enhance productivity by reducing manual effort and minimizing the risk of injuries associated with manual cable pulling. Electric cable pullers contribute to the overall safety, speed, and accuracy of cable installation processes in diverse electrical projects.
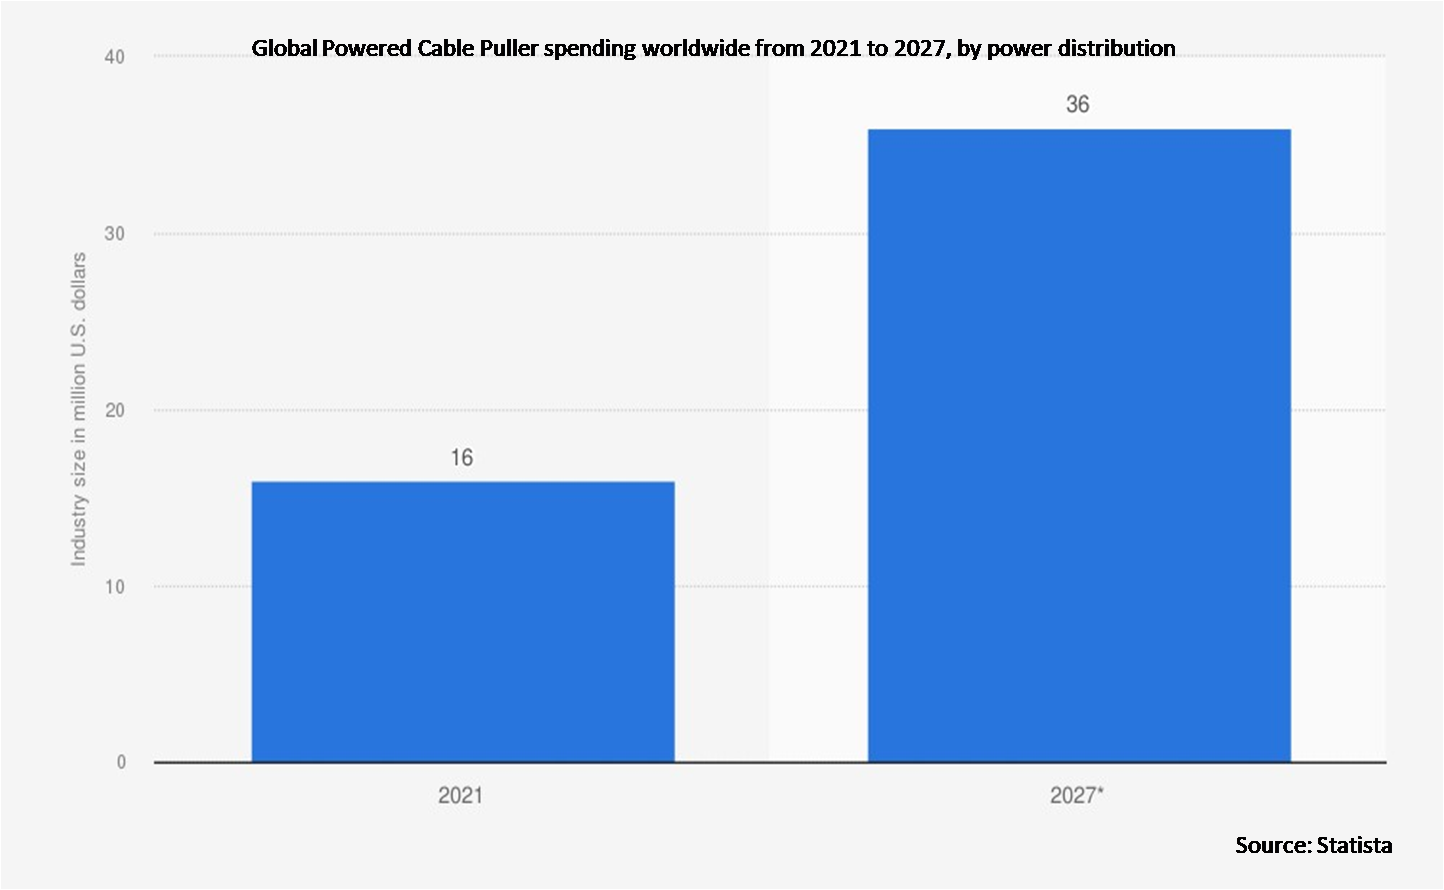
The power distribution segment is expected to have the highest CAGR during the forecast period
The power distribution segment is anticipated to witness the highest CAGR growth during the forecast period. Powered cable pullers utilize motorized mechanisms to efficiently pull and position cables within conduits or trays, reducing manual effort and enhancing productivity. The benefits include increased worker safety, as it minimizes physical strain and the risk of injuries associated with manual pulling. Overall, they results in faster, safer, and more reliable power distribution installations, making them an indispensable tool in the electrical industry.
Region with largest share:
Asia Pacific is projected to hold the largest market share during the forecast period owing to the increasing infrastructure development and industrial projects across the region. Rising demand for efficient and time-saving cable installation solutions, coupled with advancements in construction technologies, is driving market expansion. Key players in the region are focusing on product innovation and strategic collaborations to gain a competitive edge. Government initiatives promoting infrastructure investments further contribute to the market's positive trajectory, making the Asia-Pacific region a significant hub for the powered cable puller market.
Region with highest CAGR:
Europe is projected to have the highest CAGR over the forecast period, owing to the increasing demand for efficient and time-saving cable installation solutions. Rapid urbanization, infrastructure development, and the expanding telecommunications sector contribute to the market's expansion. Key players in the European cable puller market focus on innovation and product development to meet the evolving needs of the construction, energy, and telecommunications sectors, fostering a competitive landscape in the region.

Key players in the market
Some of the key players profiled in the Powered Cable Puller Market include Emerson, Klein Tools, Milwaukee Tool, Stanley Black & Decker, Bosch Power Tools, Makita, Sumner Manufacturing, Condux International, Columbia Safety and Supply, Current Tools, Hubbell Incorporated, GMP Tools and Southwire.
Key Developments:
In September 2023, Emerson, a global technology and software leader, announced a new “Go Boldly” tagline and global ad campaign reinforcing the evolution of the long time manufacturing powerhouse.
In June 2023, Bosch Power Tools introduced new tools including an 18V concrete nailer and heat gun, continuing to expand its cordless portfolio to support trade workers. In addition to the new tools, Bosch Power Tools also announced a new and enhanced 18V Limited Warranty that offers extended coverage for 18V tools, chargers, and batteries.
Products Covered:
• Hydraulic Cable Pullers
• Electric Cable Pullers
• Battery-Powered Cable Pullers
• Pneumatic Cable Pullers
• Manual Cable Pullers with Power-assist
• Other Products
Diameters Covered:
• 1 Inch
• 1-3 Inches
• 3 Inches & Above
Applications Covered:
• Telecommunications
• Construction & Infrastructure
• Power Distribution
• Oil & Gas Industry
• Mining
• Data Centers
• Event & Entertainment Industry
• Other Applications
Regions Covered:
• North America
o US
o Canada
o Mexico
• Europe
o Germany
o UK
o Italy
o France
o Spain
o Rest of Europe
• Asia Pacific
o Japan
o China
o India
o Australia
o New Zealand
o South Korea
o Rest of Asia Pacific
• South America
o Argentina
o Brazil
o Chile
o Rest of South America
• Middle East & Africa
o Saudi Arabia
o UAE
o Qatar
o South Africa
o Rest of Middle East & Africa
What our report offers:
- Market share assessments for the regional and country-level segments
- Strategic recommendations for the new entrants
- Covers Market data for the years 2021, 2022, 2023, 2026, and 2030
- Market Trends (Drivers, Constraints, Opportunities, Threats, Challenges, Investment Opportunities, and recommendations)
- Strategic recommendations in key business segments based on the market estimations
- Competitive landscaping mapping the key common trends
- Company profiling with detailed strategies, financials, and recent developments
- Supply chain trends mapping the latest technological advancements
Free Customization Offerings:
All the customers of this report will be entitled to receive one of the following free customization options:
• Company Profiling
o Comprehensive profiling of additional market players (up to 3)
o SWOT Analysis of key players (up to 3)
• Regional Segmentation
o Market estimations, Forecasts and CAGR of any prominent country as per the client's interest (Note: Depends on feasibility check)
• Competitive Benchmarking
o Benchmarking of key players based on product portfolio, geographical presence, and strategic alliances
Table of Contents
1 Executive Summary
2 Preface
2.1 Abstract
2.2 Stake Holders
2.3 Research Scope
2.4 Research Methodology
2.4.1 Data Mining
2.4.2 Data Analysis
2.4.3 Data Validation
2.4.4 Research Approach
2.5 Research Sources
2.5.1 Primary Research Sources
2.5.2 Secondary Research Sources
2.5.3 Assumptions
3 Market Trend Analysis
3.1 Introduction
3.2 Drivers
3.3 Restraints
3.4 Opportunities
3.5 Threats
3.6 Product Analysis
3.7 Application Analysis
3.8 Emerging Markets
3.9 Impact of Covid-19
4 Porters Five Force Analysis
4.1 Bargaining power of suppliers
4.2 Bargaining power of buyers
4.3 Threat of substitutes
4.4 Threat of new entrants
4.5 Competitive rivalry
5 Global Powered Cable Puller Market, By Product
5.1 Introduction
5.2 Hydraulic Cable Pullers
5.3 Electric Cable Pullers
5.4 Battery-Powered Cable Pullers
5.5 Pneumatic Cable Pullers
5.6 Manual Cable Pullers with Power-assist
5.7 Other Products
6 Global Powered Cable Puller Market, By Diameter
6.1 Introduction
6.2 1 Inch
6.3 1-3 Inches
6.4 3 Inches & Above
7 Global Powered Cable Puller Market, By Application
7.1 Introduction
7.2 Telecommunications
7.3 Construction & Infrastructure
7.4 Power Distribution
7.5 Oil & Gas Industry
7.6 Mining
7.7 Data Centers
7.8 Event & Entertainment Industry
7.9 Other Applications
8 Global Powered Cable Puller Market, By Geography
8.1 Introduction
8.2 North America
8.2.1 US
8.2.2 Canada
8.2.3 Mexico
8.3 Europe
8.3.1 Germany
8.3.2 UK
8.3.3 Italy
8.3.4 France
8.3.5 Spain
8.3.6 Rest of Europe
8.4 Asia Pacific
8.4.1 Japan
8.4.2 China
8.4.3 India
8.4.4 Australia
8.4.5 New Zealand
8.4.6 South Korea
8.4.7 Rest of Asia Pacific
8.5 South America
8.5.1 Argentina
8.5.2 Brazil
8.5.3 Chile
8.5.4 Rest of South America
8.6 Middle East & Africa
8.6.1 Saudi Arabia
8.6.2 UAE
8.6.3 Qatar
8.6.4 South Africa
8.6.5 Rest of Middle East & Africa
9 Key Developments
9.1 Agreements, Partnerships, Collaborations and Joint Ventures
9.2 Acquisitions & Mergers
9.3 New Product Launch
9.4 Expansions
9.5 Other Key Strategies
10 Company Profiling
10.1 Emerson
10.2 Klein Tools
10.3 Milwaukee Tool
10.4 Stanley Black & Decker
10.5 Bosch Power Tools
10.6 Makita
10.7 Sumner Manufacturing
10.8 Condux International
10.9 Columbia Safety and Supply
10.10 Current Tools
10.11 Hubbell Incorporated
10.12 GMP Tools
10.13 Southwire
List of Tables
1 Global Powered Cable Puller Market Outlook, By Region (2021-2030) ($MN)
2 Global Powered Cable Puller Market Outlook, By Product (2021-2030) ($MN)
3 Global Powered Cable Puller Market Outlook, By Hydraulic Cable Pullers (2021-2030) ($MN)
4 Global Powered Cable Puller Market Outlook, By Electric Cable Pullers (2021-2030) ($MN)
5 Global Powered Cable Puller Market Outlook, By Battery-Powered Cable Pullers (2021-2030) ($MN)
6 Global Powered Cable Puller Market Outlook, By Pneumatic Cable Pullers (2021-2030) ($MN)
7 Global Powered Cable Puller Market Outlook, By Manual Cable Pullers with Power-assist (2021-2030) ($MN)
8 Global Powered Cable Puller Market Outlook, By Other Products (2021-2030) ($MN)
9 Global Powered Cable Puller Market Outlook, By Diameter (2021-2030) ($MN)
10 Global Powered Cable Puller Market Outlook, By 1 Inch (2021-2030) ($MN)
11 Global Powered Cable Puller Market Outlook, By 1-3 Inches (2021-2030) ($MN)
12 Global Powered Cable Puller Market Outlook, By 3 Inches & Above (2021-2030) ($MN)
13 Global Powered Cable Puller Market Outlook, By Application (2021-2030) ($MN)
14 Global Powered Cable Puller Market Outlook, By Telecommunications (2021-2030) ($MN)
15 Global Powered Cable Puller Market Outlook, By Construction & Infrastructure (2021-2030) ($MN)
16 Global Powered Cable Puller Market Outlook, By Power Distribution (2021-2030) ($MN)
17 Global Powered Cable Puller Market Outlook, By Oil & Gas Industry (2021-2030) ($MN)
18 Global Powered Cable Puller Market Outlook, By Mining (2021-2030) ($MN)
19 Global Powered Cable Puller Market Outlook, By Data Centers (2021-2030) ($MN)
20 Global Powered Cable Puller Market Outlook, By Event & Entertainment Industry (2021-2030) ($MN)
21 Global Powered Cable Puller Market Outlook, By Other Applications (2021-2030) ($MN)
22 North America Powered Cable Puller Market Outlook, By Country (2021-2030) ($MN)
23 North America Powered Cable Puller Market Outlook, By Product (2021-2030) ($MN)
24 North America Powered Cable Puller Market Outlook, By Hydraulic Cable Pullers (2021-2030) ($MN)
25 North America Powered Cable Puller Market Outlook, By Electric Cable Pullers (2021-2030) ($MN)
26 North America Powered Cable Puller Market Outlook, By Battery-Powered Cable Pullers (2021-2030) ($MN)
27 North America Powered Cable Puller Market Outlook, By Pneumatic Cable Pullers (2021-2030) ($MN)
28 North America Powered Cable Puller Market Outlook, By Manual Cable Pullers with Power-assist (2021-2030) ($MN)
29 North America Powered Cable Puller Market Outlook, By Other Products (2021-2030) ($MN)
30 North America Powered Cable Puller Market Outlook, By Diameter (2021-2030) ($MN)
31 North America Powered Cable Puller Market Outlook, By 1 Inch (2021-2030) ($MN)
32 North America Powered Cable Puller Market Outlook, By 1-3 Inches (2021-2030) ($MN)
33 North America Powered Cable Puller Market Outlook, By 3 Inches & Above (2021-2030) ($MN)
34 North America Powered Cable Puller Market Outlook, By Application (2021-2030) ($MN)
35 North America Powered Cable Puller Market Outlook, By Telecommunications (2021-2030) ($MN)
36 North America Powered Cable Puller Market Outlook, By Construction & Infrastructure (2021-2030) ($MN)
37 North America Powered Cable Puller Market Outlook, By Power Distribution (2021-2030) ($MN)
38 North America Powered Cable Puller Market Outlook, By Oil & Gas Industry (2021-2030) ($MN)
39 North America Powered Cable Puller Market Outlook, By Mining (2021-2030) ($MN)
40 North America Powered Cable Puller Market Outlook, By Data Centers (2021-2030) ($MN)
41 North America Powered Cable Puller Market Outlook, By Event & Entertainment Industry (2021-2030) ($MN)
42 North America Powered Cable Puller Market Outlook, By Other Applications (2021-2030) ($MN)
43 Europe Powered Cable Puller Market Outlook, By Country (2021-2030) ($MN)
44 Europe Powered Cable Puller Market Outlook, By Product (2021-2030) ($MN)
45 Europe Powered Cable Puller Market Outlook, By Hydraulic Cable Pullers (2021-2030) ($MN)
46 Europe Powered Cable Puller Market Outlook, By Electric Cable Pullers (2021-2030) ($MN)
47 Europe Powered Cable Puller Market Outlook, By Battery-Powered Cable Pullers (2021-2030) ($MN)
48 Europe Powered Cable Puller Market Outlook, By Pneumatic Cable Pullers (2021-2030) ($MN)
49 Europe Powered Cable Puller Market Outlook, By Manual Cable Pullers with Power-assist (2021-2030) ($MN)
50 Europe Powered Cable Puller Market Outlook, By Other Products (2021-2030) ($MN)
51 Europe Powered Cable Puller Market Outlook, By Diameter (2021-2030) ($MN)
52 Europe Powered Cable Puller Market Outlook, By 1 Inch (2021-2030) ($MN)
53 Europe Powered Cable Puller Market Outlook, By 1-3 Inches (2021-2030) ($MN)
54 Europe Powered Cable Puller Market Outlook, By 3 Inches & Above (2021-2030) ($MN)
55 Europe Powered Cable Puller Market Outlook, By Application (2021-2030) ($MN)
56 Europe Powered Cable Puller Market Outlook, By Telecommunications (2021-2030) ($MN)
57 Europe Powered Cable Puller Market Outlook, By Construction & Infrastructure (2021-2030) ($MN)
58 Europe Powered Cable Puller Market Outlook, By Power Distribution (2021-2030) ($MN)
59 Europe Powered Cable Puller Market Outlook, By Oil & Gas Industry (2021-2030) ($MN)
60 Europe Powered Cable Puller Market Outlook, By Mining (2021-2030) ($MN)
61 Europe Powered Cable Puller Market Outlook, By Data Centers (2021-2030) ($MN)
62 Europe Powered Cable Puller Market Outlook, By Event & Entertainment Industry (2021-2030) ($MN)
63 Europe Powered Cable Puller Market Outlook, By Other Applications (2021-2030) ($MN)
64 Asia Pacific Powered Cable Puller Market Outlook, By Country (2021-2030) ($MN)
65 Asia Pacific Powered Cable Puller Market Outlook, By Product (2021-2030) ($MN)
66 Asia Pacific Powered Cable Puller Market Outlook, By Hydraulic Cable Pullers (2021-2030) ($MN)
67 Asia Pacific Powered Cable Puller Market Outlook, By Electric Cable Pullers (2021-2030) ($MN)
68 Asia Pacific Powered Cable Puller Market Outlook, By Battery-Powered Cable Pullers (2021-2030) ($MN)
69 Asia Pacific Powered Cable Puller Market Outlook, By Pneumatic Cable Pullers (2021-2030) ($MN)
70 Asia Pacific Powered Cable Puller Market Outlook, By Manual Cable Pullers with Power-assist (2021-2030) ($MN)
71 Asia Pacific Powered Cable Puller Market Outlook, By Other Products (2021-2030) ($MN)
72 Asia Pacific Powered Cable Puller Market Outlook, By Diameter (2021-2030) ($MN)
73 Asia Pacific Powered Cable Puller Market Outlook, By 1 Inch (2021-2030) ($MN)
74 Asia Pacific Powered Cable Puller Market Outlook, By 1-3 Inches (2021-2030) ($MN)
75 Asia Pacific Powered Cable Puller Market Outlook, By 3 Inches & Above (2021-2030) ($MN)
76 Asia Pacific Powered Cable Puller Market Outlook, By Application (2021-2030) ($MN)
77 Asia Pacific Powered Cable Puller Market Outlook, By Telecommunications (2021-2030) ($MN)
78 Asia Pacific Powered Cable Puller Market Outlook, By Construction & Infrastructure (2021-2030) ($MN)
79 Asia Pacific Powered Cable Puller Market Outlook, By Power Distribution (2021-2030) ($MN)
80 Asia Pacific Powered Cable Puller Market Outlook, By Oil & Gas Industry (2021-2030) ($MN)
81 Asia Pacific Powered Cable Puller Market Outlook, By Mining (2021-2030) ($MN)
82 Asia Pacific Powered Cable Puller Market Outlook, By Data Centers (2021-2030) ($MN)
83 Asia Pacific Powered Cable Puller Market Outlook, By Event & Entertainment Industry (2021-2030) ($MN)
84 Asia Pacific Powered Cable Puller Market Outlook, By Other Applications (2021-2030) ($MN)
85 South America Powered Cable Puller Market Outlook, By Country (2021-2030) ($MN)
86 South America Powered Cable Puller Market Outlook, By Product (2021-2030) ($MN)
87 South America Powered Cable Puller Market Outlook, By Hydraulic Cable Pullers (2021-2030) ($MN)
88 South America Powered Cable Puller Market Outlook, By Electric Cable Pullers (2021-2030) ($MN)
89 South America Powered Cable Puller Market Outlook, By Battery-Powered Cable Pullers (2021-2030) ($MN)
90 South America Powered Cable Puller Market Outlook, By Pneumatic Cable Pullers (2021-2030) ($MN)
91 South America Powered Cable Puller Market Outlook, By Manual Cable Pullers with Power-assist (2021-2030) ($MN)
92 South America Powered Cable Puller Market Outlook, By Other Products (2021-2030) ($MN)
93 South America Powered Cable Puller Market Outlook, By Diameter (2021-2030) ($MN)
94 South America Powered Cable Puller Market Outlook, By 1 Inch (2021-2030) ($MN)
95 South America Powered Cable Puller Market Outlook, By 1-3 Inches (2021-2030) ($MN)
96 South America Powered Cable Puller Market Outlook, By 3 Inches & Above (2021-2030) ($MN)
97 South America Powered Cable Puller Market Outlook, By Application (2021-2030) ($MN)
98 South America Powered Cable Puller Market Outlook, By Telecommunications (2021-2030) ($MN)
99 South America Powered Cable Puller Market Outlook, By Construction & Infrastructure (2021-2030) ($MN)
100 South America Powered Cable Puller Market Outlook, By Power Distribution (2021-2030) ($MN)
101 South America Powered Cable Puller Market Outlook, By Oil & Gas Industry (2021-2030) ($MN)
102 South America Powered Cable Puller Market Outlook, By Mining (2021-2030) ($MN)
103 South America Powered Cable Puller Market Outlook, By Data Centers (2021-2030) ($MN)
104 South America Powered Cable Puller Market Outlook, By Event & Entertainment Industry (2021-2030) ($MN)
105 South America Powered Cable Puller Market Outlook, By Other Applications (2021-2030) ($MN)
106 Middle East & Africa Powered Cable Puller Market Outlook, By Country (2021-2030) ($MN)
107 Middle East & Africa Powered Cable Puller Market Outlook, By Product (2021-2030) ($MN)
108 Middle East & Africa Powered Cable Puller Market Outlook, By Hydraulic Cable Pullers (2021-2030) ($MN)
109 Middle East & Africa Powered Cable Puller Market Outlook, By Electric Cable Pullers (2021-2030) ($MN)
110 Middle East & Africa Powered Cable Puller Market Outlook, By Battery-Powered Cable Pullers (2021-2030) ($MN)
111 Middle East & Africa Powered Cable Puller Market Outlook, By Pneumatic Cable Pullers (2021-2030) ($MN)
112 Middle East & Africa Powered Cable Puller Market Outlook, By Manual Cable Pullers with Power-assist (2021-2030) ($MN)
113 Middle East & Africa Powered Cable Puller Market Outlook, By Other Products (2021-2030) ($MN)
114 Middle East & Africa Powered Cable Puller Market Outlook, By Diameter (2021-2030) ($MN)
115 Middle East & Africa Powered Cable Puller Market Outlook, By 1 Inch (2021-2030) ($MN)
116 Middle East & Africa Powered Cable Puller Market Outlook, By 1-3 Inches (2021-2030) ($MN)
117 Middle East & Africa Powered Cable Puller Market Outlook, By 3 Inches & Above (2021-2030) ($MN)
118 Middle East & Africa Powered Cable Puller Market Outlook, By Application (2021-2030) ($MN)
119 Middle East & Africa Powered Cable Puller Market Outlook, By Telecommunications (2021-2030) ($MN)
120 Middle East & Africa Powered Cable Puller Market Outlook, By Construction & Infrastructure (2021-2030) ($MN)
121 Middle East & Africa Powered Cable Puller Market Outlook, By Power Distribution (2021-2030) ($MN)
122 Middle East & Africa Powered Cable Puller Market Outlook, By Oil & Gas Industry (2021-2030) ($MN)
123 Middle East & Africa Powered Cable Puller Market Outlook, By Mining (2021-2030) ($MN)
124 Middle East & Africa Powered Cable Puller Market Outlook, By Data Centers (2021-2030) ($MN)
125 Middle East & Africa Powered Cable Puller Market Outlook, By Event & Entertainment Industry (2021-2030) ($MN)
126 Middle East & Africa Powered Cable Puller Market Outlook, By Other Applications (2021-2030) ($MN)
List of Figures
RESEARCH METHODOLOGY

We at ‘Stratistics’ opt for an extensive research approach which involves data mining, data validation, and data analysis. The various research sources include in-house repository, secondary research, competitor’s sources, social media research, client internal data, and primary research.
Our team of analysts prefers the most reliable and authenticated data sources in order to perform the comprehensive literature search. With access to most of the authenticated data bases our team highly considers the best mix of information through various sources to obtain extensive and accurate analysis.
Each report takes an average time of a month and a team of 4 industry analysts. The time may vary depending on the scope and data availability of the desired market report. The various parameters used in the market assessment are standardized in order to enhance the data accuracy.
Data Mining
The data is collected from several authenticated, reliable, paid and unpaid sources and is filtered depending on the scope & objective of the research. Our reports repository acts as an added advantage in this procedure. Data gathering from the raw material suppliers, distributors and the manufacturers is performed on a regular basis, this helps in the comprehensive understanding of the products value chain. Apart from the above mentioned sources the data is also collected from the industry consultants to ensure the objective of the study is in the right direction.
Market trends such as technological advancements, regulatory affairs, market dynamics (Drivers, Restraints, Opportunities and Challenges) are obtained from scientific journals, market related national & international associations and organizations.
Data Analysis
From the data that is collected depending on the scope & objective of the research the data is subjected for the analysis. The critical steps that we follow for the data analysis include:
- Product Lifecycle Analysis
- Competitor analysis
- Risk analysis
- Porters Analysis
- PESTEL Analysis
- SWOT Analysis
The data engineering is performed by the core industry experts considering both the Marketing Mix Modeling and the Demand Forecasting. The marketing mix modeling makes use of multiple-regression techniques to predict the optimal mix of marketing variables. Regression factor is based on a number of variables and how they relate to an outcome such as sales or profits.
Data Validation
The data validation is performed by the exhaustive primary research from the expert interviews. This includes telephonic interviews, focus groups, face to face interviews, and questionnaires to validate our research from all aspects. The industry experts we approach come from the leading firms, involved in the supply chain ranging from the suppliers, distributors to the manufacturers and consumers so as to ensure an unbiased analysis.
We are in touch with more than 15,000 industry experts with the right mix of consultants, CEO's, presidents, vice presidents, managers, experts from both supply side and demand side, executives and so on.
The data validation involves the primary research from the industry experts belonging to:
- Leading Companies
- Suppliers & Distributors
- Manufacturers
- Consumers
- Industry/Strategic Consultants
Apart from the data validation the primary research also helps in performing the fill gap research, i.e. providing solutions for the unmet needs of the research which helps in enhancing the reports quality.
For more details about research methodology, kindly write to us at info@strategymrc.com
Frequently Asked Questions
In case of any queries regarding this report, you can contact the customer service by filing the “Inquiry Before Buy” form available on the right hand side. You may also contact us through email: info@strategymrc.com or phone: +1-301-202-5929
Yes, the samples are available for all the published reports. You can request them by filling the “Request Sample” option available in this page.
Yes, you can request a sample with your specific requirements. All the customized samples will be provided as per the requirement with the real data masked.
All our reports are available in Digital PDF format. In case if you require them in any other formats, such as PPT, Excel etc you can submit a request through “Inquiry Before Buy” form available on the right hand side. You may also contact us through email: info@strategymrc.com or phone: +1-301-202-5929
We offer a free 15% customization with every purchase. This requirement can be fulfilled for both pre and post sale. You may send your customization requirements through email at info@strategymrc.com or call us on +1-301-202-5929.
We have 3 different licensing options available in electronic format.
- Single User Licence: Allows one person, typically the buyer, to have access to the ordered product. The ordered product cannot be distributed to anyone else.
- 2-5 User Licence: Allows the ordered product to be shared among a maximum of 5 people within your organisation.
- Corporate License: Allows the product to be shared among all employees of your organisation regardless of their geographical location.
All our reports are typically be emailed to you as an attachment.
To order any available report you need to register on our website. The payment can be made either through CCAvenue or PayPal payments gateways which accept all international cards.
We extend our support to 6 months post sale. A post sale customization is also provided to cover your unmet needs in the report.
Request Customization
We offer complimentary customization of up to 15% with every purchase. To share your customization requirements, feel free to email us at info@strategymrc.com or call us on +1-301-202-5929. .
Please Note: Customization within the 15% threshold is entirely free of charge. If your request exceeds this limit, we will conduct a feasibility assessment. Following that, a detailed quote and timeline will be provided.
WHY CHOOSE US ?

Assured Quality
Best in class reports with high standard of research integrity

24X7 Research Support
Continuous support to ensure the best customer experience.

Free Customization
Adding more values to your product of interest.

Safe & Secure Access
Providing a secured environment for all online transactions.

Trusted by 600+ Brands
Serving the most reputed brands across the world.