
Precision Agriculture Analytics Market
Precision Agriculture Analytics Market Forecasts to 2034 - Global Analysis By Component (Software and Services), Deployment Mode, Farm Size, Technology, Application, End User and By Geography

|
Years Covered |
2023-2034 |
|
Estimated Year Value (2026) |
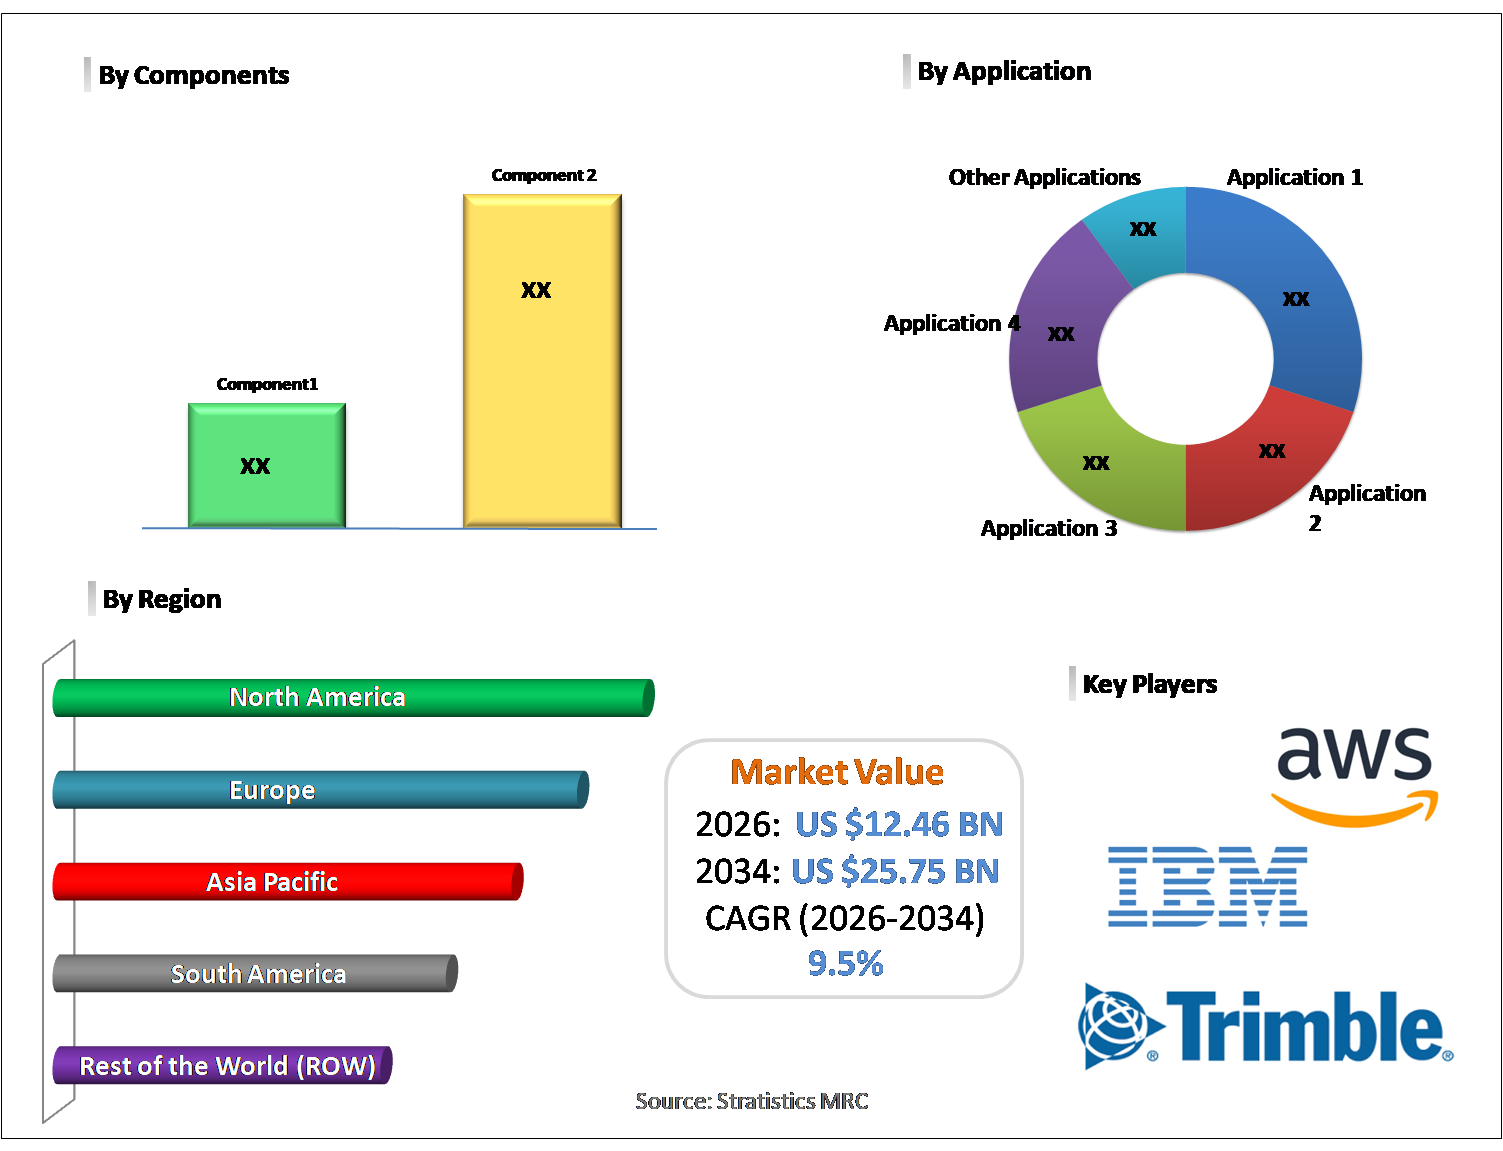
US $12.46 BN |
|
Projected Year Value (2034) |
US $25.75 BN |
|
CAGR (2026-2034) |
9.5% |
|
Regions Covered |
North America, Europe, Asia Pacific, South America, and Rest of the World (RoW) |
|
Countries Covered |
United States, Canada, Mexico, United Kingdom, Germany, France, Italy, Spain, Netherlands, Belgium, Sweden, Switzerland, Poland, Rest of Europe, China, Japan, India, South Korea, Australia, Indonesia, Thailand, Malaysia, Singapore, Vietnam, Rest of Asia Pacific, Brazil, Argentina, Colombia, Chile, Peru, Rest of South America, Saudi Arabia, United Arab Emirates, Qatar, Israel, Rest of Middle East, South Africa, Egypt, Morocco, and Rest of Africa. |
|
Largest Market |
North America |
|
Highest Growing Market |
Asia Pacific |
According to Stratistics MRC, the Global Precision Agriculture Analytics Market is accounted for $12.46 billion in 2026 and is expected to reach $25.75 billion by 2034 growing at a CAGR of 9.5% during the forecast period. Precision Agriculture Analytics refers to the systematic collection, analysis, and interpretation of farm-related data using advanced technologies such as IoT sensors, GPS, drones, and satellite imagery. It enables farmers to make data driven decisions by monitoring crop health, soil conditions, weather patterns, and resource usage in real time. By leveraging predictive models and analytics tools, it optimizes inputs like water, fertilizers, and pesticides, enhances crop yield, reduces operational costs, and promotes sustainable farming practices. This integration of technology and agronomy supports efficient, precise, and environmentally responsible agriculture management.
Market Dynamics:
Driver:
Increasing Demand for Sustainable Agriculture
The global precision agriculture analytics market is driven by the rising demand for sustainable agriculture practices. Farmers and agribusinesses are increasingly adopting data-driven approaches to optimize resource utilization, reduce environmental impact, and improve crop yields. Precision analytics enables efficient management of water, fertilizers, and pesticides, ensuring minimal waste while enhancing productivity. This shift toward environmentally responsible farming practices, supported by advanced technologies such as IoT, AI, and satellite imagery, continues to propel market growth globally.
Restraint:
High Initial Investment Costs
Despite its potential, the precision agriculture analytics market faces restraints due to high initial investment costs. Implementing advanced sensors, drones, GPS systems, and analytics platforms requires substantial capital, which can limit adoption, especially among small and medium-sized farms. Additionally, costs associated with system integration, training, and maintenance further hinder widespread deployment. These financial barriers can slow market penetration, particularly in developing regions, affecting the overall growth pace of precision agriculture analytics.
Opportunity:
Advancements in IoT, AI, and Big Data Analytics
Advancements in IoT, artificial intelligence, and big data analytics present significant opportunities for the precision agriculture analytics market. Enhanced sensor technologies, predictive modeling, and real-time data processing allow farmers to make informed decisions, optimize inputs, and increase productivity. Integration of AI-driven insights with large-scale agricultural datasets supports proactive farm management and risk mitigation. These technological innovations are opening new avenues for efficiency, scalability, and precision, driving increased adoption across both developed and emerging markets globally.
Threat:
Data Privacy and Security Concerns
Data privacy and security concerns pose a notable threat to the growth of the precision agriculture analytics market. As farms increasingly rely on IoT devices, cloud platforms, and connected systems to collect sensitive agricultural and operational data, the risk of unauthorized access, cyberattacks, and data breaches rises. Ensuring compliance with regulations, safeguarding proprietary farm information, and maintaining consumer trust are critical challenges. These security issues may delay adoption and limit the deployment of advanced analytics solutions in agriculture.
Covid-19 Impact:
The Covid-19 pandemic had a mixed impact on the market. While supply chain disruptions temporarily affected hardware availability and implementation timelines, the crisis also accelerated the adoption of digital farming solutions. Farmers increasingly relied on remote monitoring, predictive analytics, and automated decision-making to maintain productivity amidst labor shortages and movement restrictions. Overall, the pandemic highlighted the value of data driven agriculture, reinforcing the need for precision analytics and promoting long term market growth.
The weather analytics segment is expected to be the largest during the forecast period
The weather analytics segment is expected to account for the largest market share during the forecast period, due to critical need for accurate, real time weather information to optimize planting, irrigation, and harvesting schedules. By integrating satellite data, IoT sensors, and predictive models, farmers can mitigate risks associated with climate variability and extreme weather events. Enhanced weather insights support resource efficiency, reduce crop losses, and improve yield predictability, making weather analytics an essential component of precision agriculture solutions globally.
The farmers segment is expected to have the highest CAGR during the forecast period
Over the forecast period, the farmers segment is predicted to witness the highest growth rate, as increased awareness of precision agriculture benefits, coupled with government incentives and subsidies in several regions, is encouraging small and medium-scale farmers to adopt analytics driven farming practices. Tools that offer actionable insights into soil health, crop performance, and resource optimization enable farmers to reduce costs and enhance profitability. This growing accessibility and relevance of precision agriculture technologies are fueling rapid adoption and sustained market growth among end-user farmers globally.
Region with largest share:
During the forecast period, the North America region is expected to hold the largest market share, due to advanced agricultural infrastructure and widespread technology adoption. The region benefits from extensive investment in smart farming solutions, supportive government policies, and high awareness of precision agriculture benefits. Farmers in the U.S. and Canada increasingly leverage IoT devices, drones, and cloud-based analytics platforms to optimize operations, reduce resource consumption, and enhance yields. Robust R&D initiatives and early technology adoption maintain North America’s leading position in the market.
Region with highest CAGR:
Over the forecast period, the Asia Pacific region is anticipated to exhibit the highest CAGR, owing to rapid population growth, rising food demand, and increasing farm mechanization are driving the adoption of precision agriculture analytics in countries such as China, India, and Japan. Technological advancements, government initiatives supporting digital agriculture, and growing awareness of sustainable farming practices are accelerating market growth. This combination of high demand, innovation, and supportive policies positions the Asia Pacific region as the fastest-growing market for precision agriculture analytics globally.

Key players in the market
Some of the key players in Precision Agriculture Analytics Market include Deere & Company, Microsoft Corporation, Trimble Inc., Amazon Web Services, AGCO Corporation, Alphabet Inc. (Google), CNH Industrial, Ag Leader Technology, Farmers Edge Inc., CropX Technologies, AGRIVI, Hexagon Agriculture, Climate Corporation (Bayer), Proagrica, IBM Corporation.
Key Developments:
In September 2025, KOBELCO Construction Machinery U.S.A. and Trimble have deepened their partnership by making Trimble’s Earthworks 2D grade control systems available through select KOBELCO dealers across North America, letting customers more easily access precision machine guidance technology, installation, training, and support.
In October 2024, Caterpillar and Trimble have renewed their long standing joint venture to boost innovation and customer adoption of grade control solutions in the construction sector, expanding distribution and interoperability of these technologies to enhance safety, productivity and reach across equipment fleets.
Components Covered:
• Software
• Services
Deployment Modes Covered:
• Cloud-Based
• On-Premises
Farm Sizes Covered:
• Small Farms
• Medium Farms
• Large Farms
Technologies Covered:
• Remote Sensing
• IoT & Sensor Analytics
• GPS/GNSS Analytics
• Variable Rate Technology (VRT) Analytics
• AI & Machine Learning Analytics
Applications Covered:
• Crop Monitoring
• Yield Prediction & Forecasting
• Soil Analysis & Mapping
• Weather Analytics
• Irrigation Management
• Farm Financial Analytics
• Livestock Analytics
• Other Applications
End Users Covered:
• Farmers
• Agribusinesses
• Cooperatives
• Government & Research Institutions
Regions Covered:
• North America
o United States
o Canada
o Mexico
• Europe
o United Kingdom
o Germany
o France
o Italy
o Spain
o Netherlands
o Belgium
o Sweden
o Switzerland
o Poland
o Rest of Europe
• Asia Pacific
o China
o Japan
o India
o South Korea
o Australia
o Indonesia
o Thailand
o Malaysia
o Singapore
o Vietnam
o Rest of Asia Pacific
• South America
o Brazil
o Argentina
o Colombia
o Chile
o Peru
o Rest of South America
• Rest of the World (RoW)
o Middle East
§ Saudi Arabia
§ United Arab Emirates
§ Qatar
§ Israel
§ Rest of Middle East
o Africa
§ South Africa
§ Egypt
§ Morocco
§ Rest of Africa
What our report offers:
- Market share assessments for the regional and country-level segments
- Strategic recommendations for the new entrants
- Covers Market data for the years 2023, 2024, 2025, 2026, 2027, 2028, 2030, 2032 and 2034
- Market Trends (Drivers, Constraints, Opportunities, Threats, Challenges, Investment Opportunities, and recommendations)
- Strategic recommendations in key business segments based on the market estimations
- Competitive landscaping mapping the key common trends
- Company profiling with detailed strategies, financials, and recent developments
- Supply chain trends mapping the latest technological advancements
Free Customization Offerings:
All the customers of this report will be entitled to receive one of the following free customization options:
• Company Profiling
o Comprehensive profiling of additional market players (up to 3)
o SWOT Analysis of key players (up to 3)
• Regional Segmentation
o Market estimations, Forecasts and CAGR of any prominent country as per the client's interest (Note: Depends on feasibility check)
• Competitive Benchmarking
o Benchmarking of key players based on product portfolio, geographical presence, and strategic alliances
Table of Contents
1 Executive Summary
1.1 Market Snapshot and Key Highlights
1.2 Growth Drivers, Challenges, and Opportunities
1.3 Competitive Landscape Overview
1.4 Strategic Insights and Recommendations
2 Research Framework
2.1 Study Objectives and Scope
2.2 Stakeholder Analysis
2.3 Research Assumptions and Limitations
2.4 Research Methodology
2.4.1 Data Collection (Primary and Secondary)
2.4.2 Data Modeling and Estimation Techniques
2.4.3 Data Validation and Triangulation
2.4.4 Analytical and Forecasting Approach
3 Market Dynamics and Trend Analysis
3.1 Market Definition and Structure
3.2 Key Market Drivers
3.3 Market Restraints and Challenges
3.4 Growth Opportunities and Investment Hotspots
3.5 Industry Threats and Risk Assessment
3.6 Technology and Innovation Landscape
3.7 Emerging and High-Growth Markets
3.8 Regulatory and Policy Environment
3.9 Impact of COVID-19 and Recovery Outlook
4 Competitive and Strategic Assessment
4.1 Porter's Five Forces Analysis
4.1.1 Supplier Bargaining Power
4.1.2 Buyer Bargaining Power
4.1.3 Threat of Substitutes
4.1.4 Threat of New Entrants
4.1.5 Competitive Rivalry
4.2 Market Share Analysis of Key Players
4.3 Product Benchmarking and Performance Comparison
5 Global Precision Agriculture Analytics Market, By Component
5.1 Software
5.2 Services
6 Global Precision Agriculture Analytics Market, By Deployment Mode
6.1 Cloud-Based
6.2 On-Premises
7 Global Precision Agriculture Analytics Market, By Farm Size
7.1 Small Farms
7.2 Medium Farms
7.3 Large Farms
8 Global Precision Agriculture Analytics Market, By Technology
8.1 Remote Sensing
8.2 IoT & Sensor Analytics
8.3 GPS/GNSS Analytics
8.4 Variable Rate Technology (VRT) Analytics
8.5 AI & Machine Learning Analytics
9 Global Precision Agriculture Analytics Market, By Application
9.1 Crop Monitoring
9.2 Yield Prediction & Forecasting
9.3 Soil Analysis & Mapping
9.4 Weather Analytics
9.5 Irrigation Management
9.6 Farm Financial Analytics
9.7 Livestock Analytics
9.8 Other Applications
10 Global Precision Agriculture Analytics Market, By End User
10.1 Farmers
10.2 Agribusinesses
10.3 Cooperatives
10.4 Government & Research Institutions
11 Global Precision Agriculture Analytics Market, By Geography
11.1 North America
11.1.1 United States
11.1.2 Canada
11.1.3 Mexico
11.2 Europe
11.2.1 United Kingdom
11.2.2 Germany
11.2.3 France
11.2.4 Italy
11.2.5 Spain
11.2.6 Netherlands
11.2.7 Belgium
11.2.8 Sweden
11.2.9 Switzerland
11.2.10 Poland
11.2.11 Rest of Europe
11.3 Asia Pacific
11.3.1 China
11.3.2 Japan
11.3.3 India
11.3.4 South Korea
11.3.5 Australia
11.3.6 Indonesia
11.3.7 Thailand
11.3.8 Malaysia
11.3.9 Singapore
11.3.10 Vietnam
11.3.11 Rest of Asia Pacific
11.4 South America
11.4.1 Brazil
11.4.2 Argentina
11.4.3 Colombia
11.4.4 Chile
11.4.5 Peru
11.4.6 Rest of South America
11.5 Rest of the World (RoW)
11.5.1 Middle East
11.5.1.1 Saudi Arabia
11.5.1.2 United Arab Emirates
11.5.1.3 Qatar
11.5.1.4 Israel
11.5.1.5 Rest of Middle East
11.5.2 Africa
11.5.2.1 South Africa
11.5.2.2 Egypt
11.5.2.3 Morocco
11.5.2.4 Rest of Africa
12 Strategic Market Intelligence
12.1 Industry Value Network and Supply Chain Assessment
12.2 White-Space and Opportunity Mapping
12.3 Product Evolution and Market Life Cycle Analysis
12.4 Channel, Distributor, and Go-to-Market Assessment
13 Industry Developments and Strategic Initiatives
13.1 Mergers and Acquisitions
13.2 Partnerships, Alliances, and Joint Ventures
13.3 New Product Launches and Certifications
13.4 Capacity Expansion and Investments
13.5 Other Strategic Initiatives
14 Company Profiles
14.1 Deere & Company
14.2 Microsoft Corporation
14.3 Trimble Inc.
14.4 Amazon Web Services
14.5 AGCO Corporation
14.6 Alphabet Inc. (Google)
14.7 CNH Industrial
14.8 Ag Leader Technology
14.9 Farmers Edge Inc.
14.10 CropX Technologies
14.11 AGRIVI
14.12 Hexagon Agriculture
14.13 Climate Corporation (Bayer)
14.14 Proagrica
14.15 IBM Corporation
List of Tables
1 Global Precision Agriculture Analytics Market Outlook, By Region (2023-2034) ($MN)
2 Global Precision Agriculture Analytics Market Outlook, By Component (2023-2034) ($MN)
3 Global Precision Agriculture Analytics Market Outlook, By Software (2023-2034) ($MN)
4 Global Precision Agriculture Analytics Market Outlook, By Services (2023-2034) ($MN)
5 Global Precision Agriculture Analytics Market Outlook, By Deployment Mode (2023-2034) ($MN)
6 Global Precision Agriculture Analytics Market Outlook, By Cloud-Based (2023-2034) ($MN)
7 Global Precision Agriculture Analytics Market Outlook, By On-Premises (2023-2034) ($MN)
8 Global Precision Agriculture Analytics Market Outlook, By Farm Size (2023-2034) ($MN)
9 Global Precision Agriculture Analytics Market Outlook, By Small Farms (2023-2034) ($MN)
10 Global Precision Agriculture Analytics Market Outlook, By Medium Farms (2023-2034) ($MN)
11 Global Precision Agriculture Analytics Market Outlook, By Large Farms (2023-2034) ($MN)
12 Global Precision Agriculture Analytics Market Outlook, By Technology (2023-2034) ($MN)
13 Global Precision Agriculture Analytics Market Outlook, By Remote Sensing (2023-2034) ($MN)
14 Global Precision Agriculture Analytics Market Outlook, By IoT & Sensor Analytics (2023-2034) ($MN)
15 Global Precision Agriculture Analytics Market Outlook, By GPS/GNSS Analytics (2023-2034) ($MN)
16 Global Precision Agriculture Analytics Market Outlook, By Variable Rate Technology (VRT) Analytics (2023-2034) ($MN)
17 Global Precision Agriculture Analytics Market Outlook, By AI & Machine Learning Analytics (2023-2034) ($MN)
18 Global Precision Agriculture Analytics Market Outlook, By Application (2023-2034) ($MN)
19 Global Precision Agriculture Analytics Market Outlook, By Crop Monitoring (2023-2034) ($MN)
20 Global Precision Agriculture Analytics Market Outlook, By Yield Prediction & Forecasting (2023-2034) ($MN)
21 Global Precision Agriculture Analytics Market Outlook, By Soil Analysis & Mapping (2023-2034) ($MN)
22 Global Precision Agriculture Analytics Market Outlook, By Weather Analytics (2023-2034) ($MN)
23 Global Precision Agriculture Analytics Market Outlook, By Irrigation Management (2023-2034) ($MN)
24 Global Precision Agriculture Analytics Market Outlook, By Farm Financial Analytics (2023-2034) ($MN)
25 Global Precision Agriculture Analytics Market Outlook, By Livestock Analytics (2023-2034) ($MN)
26 Global Precision Agriculture Analytics Market Outlook, By Other Applications (2023-2034) ($MN)
27 Global Precision Agriculture Analytics Market Outlook, By End User (2023-2034) ($MN)
28 Global Precision Agriculture Analytics Market Outlook, By Farmers (2023-2034) ($MN)
29 Global Precision Agriculture Analytics Market Outlook, By Agribusinesses (2023-2034) ($MN)
30 Global Precision Agriculture Analytics Market Outlook, By Cooperatives (2023-2034) ($MN)
31 Global Precision Agriculture Analytics Market Outlook, By Government & Research Institutions (2023-2034) ($MN)
Note: Tables for North America, Europe, APAC, South America, and Rest of the World (RoW) Regions are also represented in the same manner as above.
List of Figures
RESEARCH METHODOLOGY

We at ‘Stratistics’ opt for an extensive research approach which involves data mining, data validation, and data analysis. The various research sources include in-house repository, secondary research, competitor’s sources, social media research, client internal data, and primary research.
Our team of analysts prefers the most reliable and authenticated data sources in order to perform the comprehensive literature search. With access to most of the authenticated data bases our team highly considers the best mix of information through various sources to obtain extensive and accurate analysis.
Each report takes an average time of a month and a team of 4 industry analysts. The time may vary depending on the scope and data availability of the desired market report. The various parameters used in the market assessment are standardized in order to enhance the data accuracy.
Data Mining
The data is collected from several authenticated, reliable, paid and unpaid sources and is filtered depending on the scope & objective of the research. Our reports repository acts as an added advantage in this procedure. Data gathering from the raw material suppliers, distributors and the manufacturers is performed on a regular basis, this helps in the comprehensive understanding of the products value chain. Apart from the above mentioned sources the data is also collected from the industry consultants to ensure the objective of the study is in the right direction.
Market trends such as technological advancements, regulatory affairs, market dynamics (Drivers, Restraints, Opportunities and Challenges) are obtained from scientific journals, market related national & international associations and organizations.
Data Analysis
From the data that is collected depending on the scope & objective of the research the data is subjected for the analysis. The critical steps that we follow for the data analysis include:
- Product Lifecycle Analysis
- Competitor analysis
- Risk analysis
- Porters Analysis
- PESTEL Analysis
- SWOT Analysis
The data engineering is performed by the core industry experts considering both the Marketing Mix Modeling and the Demand Forecasting. The marketing mix modeling makes use of multiple-regression techniques to predict the optimal mix of marketing variables. Regression factor is based on a number of variables and how they relate to an outcome such as sales or profits.
Data Validation
The data validation is performed by the exhaustive primary research from the expert interviews. This includes telephonic interviews, focus groups, face to face interviews, and questionnaires to validate our research from all aspects. The industry experts we approach come from the leading firms, involved in the supply chain ranging from the suppliers, distributors to the manufacturers and consumers so as to ensure an unbiased analysis.
We are in touch with more than 15,000 industry experts with the right mix of consultants, CEO's, presidents, vice presidents, managers, experts from both supply side and demand side, executives and so on.
The data validation involves the primary research from the industry experts belonging to:
- Leading Companies
- Suppliers & Distributors
- Manufacturers
- Consumers
- Industry/Strategic Consultants
Apart from the data validation the primary research also helps in performing the fill gap research, i.e. providing solutions for the unmet needs of the research which helps in enhancing the reports quality.
For more details about research methodology, kindly write to us at info@strategymrc.com
Frequently Asked Questions
In case of any queries regarding this report, you can contact the customer service by filing the “Inquiry Before Buy” form available on the right hand side. You may also contact us through email: info@strategymrc.com or phone: +1-301-202-5929
Yes, the samples are available for all the published reports. You can request them by filling the “Request Sample” option available in this page.
Yes, you can request a sample with your specific requirements. All the customized samples will be provided as per the requirement with the real data masked.
All our reports are available in Digital PDF format. In case if you require them in any other formats, such as PPT, Excel etc you can submit a request through “Inquiry Before Buy” form available on the right hand side. You may also contact us through email: info@strategymrc.com or phone: +1-301-202-5929
We offer a free 15% customization with every purchase. This requirement can be fulfilled for both pre and post sale. You may send your customization requirements through email at info@strategymrc.com or call us on +1-301-202-5929.
We have 3 different licensing options available in electronic format.
- Single User Licence: Allows one person, typically the buyer, to have access to the ordered product. The ordered product cannot be distributed to anyone else.
- 2-5 User Licence: Allows the ordered product to be shared among a maximum of 5 people within your organisation.
- Corporate License: Allows the product to be shared among all employees of your organisation regardless of their geographical location.
All our reports are typically be emailed to you as an attachment.
To order any available report you need to register on our website. The payment can be made either through CCAvenue or PayPal payments gateways which accept all international cards.
We extend our support to 6 months post sale. A post sale customization is also provided to cover your unmet needs in the report.
Request Customization
We offer complimentary customization of up to 15% with every purchase. To share your customization requirements, feel free to email us at info@strategymrc.com or call us on +1-301-202-5929. .
Please Note: Customization within the 15% threshold is entirely free of charge. If your request exceeds this limit, we will conduct a feasibility assessment. Following that, a detailed quote and timeline will be provided.
WHY CHOOSE US ?

Assured Quality
Best in class reports with high standard of research integrity

24X7 Research Support
Continuous support to ensure the best customer experience.

Free Customization
Adding more values to your product of interest.

Safe & Secure Access
Providing a secured environment for all online transactions.

Trusted by 600+ Brands
Serving the most reputed brands across the world.