
Proactive Security Market
Proactive Security Market Forecasts to 2030 - Global Analysis By Component (Services and Solutions), Organization Size, End User and By Geography

|
Years Covered |
2021-2030 |
|
Estimated Year Value (2023) |
US $41.77 BN |
|
Projected Year Value (2030) |
US $126.11BN |
|
CAGR (2023 - 2030) |
17.1% |
|
Regions Covered |
North America, Europe, Asia Pacific, South America, and Middle East & Africa |
|
Countries Covered |
US, Canada, Mexico, Germany, UK, Italy, France, Spain, Japan, China, India, Australia, New Zealand, South Korea, Rest of Asia Pacific, South America, Argentina, Brazil, Chile, Middle East & Africa, Saudi Arabia, UAE, Qatar, and South Africa |
|
Largest Market |
North America |
|
Highest Growing Market |
Asia Pacific |
According to Stratistics MRC, the Global Proactive Security Market is accounted for $41.77 billion in 2023 and is expected to reach $126.11 billion by 2030 growing at a CAGR of 17.1% during the forecast period. A strategy to protecting computer systems, networks, data, and other digital assets known as proactive security or proactive cybersecurity which focuses on preventing and mitigating security threats before they can do harm. Reactive security, on the other hand, responds to security incidents after they have already happened. Implementing preventative measures and industry standard practices can help to decrease the likelihood of security breaches. This entails patching and updating software on a regular basis, putting in place strict access limits, and using reliable authentication techniques.
According to data from the Financial Conduct Authority (FCA), has increased by more than 80%, in 2018. Considering that cyber-attacks have a direct impact on the churn rate, the financial service providers are expected to strengthen their security solutions.
Market Dynamics:
Driver:
IoT proliferation and digital transformation
IoT device proliferation across industries creates fresh security difficulties. To protect IoT networks and devices and stop vulnerabilities from being exploited, proactive security is essential. Moreover, organizations' attack surfaces grow as a result of digital transformation projects. In order to protect these new digital frontiers, proactive security is required with the proliferation of cloud services, IoT devices, and mobile technologies due to which organizations are getting more and more worried about the security of their partners and third-party suppliers. Assessing and reducing third-party risks are examples of proactive security procedures that protect the ecosystem of the firm.
Restraint:
Rapid threat landscape evolution
The threat landscape for cybersecurity is always changing as attackers create new strategies and methods. It takes constant innovation and modification in proactive security measures to stay ahead of these threats. There are many companies offering a variety of proactive security solutions in the competitive cybersecurity market. Organizations may find it challenging to select the ideal goods and services that meet their unique requirements as a result of this fragmentation thereby hampering the market growth.
Opportunity:
Zero trust security with advanced threat detection and response
Companies have opportunities to offer solutions and services that enforce stringent access controls and continuously verify the identity and security posture of users and devices as a result of the adoption of the Zero Trust security model, which operates under the assumption that nobody, inside or outside the network, can be trusted. An important opportunity is to create and improve AI-driven threat detection and response systems that can recognize and counter advanced threats instantly. This includes analyzing behavioral patterns and spotting anomalies that can point to a cyberattack using machine learning techniques which drives the growth of the market.
Threat:
Zero-day vulnerabilities
Threat actors frequently target zero-day vulnerabilities, which are security weaknesses that have not yet been patched and are unknown. Until updates are released, preventative security measures might not be able to stop attacks that take advantage of these vulnerabilities. Moreover, malicious insiders or workers who unintentionally damage security and these insider threats may be difficult to identify through proactive security measures, particularly if the insider's actions seem legitimate. Hence all the above factors hamper the proactive security market.
Covid-19 Impact
The proactive security industry and the state of cybersecurity as a whole were significantly impacted by the COVID-19 epidemic. Cyberattacks increased as a result of the pandemic. Threat actors took advantage of the confusion and weaknesses brought on by the quick transition to remote work and the rising usage of online services. To combat these attacks, proactive security measures become even more important. The movement of a significant section of the global workforce to remote work made securing remote access and endpoints a primary issue. To safeguard remote workers and the networks they accessed from diverse locations, proactive security measures were required. The lack of qualified cybersecurity professionals was made worse by the pandemic. Organizations struggled to find and keep talent for proactive security initiatives.
The large enterprises segment is expected to be the largest during the forecast period
The large enterprises segment is estimated to have a lucrative growth, due to their size, complexity, and the allure of their assets to hackers, large businesses face special potential threats. To identify and prioritize potential risks and weaknesses, they start by completing a thorough risk assessment. It's important to concentrate on the most important assets because large businesses frequently have a wide variety of assets. Keep a current inventory of all digital assets, including network infrastructure, data, hardware, and software. The basis for preventative security measures is this inventory propel the market.
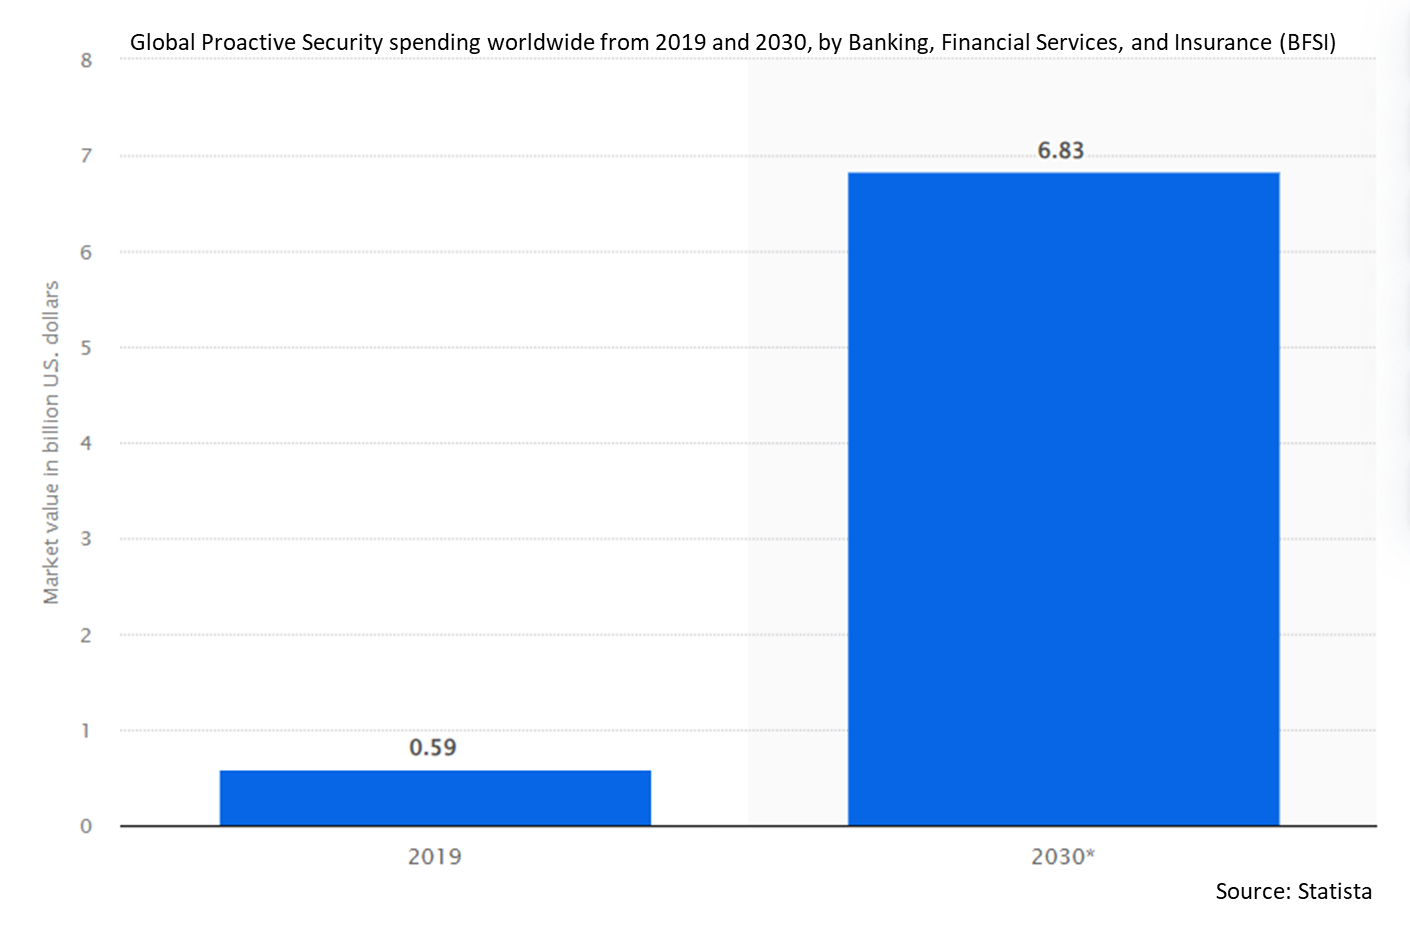
The banking, financial services, and insurance (Banking, Financial Services and Insurance (BFSI)) segment is expected to have the highest CAGR during the forecast period
The banking, financial services, and insurance (Banking, Financial Services and Insurance (BFSI)) segment is anticipated to witness the highest CAGR growth during the forecast period, as Banking, Financial Services and Insurance (BFSI) businesses must adhere to strict legal and regulatory requirements regarding information security. To protect banking IT assets and data from malware and ransom ware, banks and other financial service providers are aggressively implementing proactive security solutions. Additionally, the security providers are well-equipped to handle the modern vulnerability system in order to secure the Banking, Financial Services and Insurance (BFSI) industry, to the normal initiatives like encryption, solutions, such as advanced malware protection, security analytics, and vulnerability management, among others.
Region with largest share:
North America is projected to hold the largest market share during the forecast period owing to growing requirement to defend their data against sophisticated cyber-attacks and comply with strict governmental laws. Through security analytics, AMP, security monitoring, attack simulation, security orchestration, and risk & vulnerability management, security companies all around the North American region are providing proactive security solutions. Organizations have raised their IT security investments to safeguard against cutting-edge attacks as the frequency of security breaches has significantly grown over the previous five years in this region.
Region with highest CAGR:
Asia Pacific is projected to have the highest CAGR over the forecast period, owing to the panorama of cyber threats in the APAC region is still continuously changing. Organizations in the area are progressively implementing preventative security measures to safeguard their digital assets as a result of a large rise in cyberattacks, including advanced persistent threats (APTs), ransomware, and phishing assaults. The need for proactive security is being driven by the tremendous digital revolution occurring across numerous industries in the APAC region such as the adoption of cloud computing, IoT (Internet of Things), and mobile technologies by businesses has increased their susceptibility to cyberattacks.

Key players in the market
Some of the key players profiled in the Proactive Security Market include Oracle Corp., Phantom, FireEye Inc., IBM Corp., Rapid7 Inc., RSA Security LLC (Dell Technologies), Cygilant Inc., Qualys Inc., Trustwave Holdings Inc., ThreatConnect Inc., AlienVault Inc.(AT&T Cybersecurity) , Palo Alto Networks, Symantec Corporation, Siemplify, Cisco Corporation, Skybox Security and Trustwave
Key Developments:
In September 2023, Oracle expands distributed cloud offerings to help organizations innovate anywhere. The latest additions to OCI’s distributed cloud include Oracle Database@Azure and MySQL HeatWave Lakehouse on AWS.
In September 2023, Oracle and Red Hat Expand Collaboration to Bring Red Hat OpenShift to Oracle Cloud Infrastructure. As part of the expanded collaboration, Red Hat OpenShift, the industry’s leading hybrid cloud application platform powered by Kubernetes for architecting, building, and deploying cloud-native applications, will be supported and certified to run on OCI.
In August 2023, Francisco partners to acquire The Weather Company Assets from IBM, The assets being acquired by Francisco Partners include The Weather Company's digital consumer-facing offerings.
Components Covered:
• Services
• Solutions
Organization Sizes Covered:
• Large Enterprises
• Small & Medium-sized Enterprises
End Users Covered:
• Banking, Financial Services, and Insurance (BFSI)
• Energy & Utilities
• Government and Defense
• Healthcare & Life Sciences
• IT & Telecom
• Manufacturing
• Media & Entertainment
• Retail & eCommerce
• Travel & Hospitality
• Other End Users
Regions Covered:
• North America
o US
o Canada
o Mexico
• Europe
o Germany
o UK
o Italy
o France
o Spain
o Rest of Europe
• Asia Pacific
o Japan
o China
o India
o Australia
o New Zealand
o South Korea
o Rest of Asia Pacific
• South America
o Argentina
o Brazil
o Chile
o Rest of South America
• Middle East & Africa
o Saudi Arabia
o UAE
o Qatar
o South Africa
o Rest of Middle East & Africa
What our report offers:
- Market share assessments for the regional and country-level segments
- Strategic recommendations for the new entrants
- Covers Market data for the years 2021, 2022, 2023, 2026, and 2030
- Market Trends (Drivers, Constraints, Opportunities, Threats, Challenges, Investment Opportunities, and recommendations)
- Strategic recommendations in key business segments based on the market estimations
- Competitive landscaping mapping the key common trends
- Company profiling with detailed strategies, financials, and recent developments
- Supply chain trends mapping the latest technological advancements
Free Customization Offerings:
All the customers of this report will be entitled to receive one of the following free customization options:
• Company Profiling
o Comprehensive profiling of additional market players (up to 3)
o SWOT Analysis of key players (up to 3)
• Regional Segmentation
o Market estimations, Forecasts and CAGR of any prominent country as per the client's interest (Note: Depends on feasibility check)
• Competitive Benchmarking
o Benchmarking of key players based on product portfolio, geographical presence, and strategic alliances
Table of Contents
1 Executive Summary
2 Preface
2.1 Abstract
2.2 Stake Holders
2.3 Research Scope
2.4 Research Methodology
2.4.1 Data Mining
2.4.2 Data Analysis
2.4.3 Data Validation
2.4.4 Research Approach
2.5 Research Sources
2.5.1 Primary Research Sources
2.5.2 Secondary Research Sources
2.5.3 Assumptions
3 Market Trend Analysis
3.1 Introduction
3.2 Drivers
3.3 Restraints
3.4 Opportunities
3.5 Threats
3.6 End User Analysis
3.7 Emerging Markets
3.8 Impact of Covid-19
4 Porters Five Force Analysis
4.1 Bargaining power of suppliers
4.2 Bargaining power of buyers
4.3 Threat of substitutes
4.4 Threat of new entrants
4.5 Competitive rivalry
5 Global Proactive Security Market, By Component
5.1 Introduction
5.2 Services
5.2.1 Managed Services
5.2.2 Professional Services
5.2.2.1 Consulting Services
5.2.2.2 Design & Integration Services
5.2.2.3 Support & Maintenance Services
5.2.2.4 Training & Education Services
5.3 Solutions
5.3.1 Advanced Malware Protection (AMP)
5.3.2 Attack Simulation
5.3.3 Risk & Vulnerability Management
5.3.4 Security Analytics
5.3.5 Security Monitoring
5.3.6 Security Orchestration
6 Global Proactive Security Market, By Organization Size
6.1 Introduction
6.2 Large Enterprises
6.3 Small & Medium-sized Enterprises
7 Global Proactive Security Market, By End User
7.1 Introduction
7.2 Banking, Financial Services, and Insurance (BFSI)
7.3 Energy & Utilities
7.4 Government and Defense
7.5 Healthcare & Life Sciences
7.6 IT & Telecom
7.7 Manufacturing
7.8 Media & Entertainment
7.9 Retail & eCommerce
7.10 Travel & Hospitality
7.11 Other End Users
8 Global Proactive Security Market, By Geography
8.1 Introduction
8.2 North America
8.2.1 US
8.2.2 Canada
8.2.3 Mexico
8.3 Europe
8.3.1 Germany
8.3.2 UK
8.3.3 Italy
8.3.4 France
8.3.5 Spain
8.3.6 Rest of Europe
8.4 Asia Pacific
8.4.1 Japan
8.4.2 China
8.4.3 India
8.4.4 Australia
8.4.5 New Zealand
8.4.6 South Korea
8.4.7 Rest of Asia Pacific
8.5 South America
8.5.1 Argentina
8.5.2 Brazil
8.5.3 Chile
8.5.4 Rest of South America
8.6 Middle East & Africa
8.6.1 Saudi Arabia
8.6.2 UAE
8.6.3 Qatar
8.6.4 South Africa
8.6.5 Rest of Middle East & Africa
9 Key Developments
9.1 Agreements, Partnerships, Collaborations and Joint Ventures
9.2 Acquisitions & Mergers
9.3 New Product Launch
9.4 Expansions
9.5 Other Key Strategies
10 Company Profiling
10.1 Oracle Corp.
10.2 Phantom
10.3 FireEye Inc.
10.4 IBM Corp.
10.5 Rapid7 Inc.
10.6 RSA Security LLC (Dell Technologies)
10.7 Cygilant Inc.
10.8 Qualys Inc.
10.9 Trustwave Holdings Inc.
10.10 ThreatConnect Inc.
10.11 AlienVault Inc. (AT&T Cybersecurity)
10.12 Palo Alto Networks
10.13 Symantec Corporation
10.14 Siemplify
10.15 Cisco Corporation
10.16 Skybox Security
10.17 Trustwave
List of Tables
1 Global Proactive Security Market Outlook, By Region (2021-2030) ($MN)
2 Global Proactive Security Market Outlook, By Component (2021-2030) ($MN)
3 Global Proactive Security Market Outlook, By Services (2021-2030) ($MN)
4 Global Proactive Security Market Outlook, By Managed Services (2021-2030) ($MN)
5 Global Proactive Security Market Outlook, By Professional Services (2021-2030) ($MN)
6 Global Proactive Security Market Outlook, By Consulting Services (2021-2030) ($MN)
7 Global Proactive Security Market Outlook, By Design & Integration Services (2021-2030) ($MN)
8 Global Proactive Security Market Outlook, By Support & Maintenance Services (2021-2030) ($MN)
9 Global Proactive Security Market Outlook, By Training & Education Services (2021-2030) ($MN)
10 Global Proactive Security Market Outlook, By Solutions (2021-2030) ($MN)
11 Global Proactive Security Market Outlook, By Advanced Malware Protection (AMP) (2021-2030) ($MN)
12 Global Proactive Security Market Outlook, By Attack Simulation (2021-2030) ($MN)
13 Global Proactive Security Market Outlook, By Risk & Vulnerability Management (2021-2030) ($MN)
14 Global Proactive Security Market Outlook, By Security Analytics (2021-2030) ($MN)
15 Global Proactive Security Market Outlook, By Security Monitoring (2021-2030) ($MN)
16 Global Proactive Security Market Outlook, By Security Orchestration (2021-2030) ($MN)
17 Global Proactive Security Market Outlook, By Organization Size (2021-2030) ($MN)
18 Global Proactive Security Market Outlook, By Large Enterprises (2021-2030) ($MN)
19 Global Proactive Security Market Outlook, By Small & Medium-sized Enterprises (2021-2030) ($MN)
20 Global Proactive Security Market Outlook, By End User (2021-2030) ($MN)
21 Global Proactive Security Market Outlook, By Banking, Financial Services, and Insurance (BFSI) (2021-2030) ($MN)
22 Global Proactive Security Market Outlook, By Energy & Utilities (2021-2030) ($MN)
23 Global Proactive Security Market Outlook, By Government and Defense (2021-2030) ($MN)
24 Global Proactive Security Market Outlook, By Healthcare & Life Sciences (2021-2030) ($MN)
25 Global Proactive Security Market Outlook, By IT & Telecom (2021-2030) ($MN)
26 Global Proactive Security Market Outlook, By Manufacturing (2021-2030) ($MN)
27 Global Proactive Security Market Outlook, By Media & Entertainment (2021-2030) ($MN)
28 Global Proactive Security Market Outlook, By Retail & eCommerce (2021-2030) ($MN)
29 Global Proactive Security Market Outlook, By Travel & Hospitality (2021-2030) ($MN)
30 Global Proactive Security Market Outlook, By Other End Users (2021-2030) ($MN)
Note: Tables for North America, Europe, APAC, South America, and Middle East & Africa Regions are also represented in the same manner as above.
List of Figures
RESEARCH METHODOLOGY

We at ‘Stratistics’ opt for an extensive research approach which involves data mining, data validation, and data analysis. The various research sources include in-house repository, secondary research, competitor’s sources, social media research, client internal data, and primary research.
Our team of analysts prefers the most reliable and authenticated data sources in order to perform the comprehensive literature search. With access to most of the authenticated data bases our team highly considers the best mix of information through various sources to obtain extensive and accurate analysis.
Each report takes an average time of a month and a team of 4 industry analysts. The time may vary depending on the scope and data availability of the desired market report. The various parameters used in the market assessment are standardized in order to enhance the data accuracy.
Data Mining
The data is collected from several authenticated, reliable, paid and unpaid sources and is filtered depending on the scope & objective of the research. Our reports repository acts as an added advantage in this procedure. Data gathering from the raw material suppliers, distributors and the manufacturers is performed on a regular basis, this helps in the comprehensive understanding of the products value chain. Apart from the above mentioned sources the data is also collected from the industry consultants to ensure the objective of the study is in the right direction.
Market trends such as technological advancements, regulatory affairs, market dynamics (Drivers, Restraints, Opportunities and Challenges) are obtained from scientific journals, market related national & international associations and organizations.
Data Analysis
From the data that is collected depending on the scope & objective of the research the data is subjected for the analysis. The critical steps that we follow for the data analysis include:
- Product Lifecycle Analysis
- Competitor analysis
- Risk analysis
- Porters Analysis
- PESTEL Analysis
- SWOT Analysis
The data engineering is performed by the core industry experts considering both the Marketing Mix Modeling and the Demand Forecasting. The marketing mix modeling makes use of multiple-regression techniques to predict the optimal mix of marketing variables. Regression factor is based on a number of variables and how they relate to an outcome such as sales or profits.
Data Validation
The data validation is performed by the exhaustive primary research from the expert interviews. This includes telephonic interviews, focus groups, face to face interviews, and questionnaires to validate our research from all aspects. The industry experts we approach come from the leading firms, involved in the supply chain ranging from the suppliers, distributors to the manufacturers and consumers so as to ensure an unbiased analysis.
We are in touch with more than 15,000 industry experts with the right mix of consultants, CEO's, presidents, vice presidents, managers, experts from both supply side and demand side, executives and so on.
The data validation involves the primary research from the industry experts belonging to:
- Leading Companies
- Suppliers & Distributors
- Manufacturers
- Consumers
- Industry/Strategic Consultants
Apart from the data validation the primary research also helps in performing the fill gap research, i.e. providing solutions for the unmet needs of the research which helps in enhancing the reports quality.
For more details about research methodology, kindly write to us at info@strategymrc.com
Frequently Asked Questions
In case of any queries regarding this report, you can contact the customer service by filing the “Inquiry Before Buy” form available on the right hand side. You may also contact us through email: info@strategymrc.com or phone: +1-301-202-5929
Yes, the samples are available for all the published reports. You can request them by filling the “Request Sample” option available in this page.
Yes, you can request a sample with your specific requirements. All the customized samples will be provided as per the requirement with the real data masked.
All our reports are available in Digital PDF format. In case if you require them in any other formats, such as PPT, Excel etc you can submit a request through “Inquiry Before Buy” form available on the right hand side. You may also contact us through email: info@strategymrc.com or phone: +1-301-202-5929
We offer a free 15% customization with every purchase. This requirement can be fulfilled for both pre and post sale. You may send your customization requirements through email at info@strategymrc.com or call us on +1-301-202-5929.
We have 3 different licensing options available in electronic format.
- Single User Licence: Allows one person, typically the buyer, to have access to the ordered product. The ordered product cannot be distributed to anyone else.
- 2-5 User Licence: Allows the ordered product to be shared among a maximum of 5 people within your organisation.
- Corporate License: Allows the product to be shared among all employees of your organisation regardless of their geographical location.
All our reports are typically be emailed to you as an attachment.
To order any available report you need to register on our website. The payment can be made either through CCAvenue or PayPal payments gateways which accept all international cards.
We extend our support to 6 months post sale. A post sale customization is also provided to cover your unmet needs in the report.
Request Customization
We offer complimentary customization of up to 15% with every purchase. To share your customization requirements, feel free to email us at info@strategymrc.com or call us on +1-301-202-5929. .
Please Note: Customization within the 15% threshold is entirely free of charge. If your request exceeds this limit, we will conduct a feasibility assessment. Following that, a detailed quote and timeline will be provided.
WHY CHOOSE US ?

Assured Quality
Best in class reports with high standard of research integrity

24X7 Research Support
Continuous support to ensure the best customer experience.

Free Customization
Adding more values to your product of interest.

Safe & Secure Access
Providing a secured environment for all online transactions.

Trusted by 600+ Brands
Serving the most reputed brands across the world.