
Process Safety Services Market
Process Safety Services Market Forecasts to 2028 - Global Analysis By Service (Consulting, Training, Certification and Auditing), Solution (Compliance Management, Process Hazard Analysis (PHA), Safety Instrumented Systems (SIS), Dust Hazard Analysis (DHA), Risk Management Programs (RMP), Facility Siting, Incident Investigation & Response , Mechanical Integrity, PSM Program Implementation and Other Solutions), Application, End User and By Geography

|
Years Covered |
2020-2028 |
|
Estimated Year Value (2022) |
US $5.53 BN |
|
Projected Year Value (2028) |
US $38.17 BN |
|
CAGR (2022 - 2028) |
37.98% |
|
Regions Covered |
North America, Europe, Asia Pacific, South America, and Middle East & Africa |
|
Countries Covered |
US, Canada, Mexico, Germany, UK, Italy, France, Spain, Japan, China, India, Australia, New Zealand, South Korea, Rest of Asia Pacific, South America, Argentina, Brazil, Chile, Middle East & Africa, Saudi Arabia, UAE, Qatar, and South Africa |
|
Largest Market |
Asia Pacific |
|
Highest Growing Market |
Asia Pacific |
According to Stratistics MRC, the Global Process Safety Services Market is accounted for $5.53 billion in 2022 and is expected to reach $38.17 billion by 2028 growing at a CAGR of 37.98% during the forecast period. Process safety is the safeguarding of assets and people against catastrophic and episodic incidents brought on by unanticipated or unplanned changes in process conditions. Process safety services aid clients in methodically and efficiently completing their health, safety and environmental compliance obligations. Providers of process safety services offer a method for comprehending and managing process risks as well as support for boosting productivity and dependability, enhancing safety and security, and enhancing overall business performance.
According to statistics from the Ministry of Labor and Social Affairs, in Iraq, the accident rate in the construction industry is 38% of the total industrial accident rate.
Market Dynamics:
Driver:
Presence of numerous organisations
The growth of numerous organisations of various sizes and functions increases investments in advanced technologies. They increase in the number of mergers and acquisitions. The high functioning of organization also raises complexities of business operations. A safety system provides organisations with a framework to improve employee safety and health, reduce workplace risks and create better, safer working conditions. It enables organisation with continual improvement which is fuelling its demand.
Restraint:
Lack of skilled labour
Lack of skilled workers automatically results in poor safety behaviours due to poor safety awareness and inadequate knowledge on how to work safely. This poor performance adversely affects the national economy and the bottom line of the organizations. It directly affects the effectiveness at operating facilities. This aspect is hindering the market growth.
Opportunity:
Growing need to reduce hazardous events
Safety services are considered as the leading mechanisms in the promotion of health and safety to the employees. It prevents unwanted hydrocarbon or chemical releases. It reduces exposure to lawsuits, penalties and public liability claims. It provides protection for its corporate image. It ensures and improves operability, productivity, stability and quality. All these aspects drive the growth of the market.
Threat:
Dearth of required infrastructural facilities
Facilities management and infrastructure renewal need to be recognized as critical aspects in any organization. Both the employer and the workforce are impacted by poor repair and maintenance, challenging resource access, and service delivery scalability. It slows down manufacturing and impacts the company's earnings. While handling hazardous products and working in risky settings, improper facilities might hurt the workers. The growth is being hampered by these possibilities.
Covid-19 Impact
The COVID-19 has an influence on every organization in the world. Due to social isolation, limitations on the sale of particular goods, clients cutting costs and postponing projects, sales have suffered a severe fall. Numerous firms shut their doors and went remote to do business. There were several workplace inconveniences and difficulties. Organizations are reclaiming their position and providing a wide range of services to their employees in the wake of the epidemic.
The emergency shutdown segment is expected to be the largest during the forecast period
The emergency shutdown segment is estimated to have a lucrative growth, due to its quick actions. The emergency shutdown is key for providing safe operations which accelerates the resumption of normal operations. They are highly specialized reliable control systems for high risk industries like Oil and Gas, Nuclear Power or other environments with explosion risk. In the event that the process exceeds the control margins, they serve to protect the people, the equipment and the environment. Its prompt response to emergencies and prevention of contamination is promoting the segment's expansion.
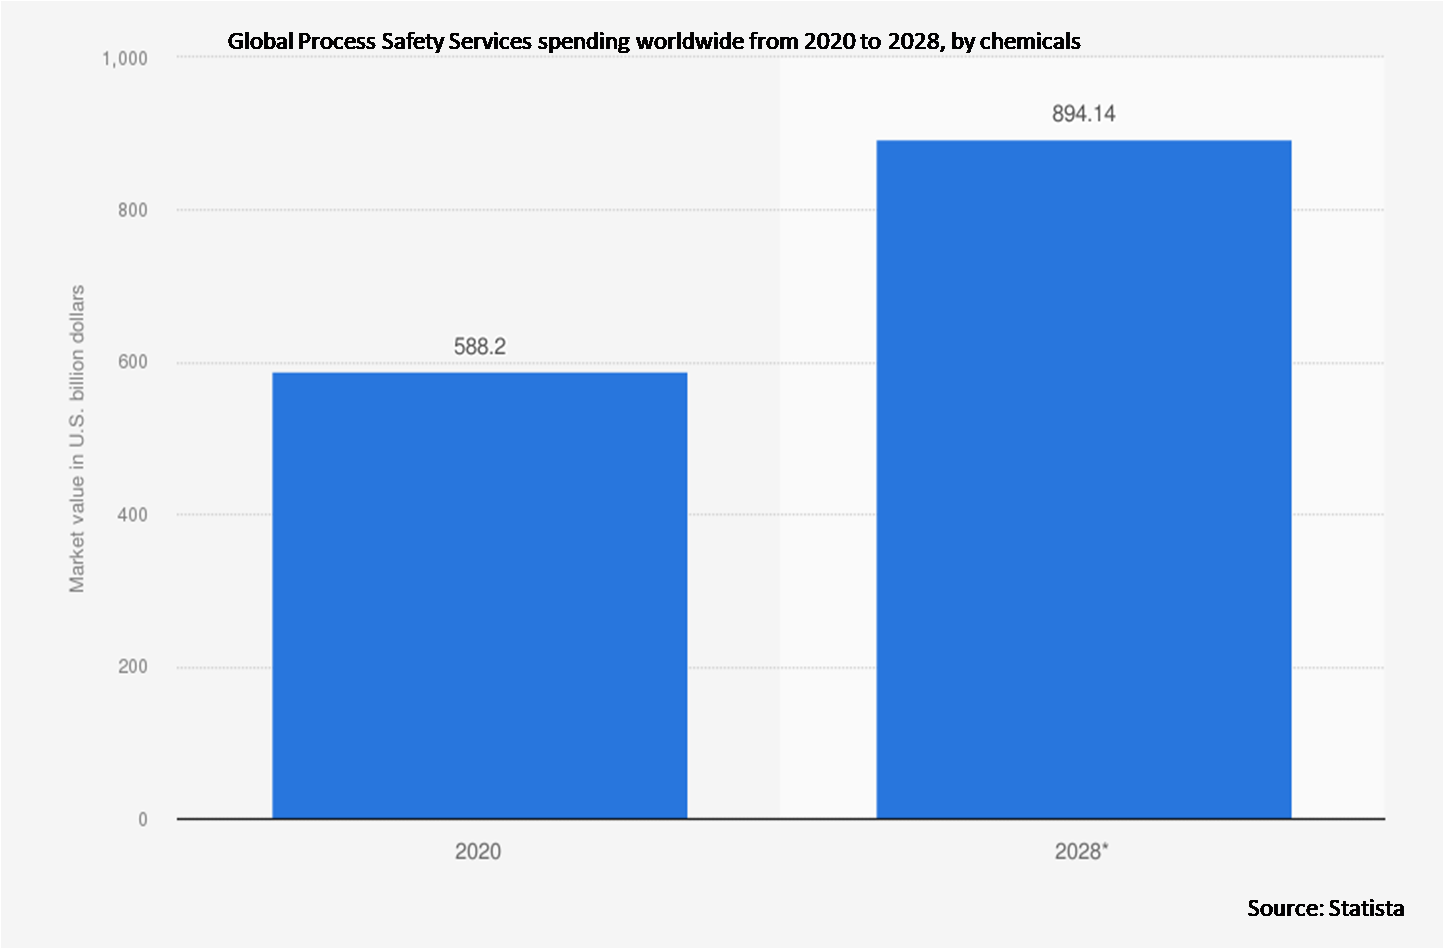
The chemical segment is expected to have the highest CAGR during the forecast period
The chemical segment is anticipated to witness the fastest CAGR growth during the forecast period, due to its well inspection and procedures. Process safety is crucial in chemical industry operations, especially when working with substances that are harmful to infrastructure, the environment, and humans. Chemical companies maintain a clean, well-organized and structured operational environment and procedures for safety reasons. They adhere to regulations for highly hazardous compounds, which are responsible for the market's expansion.
Region with largest share:
Asia Pacific is projected to hold the largest market share during the forecast period owing to the increasing adoption of new technologies by emerging economies. The necessity to improve factory management and production efficiency is forcing manufacturers in this region to adopt new technologies. The adoption of dust hazard analysis (DHA) solutions in the region is driving the growth of the market.
Region with highest CAGR:
Asia Pacific is projected to have the highest CAGR over the forecast period, owing to the presence of numerous organizations. Due to cheap labor costs and a rapidly expanding population, replacement workers are readily accessible in this region in the event of an accident or injury. In addition, tragic events in this region like the Fukushima earthquake and the Bhopal gas catastrophe have sparked worries about process dangers. These factors are promoting market expansion in this area.

Key players in the market
Some of the key players profiled in the Process Safety Services Market include ABB, Honeywell International Inc, Rockwell Automation, Intertek Group plc, RRC International, SOCOTEC, SGS SA, DEKRA India Pvt Ltd, HIMA, Smith & Burgess Process Safety Consulting, Process Engineering Associates, Bureau Veritas, Emerson Electric Co, Hexagon AB, Ingenero Inc, Siemens, Schneider Electronic, Yokogawa Electric, Corporation C&W Business and BIOS Middle East Group.
Key Developments:
In March 2023, Otsuka Chemical Co., Ltd. and Yokogawa Electric Corporation announced the establishment of SynCrest Inc., a joint venture that will engage in research, development, and manufacturing in the promising field of middle-molecular pharmaceuticals as a Contract Research, Development and Manufacturing Organization (CRDMO).
In February 2023, Schneider Electric, a global player in energy management, is expanding its India operations with launch of new product lines in one of its manufacturing facilities in Bangalore, to support the growing demand for energy management solutions.
In November 2022, Honeywell announced the release of its new operational technology (OT) cybersecurity solutions, designed to assist customers in defending the availability, reliability and safety of their industrial control systems and operations.
Services Covered:
• Consulting
• Training
• Certification
• Auditing
Solutions Covered:
• Compliance Management
• Process Hazard Analysis (PHA)
• Safety Instrumented Systems (SIS)
• Dust Hazard Analysis (DHA)
• Risk Management Programs (RMP)
• Facility Siting
• Incident Investigation & Response
• Mechanical Integrity
• PSM Program Implementation
• Other Solutions
Applications Covered:
• Burner Management System
• Emergency Shutdown
• High Integrity Pressure Protection System
• Turbo Machinery Control
End Users Covered:
• Pharmaceutical
• Chemicals
• Energy & Power
• Oil & Gas
• Food & Beverages
• Paper & Pulp
• Paint & Coating
• Water & Waste Water Management
• Automotive
• Construction
• Government
• Aviation & Defense
• Metals
• Mining
• Personal Care
• Electricity
• Other End Users
Regions Covered:
• North America
o US
o Canada
o Mexico
• Europe
o Germany
o UK
o Italy
o France
o Spain
o Rest of Europe
• Asia Pacific
o Japan
o China
o India
o Australia
o New Zealand
o South Korea
o Rest of Asia Pacific
• South America
o Argentina
o Brazil
o Chile
o Rest of South America
• Middle East & Africa
o Saudi Arabia
o UAE
o Qatar
o South Africa
o Rest of Middle East & Africa
What our report offers:
- Market share assessments for the regional and country-level segments
- Strategic recommendations for the new entrants
- Covers Market data for the years 2020, 2021, 2022, 2025, and 2028
- Market Trends (Drivers, Constraints, Opportunities, Threats, Challenges, Investment Opportunities, and recommendations)
- Strategic recommendations in key business segments based on the market estimations
- Competitive landscaping mapping the key common trends
- Company profiling with detailed strategies, financials, and recent developments
- Supply chain trends mapping the latest technological advancements
Free Customization Offerings:
All the customers of this report will be entitled to receive one of the following free customization options:
• Company Profiling
o Comprehensive profiling of additional market players (up to 3)
o SWOT Analysis of key players (up to 3)
• Regional Segmentation
o Market estimations, Forecasts and CAGR of any prominent country as per the client's interest (Note: Depends on feasibility check)
• Competitive Benchmarking
o Benchmarking of key players based on product portfolio, geographical presence, and strategic alliances
Table of Contents
1 Executive Summary
2 Preface
2.1 Abstract
2.2 Stake Holders
2.3 Research Scope
2.4 Research Methodology
2.4.1 Data Mining
2.4.2 Data Analysis
2.4.3 Data Validation
2.4.4 Research Approach
2.5 Research Sources
2.5.1 Primary Research Sources
2.5.2 Secondary Research Sources
2.5.3 Assumptions
3 Market Trend Analysis
3.1 Introduction
3.2 Drivers
3.3 Restraints
3.4 Opportunities
3.5 Threats
3.6 Application Analysis
3.7 End User Analysis
3.8 Emerging Markets
3.9 Impact of Covid-19
4 Porters Five Force Analysis
4.1 Bargaining power of suppliers
4.2 Bargaining power of buyers
4.3 Threat of substitutes
4.4 Threat of new entrants
4.5 Competitive rivalry
5 Global Process Safety Services Market, By Service
5.1 Introduction
5.2 Consulting
5.3 Training
5.4 Certification
5.5 Auditing
6 Global Process Safety Services Market, By Solution
6.1 Introduction
6.2 Compliance Management
6.3 Process Hazard Analysis (PHA)
6.4 Safety Instrumented Systems (SIS)
6.5 Dust Hazard Analysis (DHA)
6.6 Risk Management Programs (RMP)
6.7 Facility Siting
6.8 Incident Investigation & Response
6.9 Mechanical Integrity
6.10 PSM Program Implementation
6.11 Other Solutions
7 Global Process Safety Services Market, By Application
7.1 Introduction
7.2 Burner Management System
7.3 Emergency Shutdown
7.4 High Integrity Pressure Protection System
7.5 Turbo Machinery Control
8 Global Process Safety Services Market, By End User
8.1 Introduction
8.2 Pharmaceutical
8.3 Chemicals
8.4 Energy & Power
8.5 Oil & Gas
8.6 Food & Beverages
8.7 Paper & Pulp
8.8 Paint & Coating
8.9 Water & Waste Water Management
8.10 Automotive
8.11 Construction
8.12 Government
8.13 Aviation & Defense
8.14 Metals
8.15 Mining
8.16 Personal Care
8.17 Electricity
8.18 Other End Users
9 Global Process Safety Services Market, By Geography
9.1 Introduction
9.2 North America
9.2.1 US
9.2.2 Canada
9.2.3 Mexico
9.3 Europe
9.3.1 Germany
9.3.2 UK
9.3.3 Italy
9.3.4 France
9.3.5 Spain
9.3.6 Rest of Europe
9.4 Asia Pacific
9.4.1 Japan
9.4.2 China
9.4.3 India
9.4.4 Australia
9.4.5 New Zealand
9.4.6 South Korea
9.4.7 Rest of Asia Pacific
9.5 South America
9.5.1 Argentina
9.5.2 Brazil
9.5.3 Chile
9.5.4 Rest of South America
9.6 Middle East & Africa
9.6.1 Saudi Arabia
9.6.2 UAE
9.6.3 Qatar
9.6.4 South Africa
9.6.5 Rest of Middle East & Africa
10 Key Developments
10.1 Agreements, Partnerships, Collaborations and Joint Ventures
10.2 Acquisitions & Mergers
10.3 New Product Launch
10.4 Expansions
10.5 Other Key Strategies
11 Company Profiling
11.1 ABB
11.2 Honeywell International Inc
11.3 Rockwell Automation
11.4 Intertek Group plc
11.5 RRC International
11.6 SOCOTEC
11.7 SGS SA
11.8 DEKRA India Pvt Ltd
11.9 HIMA
11.10 Smith & Burgess Process Safety Consulting
11.11 Process Engineering Associates
11.12 Bureau Veritas
11.11 Emerson Electric Co
11.14 Hexagon AB
11.15 Ingenero Inc
11.16 Siemens
11.17 Schneider Electronic
11.18 Yokogawa Electric
11.19 Corporation C&W Business
11.20 BIOS Middle East Group
List of Tables
1 Global Process Safety Services Market Outlook, By Region (2020-2028) ($MN)
2 Global Process Safety Services Market Outlook, By Service (2020-2028) ($MN)
3 Global Process Safety Services Market Outlook, By Consulting (2020-2028) ($MN)
4 Global Process Safety Services Market Outlook, By Training (2020-2028) ($MN)
5 Global Process Safety Services Market Outlook, By Certification (2020-2028) ($MN)
6 Global Process Safety Services Market Outlook, By Auditing (2020-2028) ($MN)
7 Global Process Safety Services Market Outlook, By Solution (2020-2028) ($MN)
8 Global Process Safety Services Market Outlook, By Compliance Management (2020-2028) ($MN)
9 Global Process Safety Services Market Outlook, By Process Hazard Analysis (PHA) (2020-2028) ($MN)
10 Global Process Safety Services Market Outlook, By Safety Instrumented Systems (SIS) (2020-2028) ($MN)
11 Global Process Safety Services Market Outlook, By Dust Hazard Analysis (DHA) (2020-2028) ($MN)
12 Global Process Safety Services Market Outlook, By Risk Management Programs (RMP) (2020-2028) ($MN)
13 Global Process Safety Services Market Outlook, By Facility Siting (2020-2028) ($MN)
14 Global Process Safety Services Market Outlook, By Incident Investigation & Response (2020-2028) ($MN)
15 Global Process Safety Services Market Outlook, By Mechanical Integrity (2020-2028) ($MN)
16 Global Process Safety Services Market Outlook, By PSM Program Implementation (2020-2028) ($MN)
17 Global Process Safety Services Market Outlook, By Other Solutions (2020-2028) ($MN)
18 Global Process Safety Services Market Outlook, By Application (2020-2028) ($MN)
19 Global Process Safety Services Market Outlook, By Burner Management System (2020-2028) ($MN)
20 Global Process Safety Services Market Outlook, By Emergency Shutdown (2020-2028) ($MN)
21 Global Process Safety Services Market Outlook, By High Integrity Pressure Protection System (2020-2028) ($MN)
22 Global Process Safety Services Market Outlook, By Turbo Machinery Control (2020-2028) ($MN)
23 Global Process Safety Services Market Outlook, By End User (2020-2028) ($MN)
24 Global Process Safety Services Market Outlook, By Pharmaceutical (2020-2028) ($MN)
25 Global Process Safety Services Market Outlook, By Chemicals (2020-2028) ($MN)
26 Global Process Safety Services Market Outlook, By Energy & Power (2020-2028) ($MN)
27 Global Process Safety Services Market Outlook, By Oil & Gas (2020-2028) ($MN)
28 Global Process Safety Services Market Outlook, By Food & Beverages (2020-2028) ($MN)
29 Global Process Safety Services Market Outlook, By Paper & Pulp (2020-2028) ($MN)
30 Global Process Safety Services Market Outlook, By Paint & Coating (2020-2028) ($MN)
31 Global Process Safety Services Market Outlook, By Water & Waste Water Management (2020-2028) ($MN)
32 Global Process Safety Services Market Outlook, By Automotive (2020-2028) ($MN)
33 Global Process Safety Services Market Outlook, By Construction (2020-2028) ($MN)
34 Global Process Safety Services Market Outlook, By Government (2020-2028) ($MN)
35 Global Process Safety Services Market Outlook, By Aviation & Defense (2020-2028) ($MN)
36 Global Process Safety Services Market Outlook, By Metals (2020-2028) ($MN)
37 Global Process Safety Services Market Outlook, By Mining (2020-2028) ($MN)
38 Global Process Safety Services Market Outlook, By Personal Care (2020-2028) ($MN)
39 Global Process Safety Services Market Outlook, By Electricity (2020-2028) ($MN)
40 Global Process Safety Services Market Outlook, By Other End Users (2020-2028) ($MN)
Note: Tables for North America, Europe, APAC, South America, and Middle East & Africa Regions are also represented in the same manner as above.
List of Figures
RESEARCH METHODOLOGY

We at ‘Stratistics’ opt for an extensive research approach which involves data mining, data validation, and data analysis. The various research sources include in-house repository, secondary research, competitor’s sources, social media research, client internal data, and primary research.
Our team of analysts prefers the most reliable and authenticated data sources in order to perform the comprehensive literature search. With access to most of the authenticated data bases our team highly considers the best mix of information through various sources to obtain extensive and accurate analysis.
Each report takes an average time of a month and a team of 4 industry analysts. The time may vary depending on the scope and data availability of the desired market report. The various parameters used in the market assessment are standardized in order to enhance the data accuracy.
Data Mining
The data is collected from several authenticated, reliable, paid and unpaid sources and is filtered depending on the scope & objective of the research. Our reports repository acts as an added advantage in this procedure. Data gathering from the raw material suppliers, distributors and the manufacturers is performed on a regular basis, this helps in the comprehensive understanding of the products value chain. Apart from the above mentioned sources the data is also collected from the industry consultants to ensure the objective of the study is in the right direction.
Market trends such as technological advancements, regulatory affairs, market dynamics (Drivers, Restraints, Opportunities and Challenges) are obtained from scientific journals, market related national & international associations and organizations.
Data Analysis
From the data that is collected depending on the scope & objective of the research the data is subjected for the analysis. The critical steps that we follow for the data analysis include:
- Product Lifecycle Analysis
- Competitor analysis
- Risk analysis
- Porters Analysis
- PESTEL Analysis
- SWOT Analysis
The data engineering is performed by the core industry experts considering both the Marketing Mix Modeling and the Demand Forecasting. The marketing mix modeling makes use of multiple-regression techniques to predict the optimal mix of marketing variables. Regression factor is based on a number of variables and how they relate to an outcome such as sales or profits.
Data Validation
The data validation is performed by the exhaustive primary research from the expert interviews. This includes telephonic interviews, focus groups, face to face interviews, and questionnaires to validate our research from all aspects. The industry experts we approach come from the leading firms, involved in the supply chain ranging from the suppliers, distributors to the manufacturers and consumers so as to ensure an unbiased analysis.
We are in touch with more than 15,000 industry experts with the right mix of consultants, CEO's, presidents, vice presidents, managers, experts from both supply side and demand side, executives and so on.
The data validation involves the primary research from the industry experts belonging to:
- Leading Companies
- Suppliers & Distributors
- Manufacturers
- Consumers
- Industry/Strategic Consultants
Apart from the data validation the primary research also helps in performing the fill gap research, i.e. providing solutions for the unmet needs of the research which helps in enhancing the reports quality.
For more details about research methodology, kindly write to us at info@strategymrc.com
Frequently Asked Questions
In case of any queries regarding this report, you can contact the customer service by filing the “Inquiry Before Buy” form available on the right hand side. You may also contact us through email: info@strategymrc.com or phone: +1-301-202-5929
Yes, the samples are available for all the published reports. You can request them by filling the “Request Sample” option available in this page.
Yes, you can request a sample with your specific requirements. All the customized samples will be provided as per the requirement with the real data masked.
All our reports are available in Digital PDF format. In case if you require them in any other formats, such as PPT, Excel etc you can submit a request through “Inquiry Before Buy” form available on the right hand side. You may also contact us through email: info@strategymrc.com or phone: +1-301-202-5929
We offer a free 15% customization with every purchase. This requirement can be fulfilled for both pre and post sale. You may send your customization requirements through email at info@strategymrc.com or call us on +1-301-202-5929.
We have 3 different licensing options available in electronic format.
- Single User Licence: Allows one person, typically the buyer, to have access to the ordered product. The ordered product cannot be distributed to anyone else.
- 2-5 User Licence: Allows the ordered product to be shared among a maximum of 5 people within your organisation.
- Corporate License: Allows the product to be shared among all employees of your organisation regardless of their geographical location.
All our reports are typically be emailed to you as an attachment.
To order any available report you need to register on our website. The payment can be made either through CCAvenue or PayPal payments gateways which accept all international cards.
We extend our support to 6 months post sale. A post sale customization is also provided to cover your unmet needs in the report.
Request Customization
We offer complimentary customization of up to 15% with every purchase. To share your customization requirements, feel free to email us at info@strategymrc.com or call us on +1-301-202-5929. .
Please Note: Customization within the 15% threshold is entirely free of charge. If your request exceeds this limit, we will conduct a feasibility assessment. Following that, a detailed quote and timeline will be provided.
WHY CHOOSE US ?

Assured Quality
Best in class reports with high standard of research integrity

24X7 Research Support
Continuous support to ensure the best customer experience.

Free Customization
Adding more values to your product of interest.

Safe & Secure Access
Providing a secured environment for all online transactions.

Trusted by 600+ Brands
Serving the most reputed brands across the world.