
Profilometer Market
Profilometer Market Forecasts to 2030 - Global Analysis By Type (Contact Profilometer, Non-contact Profilometer and Other Types), Method (Optical Method, Contact or Pseudo Contact Method and Other Methods), Dimension, Application and by Geography

|
Years Covered |
2021-2030 |
|
Estimated Year Value (2023) |
US $483.42 MN |
|
Projected Year Value (2030) |
US $736.54 MN |
|
CAGR (2023 - 2030) |
6.2% |
|
Regions Covered |
North America, Europe, Asia Pacific, South America, and Middle East & Africa |
|
Countries Covered |
US, Canada, Mexico, Germany, UK, Italy, France, Spain, Japan, China, India, Australia, New Zealand, South Korea, Rest of Asia Pacific, South America, Argentina, Brazil, Chile, Middle East & Africa, Saudi Arabia, UAE, Qatar, and South Africa |
|
Largest Market |
Asia Pacific |
|
Highest Growing Market |
North America |
According to Stratistics MRC, the Global Profilometer Market is accounted for $483.42 million in 2023 and is expected to reach $736.54 million by 2030 growing at a CAGR of 6.2% during the forecast period. A profilometer is a high-precision tool for measuring an object's surface topography. In order to generate a comprehensive profile, it operates by moving a probe across the surface and identifying height variations. Surface roughness, waviness, and other surface characteristics that is important for quality assurance and research in a variety of industries, including manufacturing, engineering, and materials science.
According to the International Organization for Standardization (ISO), profilometers are essential instruments for evaluating the surface texture of materials, providing critical data for quality control and ensuring compliance with industry standards.
Market Dynamics:
Driver:
Demand for high-precision measurement instruments
The market for profilometers is largely driven by the growing need for high-precision measurement instruments in sectors like semiconductor manufacturing, aerospace, and automotive. In these industries, even small variations in surface roughness or texture can cause component malfunctions or functional flaws. By providing accurate and thorough surface measurements, profilometers help manufacturers guarantee the functionality and quality of their goods. Additionally, the need for sophisticated profilometers keeps rising as industries aim for increased dependability and efficiency.
Restraint:
Expense of purchase and upkeep
The high cost of purchasing and maintaining these precise instruments is one of the major obstacles facing the profilometer market. A significant initial investment is frequently needed for profilometers, especially for more advanced models with complex features and functionalities. The total cost of ownership may also be increased by recurring costs for calibration, upkeep, and repair. Furthermore, the upfront and ongoing expenses associated with profilometers may prevent smaller companies or organizations with tighter budgets from adopting them, which would limit market expansion.
Opportunity:
Utilizing industry 4.0 technologies in integration
The integration of smart manufacturing technologies and the ongoing transition to Industry 4.0 offer opportunities for manufacturers of profilometers to introduce innovative concepts and differentiate themselves from competitors. Manufacturers can provide advanced features like real-time monitoring, predictive maintenance, and automated data analysis by integrating profilometers with Internet of Things (IoT) connectivity, cloud-based analytics, and artificial intelligence (AI) algorithms. Moreover, these features raise the value proposition of profilometers and create new opportunities for market growth by enabling proactive quality control, streamlining production procedures, and improving overall operational efficiency.
Threat:
Market saturation and vigorous rivalry
The market for profilometers is vulnerable to market saturation and fierce competition, especially from well-established companies and recent entrants who may offer comparable goods or substitute surface measurement technologies. Manufacturers may face downward pressure on prices and margins as the market gets more crowded, making it difficult to maintain profitability. Furthermore, fierce competition may cause profilometers to become commodities, leaving little room for feature- or performance-based differentiation. This would increase price competition and reduce market share.
Covid-19 Impact:
The market for profilometers has been impacted by the COVID-19 pandemic in varying ways. At first, there were disturbances in the market because of extensive lockdowns, disruptions in the supply chain, and a decline in manufacturing across different sectors. A brief halt in market expansion resulted from difficulties faced by several profilometer manufacturers, including delayed production, decreased demand, and logistical limitations. However, the need for profilometers increased in industries that prioritized quality control and surface inspection, such as healthcare, pharmaceuticals, and electronics, as these industries adapted to remote working and implemented strict hygiene and safety measures.
The Non-contact Profilometer segment is expected to be the largest during the forecast period
The non-contact profilometer segment has the largest market share in the profilometer industry. Non-contact profilometers offer benefits like faster measurement speeds, improved accuracy, and compatibility with soft or delicate materials. They measure surface characteristics without requiring physical contact with the sample through the use of optical, laser-based, or other remote sensing technologies. Furthermore, these tools are widely used in sectors where accurate surface measurement is essential for quality assurance, process optimization, and research, such as semiconductor manufacturing, automotive, and aerospace.
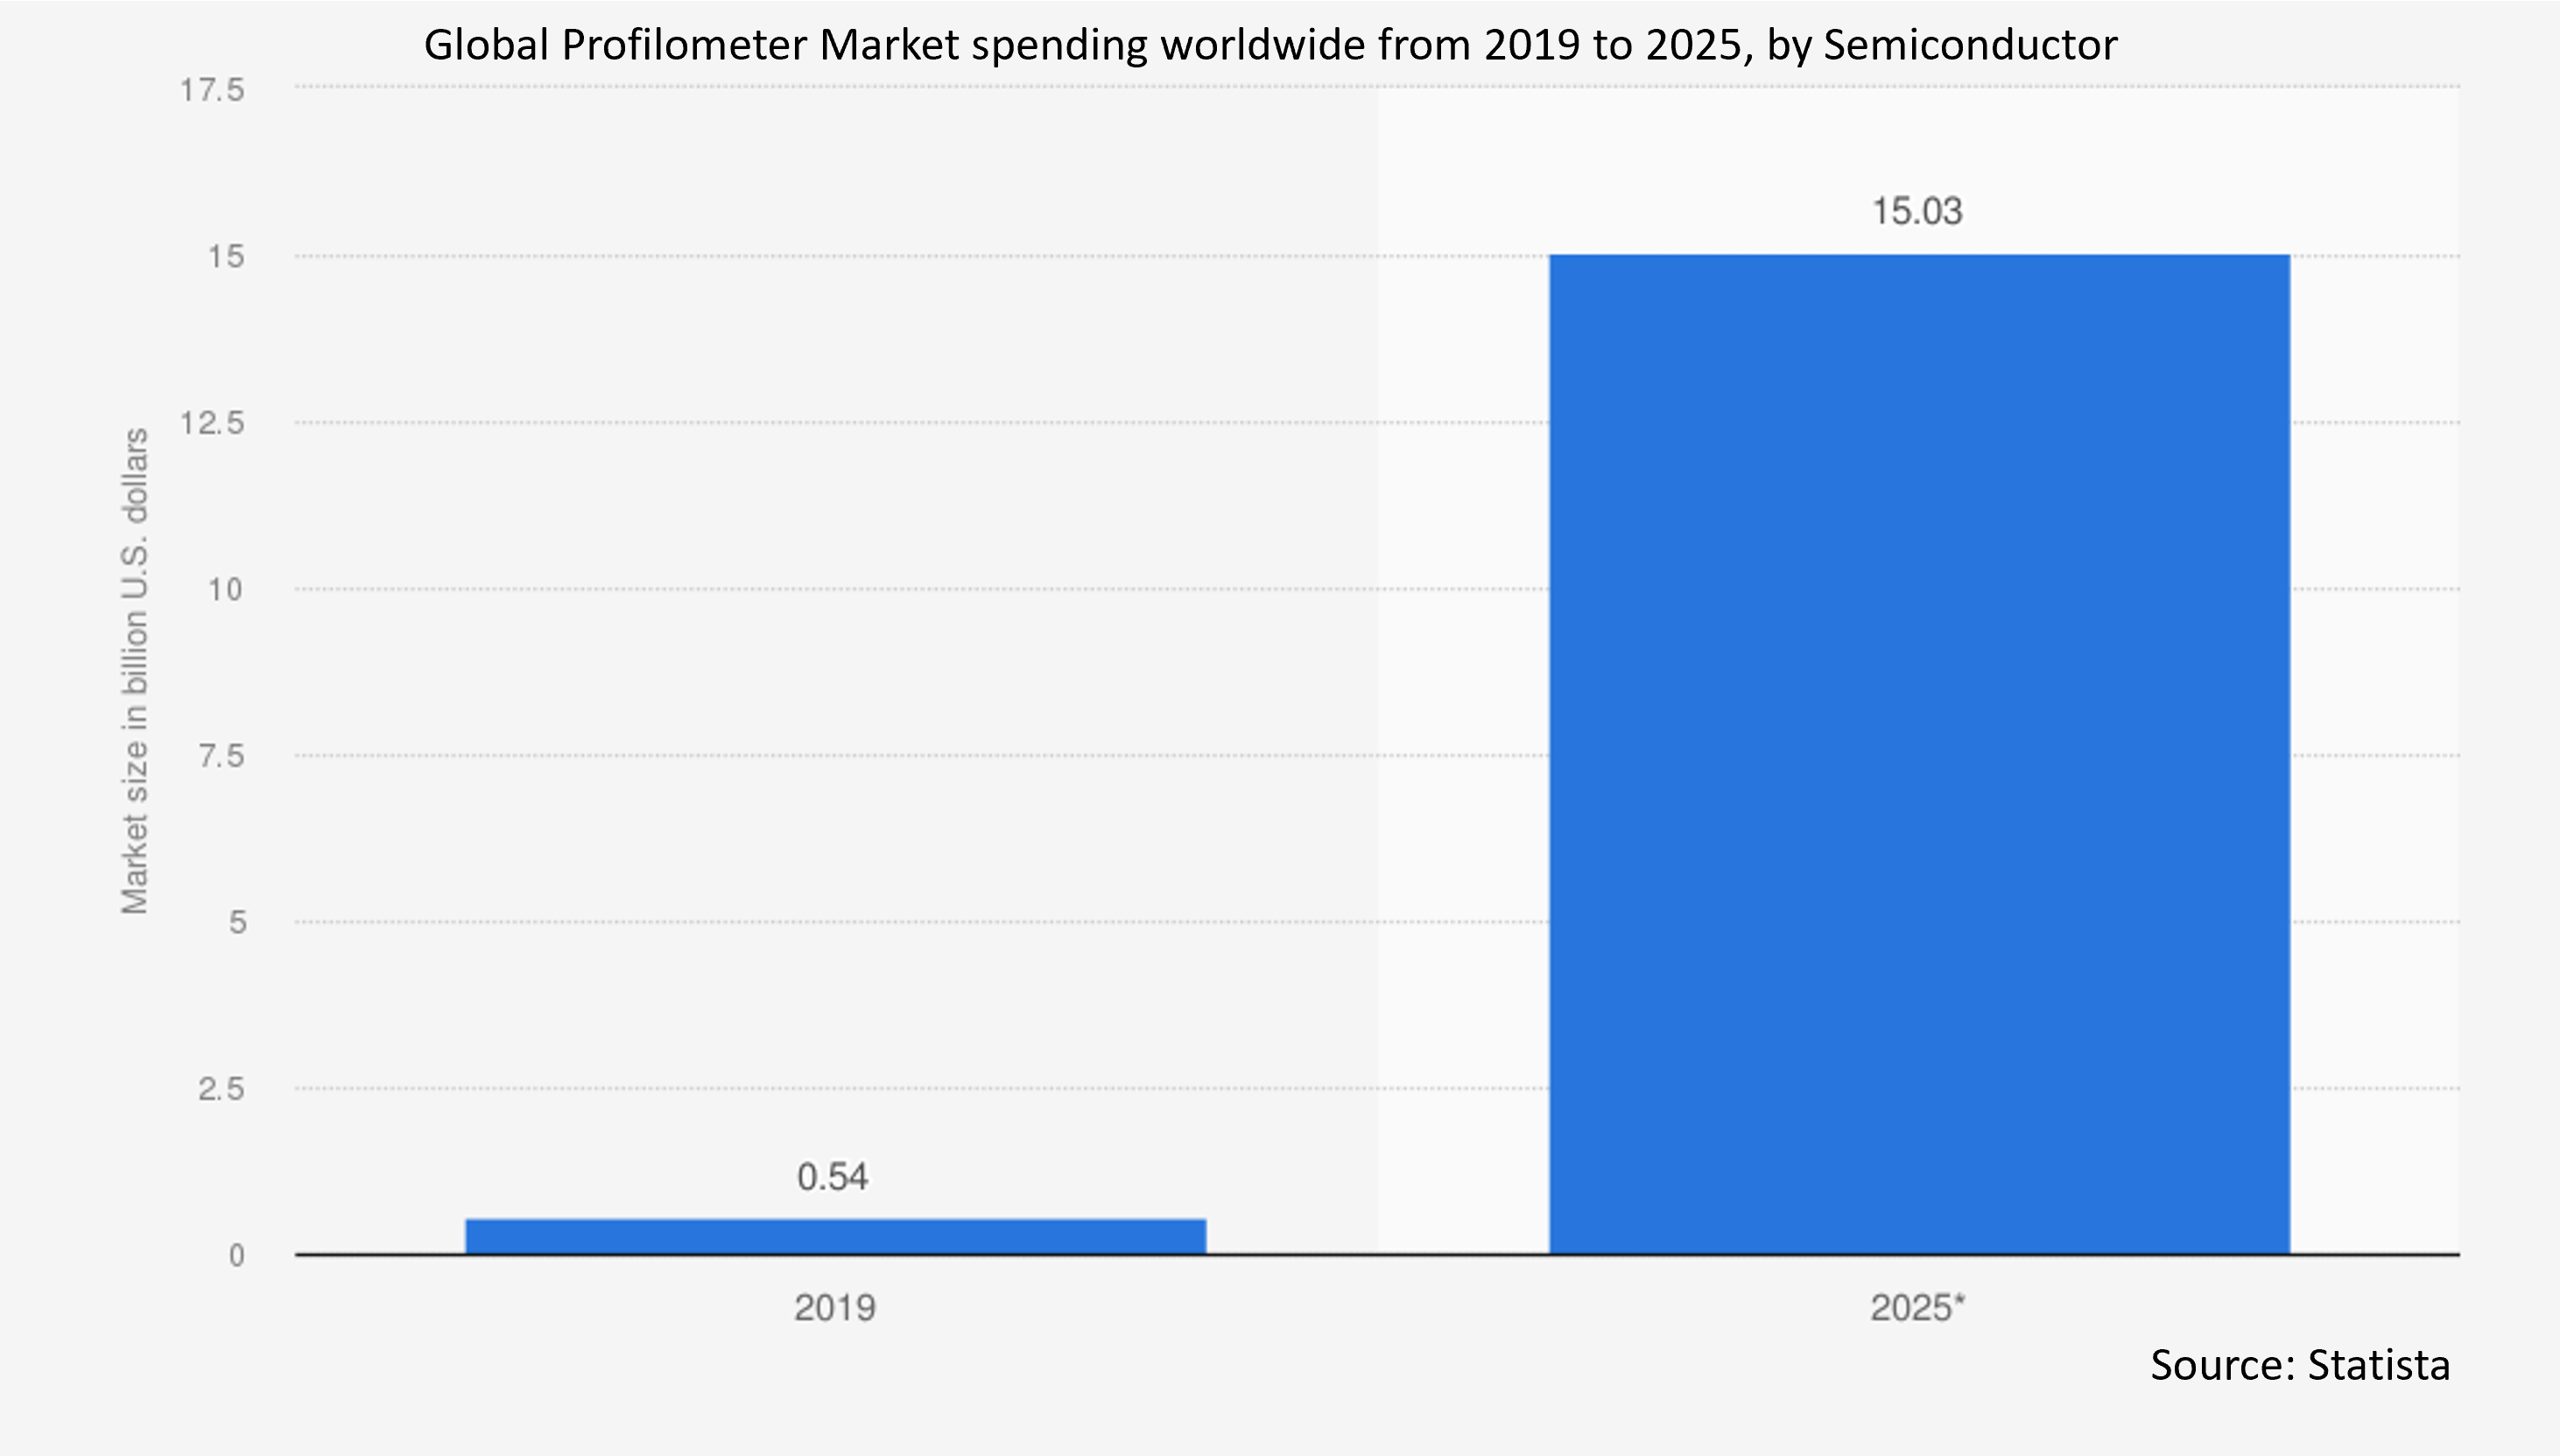
The Semiconductor segment is expected to have the highest CAGR during the forecast period
The semiconductor segment is anticipated to grow at the highest CAGR. The semiconductor industry is experiencing a growing need for high-precision measurement tools such as profilometers due to its ongoing evolution towards smaller feature sizes, tighter tolerances, and increased complexity in integrated circuit manufacturing. Moreover, these tools are essential to the fabrication of semiconductors because they allow producers to precisely evaluate surface quality, keep an eye on device dimensions, and guarantee that design specifications are followed.
Region with largest share:
In the profilometer market, the Asia-Pacific region has the largest share. The region's thriving manufacturing sector is mostly responsible for this dominance; countries like China, Japan, South Korea, and Taiwan, which make significant contributions to sectors like semiconductor, electronics, and automotive manufacturing, are especially noteworthy. The market for profilometers in Asia-Pacific has grown as a result of the growing use of these instruments in these sectors for research, process optimization, and quality control, as well as continuous investments in industrial automation and technological developments. Additionally, the growing healthcare, aerospace, and research industries in the area also fuel demand for profilometers, which in turn propels market expansion.
Region with highest CAGR:
North America is anticipated to have the highest CAGR. The region's robust presence in sectors like semiconductor manufacturing, automotive, aerospace, and healthcare—all of which significantly rely on accurate surface measurement instruments for research and quality control—is one of the main drivers of this growth. High-precision profilometers are becoming more and more in demand in North America due to the growing use of advanced manufacturing technologies like additive manufacturing, 3D printing, and nanotechnology. Furthermore, market expansion is also aided by the region's emphasis on technological innovation, strong R&D infrastructure, and benevolent regulatory framework.

Key players in the market
Some of the key players in Profilometer market include Mitutoyo America Corporation, KLA Corporation, Bruker Corporation, L.S. Starrett Company, Solarius, Inc., Tokyo Seimitsu Co., Ltd, Jenoptik Group, Alicona Imaging GmbH, Schaefer Technology GmbH, Zygo Corporation, Taylor Hobson, Sensofar Group, AMETEK, Inc., Teraspyora-Steelwheel Oy and Mahr Inc.
Key Developments:
In March 2024, Solaris Resources Inc. is pleased to announce a trilateral cooperation agreement with the Interprovincial Federation of Shuar Centers and the Alliance for Entrepreneurship and Innovation of Ecuador, with the signing ceremony to take place over PDAC. The agreement aims to promote the economic and social development of Shuar communities represented by FICSH, including the communities of Warints and Yawi which host the Warintza Project on their lands, with programs in health, education, skills training, entrepreneurship, innovation and sustainable mineral resource development.
In March 2024, The L.S. Starrett Company entered into a definitive merger agreement in a go-private transaction with an affiliate of MiddleGround Capital in an all-cash transaction for $16.19 per share. The purchase price represents an approximately 63% premium to the closing stock price of the Company’s stock, the last trading day prior to announcing the transaction.
In February 2024, Life sciences and diagnostics company Bruker has agreed to acquire ELITechGroup, a provider of in-vitro diagnostic (IVD) systems, in a €870m ($942m) cash deal. ELITechGroup will be acquired from TecFin, a controlled affiliate of pre-eminent private equity company PAI Partners. However, the transaction excludes ELITech’s clinical chemistry business, which is being carved out.
Types Covered:
• Contact Profilometer
• Non-contact Profilometer
• Other Types
Methods Covered:
• Optical Method
• Contact or Pseudo Contact Method
• Other Methods
Dimensions Covered:
• 2D- dimension
• 3D- dimension
Applications Covered:
• Semiconductor
• Mechanical
• Automotive
• Other Applications
Regions Covered:
• North America
o US
o Canada
o Mexico
• Europe
o Germany
o UK
o Italy
o France
o Spain
o Rest of Europe
• Asia Pacific
o Japan
o China
o India
o Australia
o New Zealand
o South Korea
o Rest of Asia Pacific
• South America
o Argentina
o Brazil
o Chile
o Rest of South America
• Middle East & Africa
o Saudi Arabia
o UAE
o Qatar
o South Africa
o Rest of Middle East & Africa
What our report offers:
- Market share assessments for the regional and country-level segments
- Strategic recommendations for the new entrants
- Covers Market data for the years 2021, 2022, 2023, 2026, and 2030
- Market Trends (Drivers, Constraints, Opportunities, Threats, Challenges, Investment Opportunities, and recommendations)
- Strategic recommendations in key business segments based on the market estimations
- Competitive landscaping mapping the key common trends
- Company profiling with detailed strategies, financials, and recent developments
- Supply chain trends mapping the latest technological advancements
Free Customization Offerings:
All the customers of this report will be entitled to receive one of the following free customization options:
• Company Profiling
o Comprehensive profiling of additional market players (up to 3)
o SWOT Analysis of key players (up to 3)
• Regional Segmentation
o Market estimations, Forecasts and CAGR of any prominent country as per the client's interest (Note: Depends on feasibility check)
• Competitive Benchmarking
Benchmarking of key players based on product portfolio, geographical presence, and strategic alliances
Table of Contents
1 Executive Summary
2 Preface
2.1 Abstract
2.2 Stake Holders
2.3 Research Scope
2.4 Research Methodology
2.4.1 Data Mining
2.4.2 Data Analysis
2.4.3 Data Validation
2.4.4 Research Approach
2.5 Research Sources
2.5.1 Primary Research Sources
2.5.2 Secondary Research Sources
2.5.3 Assumptions
3 Market Trend Analysis
3.1 Introduction
3.2 Drivers
3.3 Restraints
3.4 Opportunities
3.5 Threats
3.6 Application Analysis
3.7 Emerging Markets
3.8 Impact of Covid-19
4 Porters Five Force Analysis
4.1 Bargaining power of suppliers
4.2 Bargaining power of buyers
4.3 Threat of substitutes
4.4 Threat of new entrants
4.5 Competitive rivalry
5 Global Profilometer Market, By Type
5.1 Introduction
5.2 Contact Profilometer
5.3 Non-contact Profilometer
5.3.1 Time-resolved Profilometer
5.3.2 Fiber-based Optical Profilometer
5.4 Other Types
6 Global Profilometer Market, By Method
6.1 Introduction
6.2 Optical Method
6.2.1 Interferometry Based Method
6.2.2 Focus Detection Method
6.2.3 Pattern Projection Method
6.3 Contact or Pseudo Contact Method
6.3.1 Stylus Profilometer
6.3.2 Atomic Force Microscopy
6.3.3 Scanning Tunneling Microscopy
6.4 Other Methods
7 Global Profilometer Market, By Dimension
7.1 Introduction
7.2 2D- dimension
7.3 3D- dimension
8 Global Profilometer Market, By Application
8.1 Introduction
8.2 Semiconductor
8.3 Mechanical
8.4 Automotive
8.5 Other Applications
9 Global Profilometer Market, By Geography
9.1 Introduction
9.2 North America
9.2.1 US
9.2.2 Canada
9.2.3 Mexico
9.3 Europe
9.3.1 Germany
9.3.2 UK
9.3.3 Italy
9.3.4 France
9.3.5 Spain
9.3.6 Rest of Europe
9.4 Asia Pacific
9.4.1 Japan
9.4.2 China
9.4.3 India
9.4.4 Australia
9.4.5 New Zealand
9.4.6 South Korea
9.4.7 Rest of Asia Pacific
9.5 South America
9.5.1 Argentina
9.5.2 Brazil
9.5.3 Chile
9.5.4 Rest of South America
9.6 Middle East & Africa
9.6.1 Saudi Arabia
9.6.2 UAE
9.6.3 Qatar
9.6.4 South Africa
9.6.5 Rest of Middle East & Africa
10 Key Developments
10.1 Agreements, Partnerships, Collaborations and Joint Ventures
10.2 Acquisitions & Mergers
10.3 New Product Launch
10.4 Expansions
10.5 Other Key Strategies
11 Company Profiling
11.1 Mitutoyo America Corporation
11.2 KLA Corporation
11.3 Bruker Corporation
11.4 L.S. Starrett Company
11.5 Solarius, Inc.
11.6 Tokyo Seimitsu Co., Ltd
11.7 Jenoptik Group
11.8 Alicona Imaging GmbH
11.9 Schaefer Technology GmbH
11.10 Zygo Corporation
11.11 Taylor Hobson
11.12 Sensofar Group
11.13 AMETEK, Inc.
11.14 Teraspyora-Steelwheel Oy
11.15 Mahr Inc.
List of Tables
1 Global Profilometer Market Outlook, By Region (2021-2030) ($MN)
2 Global Profilometer Market Outlook, By Type (2021-2030) ($MN)
3 Global Profilometer Market Outlook, By Contact Profilometer (2021-2030) ($MN)
4 Global Profilometer Market Outlook, By Non-contact Profilometer (2021-2030) ($MN)
5 Global Profilometer Market Outlook, By Time-resolved Profilometer (2021-2030) ($MN)
6 Global Profilometer Market Outlook, By Fiber-based Optical Profilometer (2021-2030) ($MN)
7 Global Profilometer Market Outlook, By Other Types (2021-2030) ($MN)
8 Global Profilometer Market Outlook, By Method (2021-2030) ($MN)
9 Global Profilometer Market Outlook, By Optical Method (2021-2030) ($MN)
10 Global Profilometer Market Outlook, By Interferometry Based Method (2021-2030) ($MN)
11 Global Profilometer Market Outlook, By Focus Detection Method (2021-2030) ($MN)
12 Global Profilometer Market Outlook, By Pattern Projection Method (2021-2030) ($MN)
13 Global Profilometer Market Outlook, By Contact or Pseudo Contact Method (2021-2030) ($MN)
14 Global Profilometer Market Outlook, By Stylus Profilometer (2021-2030) ($MN)
15 Global Profilometer Market Outlook, By Atomic Force Microscopy (2021-2030) ($MN)
16 Global Profilometer Market Outlook, By Scanning Tunneling Microscopy (2021-2030) ($MN)
17 Global Profilometer Market Outlook, By Other Methods (2021-2030) ($MN)
18 Global Profilometer Market Outlook, By Dimension (2021-2030) ($MN)
19 Global Profilometer Market Outlook, By 2D- dimension (2021-2030) ($MN)
20 Global Profilometer Market Outlook, By 3D- dimension (2021-2030) ($MN)
21 Global Profilometer Market Outlook, By Application (2021-2030) ($MN)
22 Global Profilometer Market Outlook, By Semiconductor (2021-2030) ($MN)
23 Global Profilometer Market Outlook, By Mechanical (2021-2030) ($MN)
24 Global Profilometer Market Outlook, By Automotive (2021-2030) ($MN)
25 Global Profilometer Market Outlook, By Other Applications (2021-2030) ($MN)
26 North America Profilometer Market Outlook, By Country (2021-2030) ($MN)
27 North America Profilometer Market Outlook, By Type (2021-2030) ($MN)
28 North America Profilometer Market Outlook, By Contact Profilometer (2021-2030) ($MN)
29 North America Profilometer Market Outlook, By Non-contact Profilometer (2021-2030) ($MN)
30 North America Profilometer Market Outlook, By Time-resolved Profilometer (2021-2030) ($MN)
31 North America Profilometer Market Outlook, By Fiber-based Optical Profilometer (2021-2030) ($MN)
32 North America Profilometer Market Outlook, By Other Types (2021-2030) ($MN)
33 North America Profilometer Market Outlook, By Method (2021-2030) ($MN)
34 North America Profilometer Market Outlook, By Optical Method (2021-2030) ($MN)
35 North America Profilometer Market Outlook, By Interferometry Based Method (2021-2030) ($MN)
36 North America Profilometer Market Outlook, By Focus Detection Method (2021-2030) ($MN)
37 North America Profilometer Market Outlook, By Pattern Projection Method (2021-2030) ($MN)
38 North America Profilometer Market Outlook, By Contact or Pseudo Contact Method (2021-2030) ($MN)
39 North America Profilometer Market Outlook, By Stylus Profilometer (2021-2030) ($MN)
40 North America Profilometer Market Outlook, By Atomic Force Microscopy (2021-2030) ($MN)
41 North America Profilometer Market Outlook, By Scanning Tunneling Microscopy (2021-2030) ($MN)
42 North America Profilometer Market Outlook, By Other Methods (2021-2030) ($MN)
43 North America Profilometer Market Outlook, By Dimension (2021-2030) ($MN)
44 North America Profilometer Market Outlook, By 2D- dimension (2021-2030) ($MN)
45 North America Profilometer Market Outlook, By 3D- dimension (2021-2030) ($MN)
46 North America Profilometer Market Outlook, By Application (2021-2030) ($MN)
47 North America Profilometer Market Outlook, By Semiconductor (2021-2030) ($MN)
48 North America Profilometer Market Outlook, By Mechanical (2021-2030) ($MN)
49 North America Profilometer Market Outlook, By Automotive (2021-2030) ($MN)
50 North America Profilometer Market Outlook, By Other Applications (2021-2030) ($MN)
51 Europe Profilometer Market Outlook, By Country (2021-2030) ($MN)
52 Europe Profilometer Market Outlook, By Type (2021-2030) ($MN)
53 Europe Profilometer Market Outlook, By Contact Profilometer (2021-2030) ($MN)
54 Europe Profilometer Market Outlook, By Non-contact Profilometer (2021-2030) ($MN)
55 Europe Profilometer Market Outlook, By Time-resolved Profilometer (2021-2030) ($MN)
56 Europe Profilometer Market Outlook, By Fiber-based Optical Profilometer (2021-2030) ($MN)
57 Europe Profilometer Market Outlook, By Other Types (2021-2030) ($MN)
58 Europe Profilometer Market Outlook, By Method (2021-2030) ($MN)
59 Europe Profilometer Market Outlook, By Optical Method (2021-2030) ($MN)
60 Europe Profilometer Market Outlook, By Interferometry Based Method (2021-2030) ($MN)
61 Europe Profilometer Market Outlook, By Focus Detection Method (2021-2030) ($MN)
62 Europe Profilometer Market Outlook, By Pattern Projection Method (2021-2030) ($MN)
63 Europe Profilometer Market Outlook, By Contact or Pseudo Contact Method (2021-2030) ($MN)
64 Europe Profilometer Market Outlook, By Stylus Profilometer (2021-2030) ($MN)
65 Europe Profilometer Market Outlook, By Atomic Force Microscopy (2021-2030) ($MN)
66 Europe Profilometer Market Outlook, By Scanning Tunneling Microscopy (2021-2030) ($MN)
67 Europe Profilometer Market Outlook, By Other Methods (2021-2030) ($MN)
68 Europe Profilometer Market Outlook, By Dimension (2021-2030) ($MN)
69 Europe Profilometer Market Outlook, By 2D- dimension (2021-2030) ($MN)
70 Europe Profilometer Market Outlook, By 3D- dimension (2021-2030) ($MN)
71 Europe Profilometer Market Outlook, By Application (2021-2030) ($MN)
72 Europe Profilometer Market Outlook, By Semiconductor (2021-2030) ($MN)
73 Europe Profilometer Market Outlook, By Mechanical (2021-2030) ($MN)
74 Europe Profilometer Market Outlook, By Automotive (2021-2030) ($MN)
75 Europe Profilometer Market Outlook, By Other Applications (2021-2030) ($MN)
76 Asia Pacific Profilometer Market Outlook, By Country (2021-2030) ($MN)
77 Asia Pacific Profilometer Market Outlook, By Type (2021-2030) ($MN)
78 Asia Pacific Profilometer Market Outlook, By Contact Profilometer (2021-2030) ($MN)
79 Asia Pacific Profilometer Market Outlook, By Non-contact Profilometer (2021-2030) ($MN)
80 Asia Pacific Profilometer Market Outlook, By Time-resolved Profilometer (2021-2030) ($MN)
81 Asia Pacific Profilometer Market Outlook, By Fiber-based Optical Profilometer (2021-2030) ($MN)
82 Asia Pacific Profilometer Market Outlook, By Other Types (2021-2030) ($MN)
83 Asia Pacific Profilometer Market Outlook, By Method (2021-2030) ($MN)
84 Asia Pacific Profilometer Market Outlook, By Optical Method (2021-2030) ($MN)
85 Asia Pacific Profilometer Market Outlook, By Interferometry Based Method (2021-2030) ($MN)
86 Asia Pacific Profilometer Market Outlook, By Focus Detection Method (2021-2030) ($MN)
87 Asia Pacific Profilometer Market Outlook, By Pattern Projection Method (2021-2030) ($MN)
88 Asia Pacific Profilometer Market Outlook, By Contact or Pseudo Contact Method (2021-2030) ($MN)
89 Asia Pacific Profilometer Market Outlook, By Stylus Profilometer (2021-2030) ($MN)
90 Asia Pacific Profilometer Market Outlook, By Atomic Force Microscopy (2021-2030) ($MN)
91 Asia Pacific Profilometer Market Outlook, By Scanning Tunneling Microscopy (2021-2030) ($MN)
92 Asia Pacific Profilometer Market Outlook, By Other Methods (2021-2030) ($MN)
93 Asia Pacific Profilometer Market Outlook, By Dimension (2021-2030) ($MN)
94 Asia Pacific Profilometer Market Outlook, By 2D- dimension (2021-2030) ($MN)
95 Asia Pacific Profilometer Market Outlook, By 3D- dimension (2021-2030) ($MN)
96 Asia Pacific Profilometer Market Outlook, By Application (2021-2030) ($MN)
97 Asia Pacific Profilometer Market Outlook, By Semiconductor (2021-2030) ($MN)
98 Asia Pacific Profilometer Market Outlook, By Mechanical (2021-2030) ($MN)
99 Asia Pacific Profilometer Market Outlook, By Automotive (2021-2030) ($MN)
100 Asia Pacific Profilometer Market Outlook, By Other Applications (2021-2030) ($MN)
101 South America Profilometer Market Outlook, By Country (2021-2030) ($MN)
102 South America Profilometer Market Outlook, By Type (2021-2030) ($MN)
103 South America Profilometer Market Outlook, By Contact Profilometer (2021-2030) ($MN)
104 South America Profilometer Market Outlook, By Non-contact Profilometer (2021-2030) ($MN)
105 South America Profilometer Market Outlook, By Time-resolved Profilometer (2021-2030) ($MN)
106 South America Profilometer Market Outlook, By Fiber-based Optical Profilometer (2021-2030) ($MN)
107 South America Profilometer Market Outlook, By Other Types (2021-2030) ($MN)
108 South America Profilometer Market Outlook, By Method (2021-2030) ($MN)
109 South America Profilometer Market Outlook, By Optical Method (2021-2030) ($MN)
110 South America Profilometer Market Outlook, By Interferometry Based Method (2021-2030) ($MN)
111 South America Profilometer Market Outlook, By Focus Detection Method (2021-2030) ($MN)
112 South America Profilometer Market Outlook, By Pattern Projection Method (2021-2030) ($MN)
113 South America Profilometer Market Outlook, By Contact or Pseudo Contact Method (2021-2030) ($MN)
114 South America Profilometer Market Outlook, By Stylus Profilometer (2021-2030) ($MN)
115 South America Profilometer Market Outlook, By Atomic Force Microscopy (2021-2030) ($MN)
116 South America Profilometer Market Outlook, By Scanning Tunneling Microscopy (2021-2030) ($MN)
117 South America Profilometer Market Outlook, By Other Methods (2021-2030) ($MN)
118 South America Profilometer Market Outlook, By Dimension (2021-2030) ($MN)
119 South America Profilometer Market Outlook, By 2D- dimension (2021-2030) ($MN)
120 South America Profilometer Market Outlook, By 3D- dimension (2021-2030) ($MN)
121 South America Profilometer Market Outlook, By Application (2021-2030) ($MN)
122 South America Profilometer Market Outlook, By Semiconductor (2021-2030) ($MN)
123 South America Profilometer Market Outlook, By Mechanical (2021-2030) ($MN)
124 South America Profilometer Market Outlook, By Automotive (2021-2030) ($MN)
125 South America Profilometer Market Outlook, By Other Applications (2021-2030) ($MN)
126 Middle East & Africa Profilometer Market Outlook, By Country (2021-2030) ($MN)
127 Middle East & Africa Profilometer Market Outlook, By Type (2021-2030) ($MN)
128 Middle East & Africa Profilometer Market Outlook, By Contact Profilometer (2021-2030) ($MN)
129 Middle East & Africa Profilometer Market Outlook, By Non-contact Profilometer (2021-2030) ($MN)
130 Middle East & Africa Profilometer Market Outlook, By Time-resolved Profilometer (2021-2030) ($MN)
131 Middle East & Africa Profilometer Market Outlook, By Fiber-based Optical Profilometer (2021-2030) ($MN)
132 Middle East & Africa Profilometer Market Outlook, By Other Types (2021-2030) ($MN)
133 Middle East & Africa Profilometer Market Outlook, By Method (2021-2030) ($MN)
134 Middle East & Africa Profilometer Market Outlook, By Optical Method (2021-2030) ($MN)
135 Middle East & Africa Profilometer Market Outlook, By Interferometry Based Method (2021-2030) ($MN)
136 Middle East & Africa Profilometer Market Outlook, By Focus Detection Method (2021-2030) ($MN)
137 Middle East & Africa Profilometer Market Outlook, By Pattern Projection Method (2021-2030) ($MN)
138 Middle East & Africa Profilometer Market Outlook, By Contact or Pseudo Contact Method (2021-2030) ($MN)
139 Middle East & Africa Profilometer Market Outlook, By Stylus Profilometer (2021-2030) ($MN)
140 Middle East & Africa Profilometer Market Outlook, By Atomic Force Microscopy (2021-2030) ($MN)
141 Middle East & Africa Profilometer Market Outlook, By Scanning Tunneling Microscopy (2021-2030) ($MN)
142 Middle East & Africa Profilometer Market Outlook, By Other Methods (2021-2030) ($MN)
143 Middle East & Africa Profilometer Market Outlook, By Dimension (2021-2030) ($MN)
144 Middle East & Africa Profilometer Market Outlook, By 2D- dimension (2021-2030) ($MN)
145 Middle East & Africa Profilometer Market Outlook, By 3D- dimension (2021-2030) ($MN)
146 Middle East & Africa Profilometer Market Outlook, By Application (2021-2030) ($MN)
147 Middle East & Africa Profilometer Market Outlook, By Semiconductor (2021-2030) ($MN)
148 Middle East & Africa Profilometer Market Outlook, By Mechanical (2021-2030) ($MN)
149 Middle East & Africa Profilometer Market Outlook, By Automotive (2021-2030) ($MN)
150 Middle East & Africa Profilometer Market Outlook, By Other Applications (2021-2030) ($MN)
List of Figures
RESEARCH METHODOLOGY

We at ‘Stratistics’ opt for an extensive research approach which involves data mining, data validation, and data analysis. The various research sources include in-house repository, secondary research, competitor’s sources, social media research, client internal data, and primary research.
Our team of analysts prefers the most reliable and authenticated data sources in order to perform the comprehensive literature search. With access to most of the authenticated data bases our team highly considers the best mix of information through various sources to obtain extensive and accurate analysis.
Each report takes an average time of a month and a team of 4 industry analysts. The time may vary depending on the scope and data availability of the desired market report. The various parameters used in the market assessment are standardized in order to enhance the data accuracy.
Data Mining
The data is collected from several authenticated, reliable, paid and unpaid sources and is filtered depending on the scope & objective of the research. Our reports repository acts as an added advantage in this procedure. Data gathering from the raw material suppliers, distributors and the manufacturers is performed on a regular basis, this helps in the comprehensive understanding of the products value chain. Apart from the above mentioned sources the data is also collected from the industry consultants to ensure the objective of the study is in the right direction.
Market trends such as technological advancements, regulatory affairs, market dynamics (Drivers, Restraints, Opportunities and Challenges) are obtained from scientific journals, market related national & international associations and organizations.
Data Analysis
From the data that is collected depending on the scope & objective of the research the data is subjected for the analysis. The critical steps that we follow for the data analysis include:
- Product Lifecycle Analysis
- Competitor analysis
- Risk analysis
- Porters Analysis
- PESTEL Analysis
- SWOT Analysis
The data engineering is performed by the core industry experts considering both the Marketing Mix Modeling and the Demand Forecasting. The marketing mix modeling makes use of multiple-regression techniques to predict the optimal mix of marketing variables. Regression factor is based on a number of variables and how they relate to an outcome such as sales or profits.
Data Validation
The data validation is performed by the exhaustive primary research from the expert interviews. This includes telephonic interviews, focus groups, face to face interviews, and questionnaires to validate our research from all aspects. The industry experts we approach come from the leading firms, involved in the supply chain ranging from the suppliers, distributors to the manufacturers and consumers so as to ensure an unbiased analysis.
We are in touch with more than 15,000 industry experts with the right mix of consultants, CEO's, presidents, vice presidents, managers, experts from both supply side and demand side, executives and so on.
The data validation involves the primary research from the industry experts belonging to:
- Leading Companies
- Suppliers & Distributors
- Manufacturers
- Consumers
- Industry/Strategic Consultants
Apart from the data validation the primary research also helps in performing the fill gap research, i.e. providing solutions for the unmet needs of the research which helps in enhancing the reports quality.
For more details about research methodology, kindly write to us at info@strategymrc.com
Frequently Asked Questions
In case of any queries regarding this report, you can contact the customer service by filing the “Inquiry Before Buy” form available on the right hand side. You may also contact us through email: info@strategymrc.com or phone: +1-301-202-5929
Yes, the samples are available for all the published reports. You can request them by filling the “Request Sample” option available in this page.
Yes, you can request a sample with your specific requirements. All the customized samples will be provided as per the requirement with the real data masked.
All our reports are available in Digital PDF format. In case if you require them in any other formats, such as PPT, Excel etc you can submit a request through “Inquiry Before Buy” form available on the right hand side. You may also contact us through email: info@strategymrc.com or phone: +1-301-202-5929
We offer a free 15% customization with every purchase. This requirement can be fulfilled for both pre and post sale. You may send your customization requirements through email at info@strategymrc.com or call us on +1-301-202-5929.
We have 3 different licensing options available in electronic format.
- Single User Licence: Allows one person, typically the buyer, to have access to the ordered product. The ordered product cannot be distributed to anyone else.
- 2-5 User Licence: Allows the ordered product to be shared among a maximum of 5 people within your organisation.
- Corporate License: Allows the product to be shared among all employees of your organisation regardless of their geographical location.
All our reports are typically be emailed to you as an attachment.
To order any available report you need to register on our website. The payment can be made either through CCAvenue or PayPal payments gateways which accept all international cards.
We extend our support to 6 months post sale. A post sale customization is also provided to cover your unmet needs in the report.
Request Customization
We offer complimentary customization of up to 15% with every purchase. To share your customization requirements, feel free to email us at info@strategymrc.com or call us on +1-301-202-5929. .
Please Note: Customization within the 15% threshold is entirely free of charge. If your request exceeds this limit, we will conduct a feasibility assessment. Following that, a detailed quote and timeline will be provided.
WHY CHOOSE US ?

Assured Quality
Best in class reports with high standard of research integrity

24X7 Research Support
Continuous support to ensure the best customer experience.

Free Customization
Adding more values to your product of interest.

Safe & Secure Access
Providing a secured environment for all online transactions.

Trusted by 600+ Brands
Serving the most reputed brands across the world.