
Redox Flow Battery Market
Redox Flow Battery Market Forecasts to 2030 - Global Analysis By Type (Hybrid Redox Flow Battery, Vanadium Redox Flow Battery, Zinc-Bromide, Zinc-Iron and Other Types), Capacity (Up to 100 KW, 100-1000 KW and More Than 1000 KW), Application and By Geography

|
Years Covered |
2021-2030 |
|
Estimated Year Value (2023) |
US $250.7 BN |
|
Projected Year Value (2030) |
US $743.6 BN |
|
CAGR (2023 - 2030) |
16.8% |
|
Regions Covered |
North America, Europe, Asia Pacific, South America, and Middle East & Africa |
|
Countries Covered |
US, Canada, Mexico, Germany, UK, Italy, France, Spain, Japan, China, India, Australia, New Zealand, South Korea, Rest of Asia Pacific, South America, Argentina, Brazil, Chile, Middle East & Africa, Saudi Arabia, UAE, Qatar, and South Africa |
|
Largest Market |
Asia Pacific |
|
Highest Growing Market |
Europe |
According to Stratistics MRC, the Global Redox Flow Battery Market is accounted for $250.7 million in 2023 and is expected to reach $743.6 million by 2030 growing at a CAGR of 16.8% during the forecast period. An electrochemical storage device termed a redox flow battery enables electrical energy to mask chemical energy. A redox flow battery stores energy in liquid electrolyte solutions that pass through an electrochemical cell battery that is mostly used for charging and discharging. These batteries are designed to store electrical energy for dependable, long-term use at a minimal cost. These batteries fail to ignite or explode as frequently when used at room temperature.
According to a statement released by AMG Advanced Metallurgical Group NV 6,000 m³ of vanadium electrolyte is the goal capacity.
Market Dynamics:
Driver:
Demand for energy storage solutions
As global energy consumption continues to rise, coupled with the increasing integration of intermittent renewable energy sources like solar and wind, the need for efficient energy storage technologies becomes paramount. Redox flow batteries offer a versatile and scalable solution for storing surplus energy generated during periods of low demand and releasing it during peak demand periods or when renewable energy sources are unavailable. Moreover, as grid modernization efforts intensify and the electrification of transportation advances, the demand for reliable and resilient energy storage systems grows.
Restraint:
High initial capital investment
Implementing redox flow battery systems requires substantial upfront expenditure for purchasing equipment, installation, and infrastructure development. Compared to other energy storage technologies like lithium-ion batteries, redox flow batteries typically involve higher initial costs due to their complex design, specialized components, and relatively low economies of scale in manufacturing. These upfront expenses can be a deterrent for potential investors, especially in markets with constrained budgets or where competing energy storage solutions offer lower initial capital requirements.
Opportunity:
Advancements in battery technology
Continuous research and development efforts aimed at enhancing the performance, efficiency, and cost-effectiveness of redox flow batteries contribute to expanding their applications and increasing their competitiveness in the energy storage market. Innovations such as improvements in electrode materials, electrolyte formulations and stack designs lead to higher energy density, longer cycle life, and improved efficiency of redox flow battery systems. Additionally, advancements in manufacturing processes and scaling up production capabilities contribute to cost reductions, making redox flow batteries more economically viable compared to traditional energy storage technologies.
Threat:
Complexity and system integration challenges
Redox flow battery systems entail intricate designs and necessitate meticulous integration with auxiliary components such as power electronics, control systems, and grid infrastructure. This complexity not only increases engineering costs but also introduces technical hurdles during deployment and operation, potentially leading to delays and cost overruns. Ensuring seamless integration with existing grid infrastructure and addressing compatibility issues can be particularly challenging, hindering widespread adoption of redox flow batteries in various applications. However, the specialized knowledge and expertise required for system design, installation, and maintenance further elevate operational costs and may limit market accessibility to organizations with sufficient technical capabilities.
Covid-19 Impact:
Initially, disruptions in global supply chains, project delays, and uncertainties in financing slowed down the market growth. Lockdown measures and restrictions on construction activities hampered the deployment of redox flow battery systems in various projects, particularly in the commercial and industrial sectors. The pandemic also highlighted the importance of resilient and reliable energy infrastructure, driving increased interest in energy storage solutions to enhance grid stability and support remote operations. However, as the world gradually recovers from the pandemic, stimulus packages and investments in green recovery initiatives are expected to boost the adoption of redox flow batteries, especially in sectors prioritizing renewable energy integration and grid modernization.
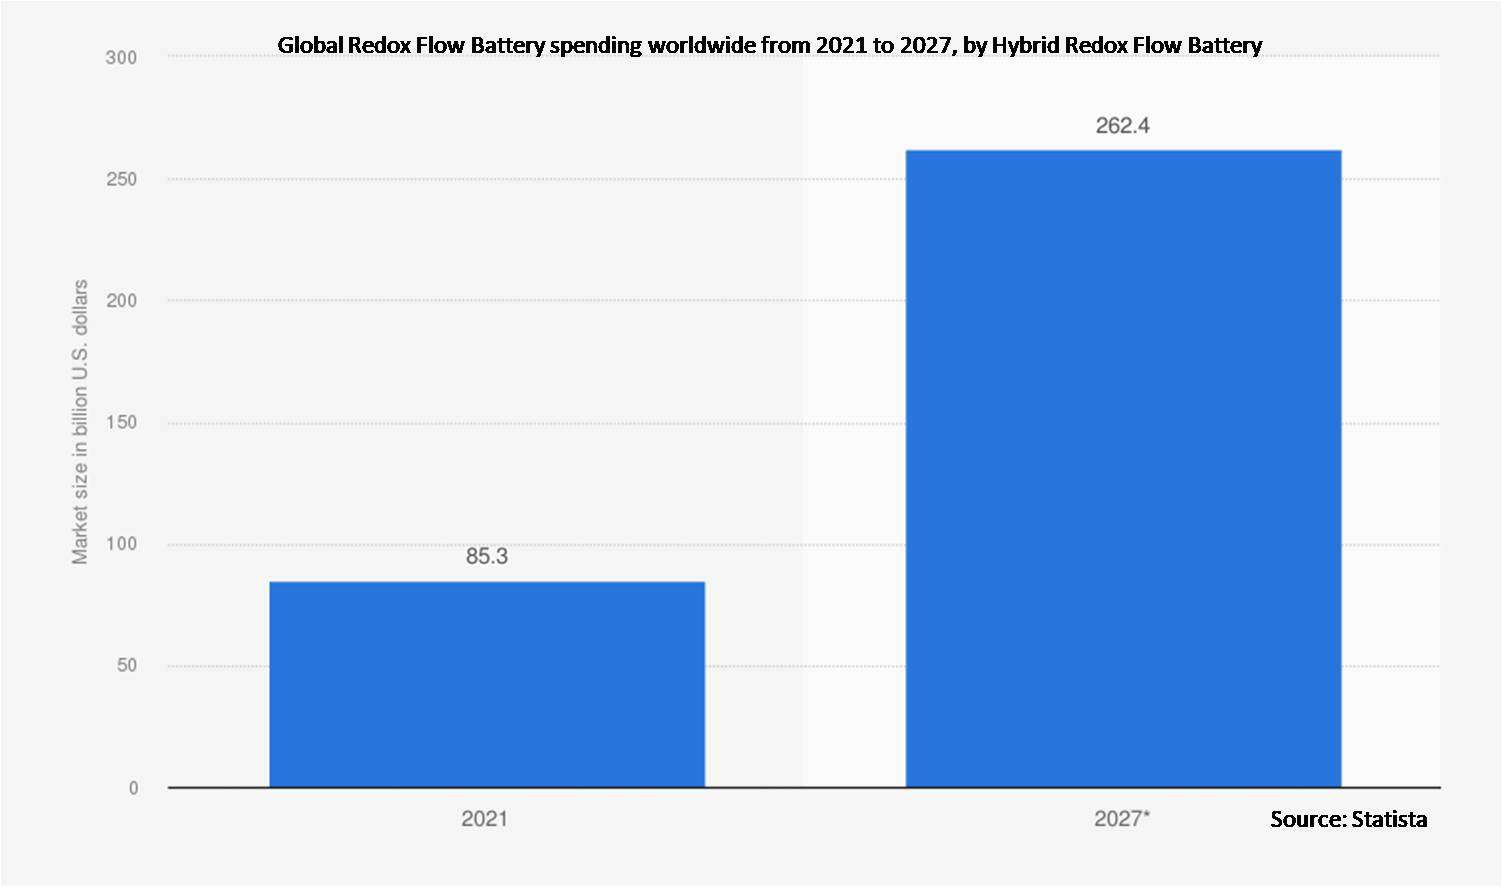
The hybrid redox flow battery segment is expected to be the largest during the forecast period
Hybrid Redox Flow Battery segment dominated the largest share of the market over the estimation period. Hybrid systems combine the advantages of traditional redox flow batteries with other energy storage technologies, such as capacitors or lithium-ion batteries, to address limitations and enhance overall performance. By leveraging the high energy density and long-duration storage capabilities of redox flow batteries with the high power density and fast response times of other energy storage technologies, hybrid systems offer improved efficiency, flexibility, and reliability. These systems are particularly well-suited for applications requiring both high power and energy requirements, such as grid stabilization, renewable energy integration, and electric vehicle charging infrastructure.
The uninterruptible power supply (UPS) segment is expected to have the highest CAGR during the forecast period
Uninterruptible Power Supply (UPS) segment is expected to have the highest CAGR during the forecast period as it offers unique advantages for UPS applications, particularly in sectors where uninterrupted power supply is critical, such as data centers, hospitals, telecommunications, and industrial facilities. Their ability to provide long-duration energy storage, coupled with high reliability and safety, makes redox flow batteries an ideal choice for UPS systems. Furthermore, unlike traditional lead-acid or lithium-ion batteries, redox flow batteries offer virtually unlimited cycle life without degradation, ensuring consistent and reliable backup power over extended periods.
Region with largest share:
The Asia Pacific region is experiencing substantial growth in the Redox Flow Battery Market due to region's rapid industrialization and urbanization have led to increased energy demand, driving the need for reliable and scalable energy storage solutions like redox flow batteries. Supportive government policies and initiatives aimed at promoting renewable energy integration and grid modernization are fostering a favorable regulatory environment for the adoption of redox flow batteries. Additionally, the growing focus on sustainability and environmental conservation is encouraging industries and utilities to invest in energy storage systems to optimize energy utilization and reduce carbon emissions.
Region with highest CAGR:
Europe region is expected to grow at a rapid pace throughout the forecast period as growing investments from both public and private sectors in research, development and deployment of redox flow battery technologies. The rapid deployment of renewable energy installations is creating a need for flexible and scalable energy storage solutions like redox flow batteries to optimize energy utilization and ensure grid stability. Redox flow batteries are finding new applications beyond traditional energy storage, including microgrids, off-grid electrification, electric vehicle charging infrastructure, and industrial applications, further driving market growth in the region. These elements are boosting the regional growth.

Key players in the market
Some of the key players in Redox Flow Battery market include Australian Vanadium Limited, Avalon Battery Corporation, Dalian Rongke Power Co., Ltd, Energy Storage Systems, Inc, HydraRedox, Prudent Energy Corporation, redT Energy Plc, StorEn Technologies Inc, UniEnergy Technologies, VFlowTech and Vionx Energy.
Key Developments:
In November 2023, a strategic collaboration between KEMIWATT and MANN+HUMMEL was launched to create a new range of Redox Flow Batteries. The long-duration stationary energy storage business and KEMIWATT see great benefit from their collaboration at a time when global use of renewable energy sources is accelerating.
In October 2023, the PowerCube 50-250, a new vanadium redox flow battery, is the newest model in the PowerCube series from VFlowTech, a sustainable energy storage solutions company with headquarters in Singapore. Three PowerCube 50-250 units can easily power 108 HDB apartments for a whole year, in addition to supporting the deployment of solar energy while functioning independently inside the microgrid.
In July 2023, a 50 kWh vanadium redox flow battery made by German battery firm VoltStorage was invented to maximize self-consumption in commercial and industrial PV systems. With a system voltage of 48 V, the VoltStorage VDIUM C50 is an AC-coupled battery. The electrolyte is guaranteed for 20 years by the manufacturer, who also states that the annual degradation rate will not exceed 0.3%.
In January 2023, the building of a vanadium electrolyte factory at its subsidiary, AMG Titanium, in Nuremberg, Germany, was authorized by the Management Board, according to a statement released by AMG Advanced Metallurgical Group NV 6,000 m³ of vanadium electrolyte is the goal capacity.
Types Covered:
• Hybrid Redox Flow Battery
• Vanadium Redox Flow Battery
• Zinc-Bromide
• Zinc-Iron
• Other Types
Capacities Covered:
• Up to 100 KW
• 100-1000 KW
• More Than 1000 KW
Applications Covered:
• Energy Shifting
• Peaking Capacity
• Utility Services
• Uninterruptible Power Supply (UPS)
• Off-Grid Solutions
• Commercial
• Other Applications
Regions Covered:
• North America
o US
o Canada
o Mexico
• Europe
o Germany
o UK
o Italy
o France
o Spain
o Rest of Europe
• Asia Pacific
o Japan
o China
o India
o Australia
o New Zealand
o South Korea
o Rest of Asia Pacific
• South America
o Argentina
o Brazil
o Chile
o Rest of South America
• Middle East & Africa
o Saudi Arabia
o UAE
o Qatar
o South Africa
o Rest of Middle East & Africa
What our report offers:
- Market share assessments for the regional and country-level segments
- Strategic recommendations for the new entrants
- Covers Market data for the years 2021, 2022, 2023, 2026, and 2030
- Market Trends (Drivers, Constraints, Opportunities, Threats, Challenges, Investment Opportunities, and recommendations)
- Strategic recommendations in key business segments based on the market estimations
- Competitive landscaping mapping the key common trends
- Company profiling with detailed strategies, financials, and recent developments
- Supply chain trends mapping the latest technological advancements
Free Customization Offerings:
All the customers of this report will be entitled to receive one of the following free customization options:
• Company Profiling
o Comprehensive profiling of additional market players (up to 3)
o SWOT Analysis of key players (up to 3)
• Regional Segmentation
o Market estimations, Forecasts and CAGR of any prominent country as per the client's interest (Note: Depends on feasibility check)
• Competitive Benchmarking
Benchmarking of key players based on product portfolio, geographical presence, and strategic alliances
Table of Contents
1 Executive Summary
2 Preface
2.1 Abstract
2.2 Stake Holders
2.3 Research Scope
2.4 Research Methodology
2.4.1 Data Mining
2.4.2 Data Analysis
2.4.3 Data Validation
2.4.4 Research Approach
2.5 Research Sources
2.5.1 Primary Research Sources
2.5.2 Secondary Research Sources
2.5.3 Assumptions
3 Market Trend Analysis
3.1 Introduction
3.2 Drivers
3.3 Restraints
3.4 Opportunities
3.5 Threats
3.6 Application Analysis
3.7 Emerging Markets
3.8 Impact of Covid-19
4 Porters Five Force Analysis
4.1 Bargaining power of suppliers
4.2 Bargaining power of buyers
4.3 Threat of substitutes
4.4 Threat of new entrants
4.5 Competitive rivalry
5 Global Redox Flow Battery Market, By Type
5.1 Introduction
5.2 Hybrid Redox Flow Battery
5.3 Vanadium Redox Flow Battery
5.4 Zinc-Bromide
5.5 Zinc-Iron
5.6 Other Types
6 Global Redox Flow Battery Market, By Capacity
6.1 Introduction
6.2 Up to 100 KW
6.3 100-1000 KW
6.4 More Than 1000 KW
7 Global Redox Flow Battery Market, By Application
7.1 Introduction
7.2 Energy Shifting
7.3 Peaking Capacity
7.4 Utility Services
7.5 Uninterruptible Power Supply (UPS)
7.6 Off-Grid Solutions
7.7 Commercial
7.8 Other Applications
8 Global Redox Flow Battery Market, By Geography
8.1 Introduction
8.2 North America
8.2.1 US
8.2.2 Canada
8.2.3 Mexico
8.3 Europe
8.3.1 Germany
8.3.2 UK
8.3.3 Italy
8.3.4 France
8.3.5 Spain
8.3.6 Rest of Europe
8.4 Asia Pacific
8.4.1 Japan
8.4.2 China
8.4.3 India
8.4.4 Australia
8.4.5 New Zealand
8.4.6 South Korea
8.4.7 Rest of Asia Pacific
8.5 South America
8.5.1 Argentina
8.5.2 Brazil
8.5.3 Chile
8.5.4 Rest of South America
8.6 Middle East & Africa
8.6.1 Saudi Arabia
8.6.2 UAE
8.6.3 Qatar
8.6.4 South Africa
8.6.5 Rest of Middle East & Africa
9 Key Developments
9.1 Agreements, Partnerships, Collaborations and Joint Ventures
9.2 Acquisitions & Mergers
9.3 New Product Launch
9.4 Expansions
9.5 Other Key Strategies
10 Company Profiling
10.1 Australian Vanadium Limited
10.2 Avalon Battery Corporation
10.3 Dalian Rongke Power Co., Ltd
10.4 Energy Storage Systems, Inc
10.5 HydraRedox
10.6 Prudent Energy Corporation
10.7 redT Energy Plc
10.8 StorEn Technologies Inc
10.9 UniEnergy Technologies
10.10 VFlowTech
10.11 Vionx Energy
List of Tables
1 Global Redox Flow Battery Market Outlook, By Region (2021-2030) ($MN)
2 Global Redox Flow Battery Market Outlook, By Type (2021-2030) ($MN)
3 Global Redox Flow Battery Market Outlook, By Hybrid Redox Flow Battery (2021-2030) ($MN)
4 Global Redox Flow Battery Market Outlook, By Vanadium Redox Flow Battery (2021-2030) ($MN)
5 Global Redox Flow Battery Market Outlook, By Zinc-Bromide (2021-2030) ($MN)
6 Global Redox Flow Battery Market Outlook, By Zinc-Iron (2021-2030) ($MN)
7 Global Redox Flow Battery Market Outlook, By Other Types (2021-2030) ($MN)
8 Global Redox Flow Battery Market Outlook, By Capacity (2021-2030) ($MN)
9 Global Redox Flow Battery Market Outlook, By Up to 100 KW (2021-2030) ($MN)
10 Global Redox Flow Battery Market Outlook, By 100-1000 KW (2021-2030) ($MN)
11 Global Redox Flow Battery Market Outlook, By More Than 1000 KW (2021-2030) ($MN)
12 Global Redox Flow Battery Market Outlook, By Application (2021-2030) ($MN)
13 Global Redox Flow Battery Market Outlook, By Energy Shifting (2021-2030) ($MN)
14 Global Redox Flow Battery Market Outlook, By Peaking Capacity (2021-2030) ($MN)
15 Global Redox Flow Battery Market Outlook, By Utility Services (2021-2030) ($MN)
16 Global Redox Flow Battery Market Outlook, By Uninterruptible Power Supply (UPS) (2021-2030) ($MN)
17 Global Redox Flow Battery Market Outlook, By Off-Grid Solutions (2021-2030) ($MN)
18 Global Redox Flow Battery Market Outlook, By Commercial (2021-2030) ($MN)
19 Global Redox Flow Battery Market Outlook, By Other Applications (2021-2030) ($MN)
20 North America Redox Flow Battery Market Outlook, By Country (2021-2030) ($MN)
21 North America Redox Flow Battery Market Outlook, By Type (2021-2030) ($MN)
22 North America Redox Flow Battery Market Outlook, By Hybrid Redox Flow Battery (2021-2030) ($MN)
23 North America Redox Flow Battery Market Outlook, By Vanadium Redox Flow Battery (2021-2030) ($MN)
24 North America Redox Flow Battery Market Outlook, By Zinc-Bromide (2021-2030) ($MN)
25 North America Redox Flow Battery Market Outlook, By Zinc-Iron (2021-2030) ($MN)
26 North America Redox Flow Battery Market Outlook, By Other Types (2021-2030) ($MN)
27 North America Redox Flow Battery Market Outlook, By Capacity (2021-2030) ($MN)
28 North America Redox Flow Battery Market Outlook, By Up to 100 KW (2021-2030) ($MN)
29 North America Redox Flow Battery Market Outlook, By 100-1000 KW (2021-2030) ($MN)
30 North America Redox Flow Battery Market Outlook, By More Than 1000 KW (2021-2030) ($MN)
31 North America Redox Flow Battery Market Outlook, By Application (2021-2030) ($MN)
32 North America Redox Flow Battery Market Outlook, By Energy Shifting (2021-2030) ($MN)
33 North America Redox Flow Battery Market Outlook, By Peaking Capacity (2021-2030) ($MN)
34 North America Redox Flow Battery Market Outlook, By Utility Services (2021-2030) ($MN)
35 North America Redox Flow Battery Market Outlook, By Uninterruptible Power Supply (UPS) (2021-2030) ($MN)
36 North America Redox Flow Battery Market Outlook, By Off-Grid Solutions (2021-2030) ($MN)
37 North America Redox Flow Battery Market Outlook, By Commercial (2021-2030) ($MN)
38 North America Redox Flow Battery Market Outlook, By Other Applications (2021-2030) ($MN)
39 Europe Redox Flow Battery Market Outlook, By Country (2021-2030) ($MN)
40 Europe Redox Flow Battery Market Outlook, By Type (2021-2030) ($MN)
41 Europe Redox Flow Battery Market Outlook, By Hybrid Redox Flow Battery (2021-2030) ($MN)
42 Europe Redox Flow Battery Market Outlook, By Vanadium Redox Flow Battery (2021-2030) ($MN)
43 Europe Redox Flow Battery Market Outlook, By Zinc-Bromide (2021-2030) ($MN)
44 Europe Redox Flow Battery Market Outlook, By Zinc-Iron (2021-2030) ($MN)
45 Europe Redox Flow Battery Market Outlook, By Other Types (2021-2030) ($MN)
46 Europe Redox Flow Battery Market Outlook, By Capacity (2021-2030) ($MN)
47 Europe Redox Flow Battery Market Outlook, By Up to 100 KW (2021-2030) ($MN)
48 Europe Redox Flow Battery Market Outlook, By 100-1000 KW (2021-2030) ($MN)
49 Europe Redox Flow Battery Market Outlook, By More Than 1000 KW (2021-2030) ($MN)
50 Europe Redox Flow Battery Market Outlook, By Application (2021-2030) ($MN)
51 Europe Redox Flow Battery Market Outlook, By Energy Shifting (2021-2030) ($MN)
52 Europe Redox Flow Battery Market Outlook, By Peaking Capacity (2021-2030) ($MN)
53 Europe Redox Flow Battery Market Outlook, By Utility Services (2021-2030) ($MN)
54 Europe Redox Flow Battery Market Outlook, By Uninterruptible Power Supply (UPS) (2021-2030) ($MN)
55 Europe Redox Flow Battery Market Outlook, By Off-Grid Solutions (2021-2030) ($MN)
56 Europe Redox Flow Battery Market Outlook, By Commercial (2021-2030) ($MN)
57 Europe Redox Flow Battery Market Outlook, By Other Applications (2021-2030) ($MN)
58 Asia Pacific Redox Flow Battery Market Outlook, By Country (2021-2030) ($MN)
59 Asia Pacific Redox Flow Battery Market Outlook, By Type (2021-2030) ($MN)
60 Asia Pacific Redox Flow Battery Market Outlook, By Hybrid Redox Flow Battery (2021-2030) ($MN)
61 Asia Pacific Redox Flow Battery Market Outlook, By Vanadium Redox Flow Battery (2021-2030) ($MN)
62 Asia Pacific Redox Flow Battery Market Outlook, By Zinc-Bromide (2021-2030) ($MN)
63 Asia Pacific Redox Flow Battery Market Outlook, By Zinc-Iron (2021-2030) ($MN)
64 Asia Pacific Redox Flow Battery Market Outlook, By Other Types (2021-2030) ($MN)
65 Asia Pacific Redox Flow Battery Market Outlook, By Capacity (2021-2030) ($MN)
66 Asia Pacific Redox Flow Battery Market Outlook, By Up to 100 KW (2021-2030) ($MN)
67 Asia Pacific Redox Flow Battery Market Outlook, By 100-1000 KW (2021-2030) ($MN)
68 Asia Pacific Redox Flow Battery Market Outlook, By More Than 1000 KW (2021-2030) ($MN)
69 Asia Pacific Redox Flow Battery Market Outlook, By Application (2021-2030) ($MN)
70 Asia Pacific Redox Flow Battery Market Outlook, By Energy Shifting (2021-2030) ($MN)
71 Asia Pacific Redox Flow Battery Market Outlook, By Peaking Capacity (2021-2030) ($MN)
72 Asia Pacific Redox Flow Battery Market Outlook, By Utility Services (2021-2030) ($MN)
73 Asia Pacific Redox Flow Battery Market Outlook, By Uninterruptible Power Supply (UPS) (2021-2030) ($MN)
74 Asia Pacific Redox Flow Battery Market Outlook, By Off-Grid Solutions (2021-2030) ($MN)
75 Asia Pacific Redox Flow Battery Market Outlook, By Commercial (2021-2030) ($MN)
76 Asia Pacific Redox Flow Battery Market Outlook, By Other Applications (2021-2030) ($MN)
77 South America Redox Flow Battery Market Outlook, By Country (2021-2030) ($MN)
78 South America Redox Flow Battery Market Outlook, By Type (2021-2030) ($MN)
79 South America Redox Flow Battery Market Outlook, By Hybrid Redox Flow Battery (2021-2030) ($MN)
80 South America Redox Flow Battery Market Outlook, By Vanadium Redox Flow Battery (2021-2030) ($MN)
81 South America Redox Flow Battery Market Outlook, By Zinc-Bromide (2021-2030) ($MN)
82 South America Redox Flow Battery Market Outlook, By Zinc-Iron (2021-2030) ($MN)
83 South America Redox Flow Battery Market Outlook, By Other Types (2021-2030) ($MN)
84 South America Redox Flow Battery Market Outlook, By Capacity (2021-2030) ($MN)
85 South America Redox Flow Battery Market Outlook, By Up to 100 KW (2021-2030) ($MN)
86 South America Redox Flow Battery Market Outlook, By 100-1000 KW (2021-2030) ($MN)
87 South America Redox Flow Battery Market Outlook, By More Than 1000 KW (2021-2030) ($MN)
88 South America Redox Flow Battery Market Outlook, By Application (2021-2030) ($MN)
89 South America Redox Flow Battery Market Outlook, By Energy Shifting (2021-2030) ($MN)
90 South America Redox Flow Battery Market Outlook, By Peaking Capacity (2021-2030) ($MN)
91 South America Redox Flow Battery Market Outlook, By Utility Services (2021-2030) ($MN)
92 South America Redox Flow Battery Market Outlook, By Uninterruptible Power Supply (UPS) (2021-2030) ($MN)
93 South America Redox Flow Battery Market Outlook, By Off-Grid Solutions (2021-2030) ($MN)
94 South America Redox Flow Battery Market Outlook, By Commercial (2021-2030) ($MN)
95 South America Redox Flow Battery Market Outlook, By Other Applications (2021-2030) ($MN)
96 Middle East & Africa Redox Flow Battery Market Outlook, By Country (2021-2030) ($MN)
97 Middle East & Africa Redox Flow Battery Market Outlook, By Type (2021-2030) ($MN)
98 Middle East & Africa Redox Flow Battery Market Outlook, By Hybrid Redox Flow Battery (2021-2030) ($MN)
99 Middle East & Africa Redox Flow Battery Market Outlook, By Vanadium Redox Flow Battery (2021-2030) ($MN)
100 Middle East & Africa Redox Flow Battery Market Outlook, By Zinc-Bromide (2021-2030) ($MN)
101 Middle East & Africa Redox Flow Battery Market Outlook, By Zinc-Iron (2021-2030) ($MN)
102 Middle East & Africa Redox Flow Battery Market Outlook, By Other Types (2021-2030) ($MN)
103 Middle East & Africa Redox Flow Battery Market Outlook, By Capacity (2021-2030) ($MN)
104 Middle East & Africa Redox Flow Battery Market Outlook, By Up to 100 KW (2021-2030) ($MN)
105 Middle East & Africa Redox Flow Battery Market Outlook, By 100-1000 KW (2021-2030) ($MN)
106 Middle East & Africa Redox Flow Battery Market Outlook, By More Than 1000 KW (2021-2030) ($MN)
107 Middle East & Africa Redox Flow Battery Market Outlook, By Application (2021-2030) ($MN)
108 Middle East & Africa Redox Flow Battery Market Outlook, By Energy Shifting (2021-2030) ($MN)
109 Middle East & Africa Redox Flow Battery Market Outlook, By Peaking Capacity (2021-2030) ($MN)
110 Middle East & Africa Redox Flow Battery Market Outlook, By Utility Services (2021-2030) ($MN)
111 Middle East & Africa Redox Flow Battery Market Outlook, By Uninterruptible Power Supply (UPS) (2021-2030) ($MN)
112 Middle East & Africa Redox Flow Battery Market Outlook, By Off-Grid Solutions (2021-2030) ($MN)
113 Middle East & Africa Redox Flow Battery Market Outlook, By Commercial (2021-2030) ($MN)
114 Middle East & Africa Redox Flow Battery Market Outlook, By Other Applications (2021-2030) ($MN)
List of Figures
RESEARCH METHODOLOGY

We at ‘Stratistics’ opt for an extensive research approach which involves data mining, data validation, and data analysis. The various research sources include in-house repository, secondary research, competitor’s sources, social media research, client internal data, and primary research.
Our team of analysts prefers the most reliable and authenticated data sources in order to perform the comprehensive literature search. With access to most of the authenticated data bases our team highly considers the best mix of information through various sources to obtain extensive and accurate analysis.
Each report takes an average time of a month and a team of 4 industry analysts. The time may vary depending on the scope and data availability of the desired market report. The various parameters used in the market assessment are standardized in order to enhance the data accuracy.
Data Mining
The data is collected from several authenticated, reliable, paid and unpaid sources and is filtered depending on the scope & objective of the research. Our reports repository acts as an added advantage in this procedure. Data gathering from the raw material suppliers, distributors and the manufacturers is performed on a regular basis, this helps in the comprehensive understanding of the products value chain. Apart from the above mentioned sources the data is also collected from the industry consultants to ensure the objective of the study is in the right direction.
Market trends such as technological advancements, regulatory affairs, market dynamics (Drivers, Restraints, Opportunities and Challenges) are obtained from scientific journals, market related national & international associations and organizations.
Data Analysis
From the data that is collected depending on the scope & objective of the research the data is subjected for the analysis. The critical steps that we follow for the data analysis include:
- Product Lifecycle Analysis
- Competitor analysis
- Risk analysis
- Porters Analysis
- PESTEL Analysis
- SWOT Analysis
The data engineering is performed by the core industry experts considering both the Marketing Mix Modeling and the Demand Forecasting. The marketing mix modeling makes use of multiple-regression techniques to predict the optimal mix of marketing variables. Regression factor is based on a number of variables and how they relate to an outcome such as sales or profits.
Data Validation
The data validation is performed by the exhaustive primary research from the expert interviews. This includes telephonic interviews, focus groups, face to face interviews, and questionnaires to validate our research from all aspects. The industry experts we approach come from the leading firms, involved in the supply chain ranging from the suppliers, distributors to the manufacturers and consumers so as to ensure an unbiased analysis.
We are in touch with more than 15,000 industry experts with the right mix of consultants, CEO's, presidents, vice presidents, managers, experts from both supply side and demand side, executives and so on.
The data validation involves the primary research from the industry experts belonging to:
- Leading Companies
- Suppliers & Distributors
- Manufacturers
- Consumers
- Industry/Strategic Consultants
Apart from the data validation the primary research also helps in performing the fill gap research, i.e. providing solutions for the unmet needs of the research which helps in enhancing the reports quality.
For more details about research methodology, kindly write to us at info@strategymrc.com
Frequently Asked Questions
In case of any queries regarding this report, you can contact the customer service by filing the “Inquiry Before Buy” form available on the right hand side. You may also contact us through email: info@strategymrc.com or phone: +1-301-202-5929
Yes, the samples are available for all the published reports. You can request them by filling the “Request Sample” option available in this page.
Yes, you can request a sample with your specific requirements. All the customized samples will be provided as per the requirement with the real data masked.
All our reports are available in Digital PDF format. In case if you require them in any other formats, such as PPT, Excel etc you can submit a request through “Inquiry Before Buy” form available on the right hand side. You may also contact us through email: info@strategymrc.com or phone: +1-301-202-5929
We offer a free 15% customization with every purchase. This requirement can be fulfilled for both pre and post sale. You may send your customization requirements through email at info@strategymrc.com or call us on +1-301-202-5929.
We have 3 different licensing options available in electronic format.
- Single User Licence: Allows one person, typically the buyer, to have access to the ordered product. The ordered product cannot be distributed to anyone else.
- 2-5 User Licence: Allows the ordered product to be shared among a maximum of 5 people within your organisation.
- Corporate License: Allows the product to be shared among all employees of your organisation regardless of their geographical location.
All our reports are typically be emailed to you as an attachment.
To order any available report you need to register on our website. The payment can be made either through CCAvenue or PayPal payments gateways which accept all international cards.
We extend our support to 6 months post sale. A post sale customization is also provided to cover your unmet needs in the report.
Request Customization
We offer complimentary customization of up to 15% with every purchase. To share your customization requirements, feel free to email us at info@strategymrc.com or call us on +1-301-202-5929. .
Please Note: Customization within the 15% threshold is entirely free of charge. If your request exceeds this limit, we will conduct a feasibility assessment. Following that, a detailed quote and timeline will be provided.
WHY CHOOSE US ?

Assured Quality
Best in class reports with high standard of research integrity

24X7 Research Support
Continuous support to ensure the best customer experience.

Free Customization
Adding more values to your product of interest.

Safe & Secure Access
Providing a secured environment for all online transactions.

Trusted by 600+ Brands
Serving the most reputed brands across the world.