
Refillable Personal Care Products Market
Refillable Personal Care Products Market Forecasts to 2034 - Global Analysis By Product Type (Skincare Products, Haircare Products, Oral Care Products, Fragrances & Deodorants and Other Product Types), Refill Format, Packaging Type, Distribution Channel, and End User

|
Years Covered |
2023-2034 |
|
Estimated Year Value (2026) |
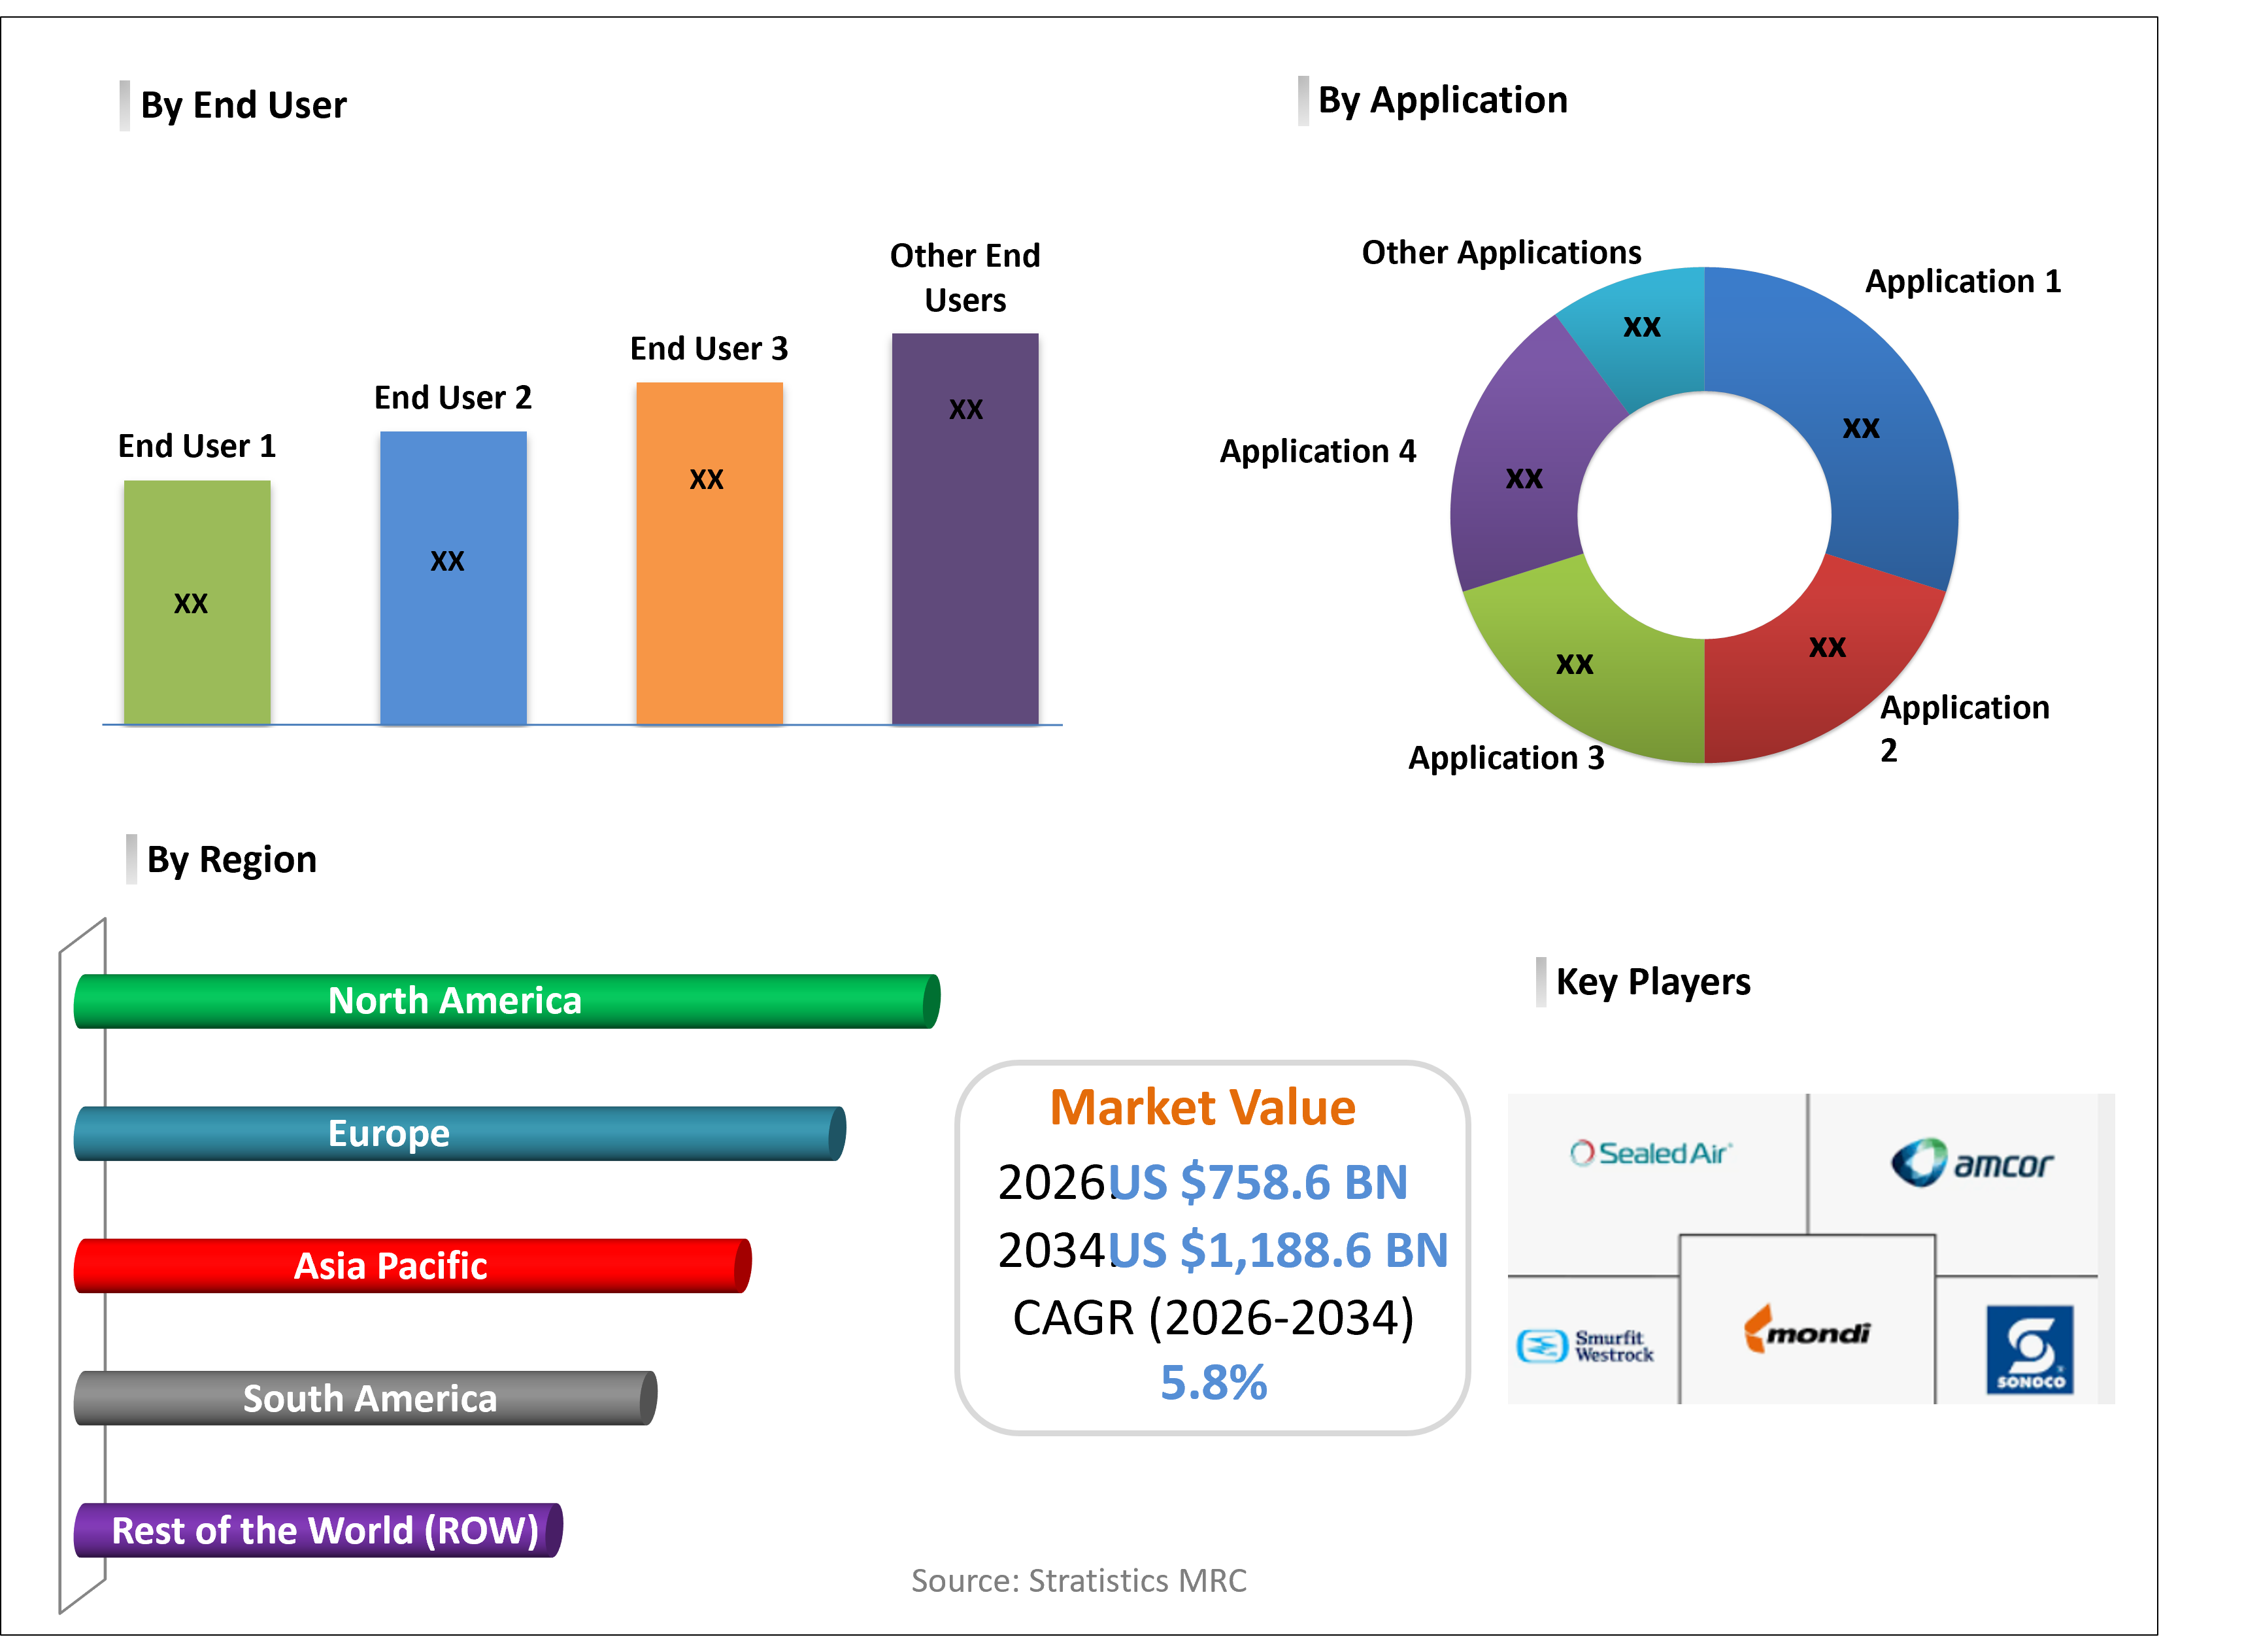
US $12.6 BN |
|
Projected Year Value (2034) |
US $42.8 BN |
|
CAGR (2026-2034) |
16.5% |
|
Regions Covered |
North America, Europe, Asia Pacific, South America, and Rest of the World (RoW) |
|
Countries Covered |
United States, Canada, Mexico, United Kingdom, Germany, France, Italy, Spain, Netherlands, Belgium, Sweden, Switzerland, Poland, Rest of Europe, China, Japan, India, South Korea, Australia, Indonesia, Thailand, Malaysia, Singapore, Vietnam, Rest of Asia Pacific, Brazil, Argentina, Colombia, Chile, Peru, Rest of South America, Saudi Arabia, United Arab Emirates, Qatar, Israel, Rest of Middle East, South Africa, Egypt, Morocco, and Rest of Africa. |
|
Largest Market |
Europe |
|
Highest Growing Market |
Asia Pacific |
According to Stratistics MRC, the Global Refillable Personal Care Products Market is accounted for $12.6 billion in 2026 and is expected to reach $42.8 billion by 2034 growing at a CAGR of 16.5% during the forecast period. Refillable Personal Care Products are designed to reduce packaging waste by allowing consumers to reuse containers and purchase refill packs. These products include skincare, haircare, and hygiene items offered in refillable formats. They help lower plastic consumption and promote sustainable consumption patterns. Increasing environmental awareness and corporate sustainability commitments are driving adoption. Brands are investing in innovative packaging designs and refill systems to enhance convenience and encourage consumer participation in sustainable practices.
Market Dynamics:
Driver:
Increasing focus on plastic reduction
Rising awareness of environmental impacts from single-use plastics has accelerated demand for refillable solutions. Brands are responding by introducing eco-friendly formats that align with circular economy principles. Consumer preference for sustainable lifestyles further reinforces this trend. Retailers are also promoting refill stations and reusable packaging to meet sustainability goals. Collectively, plastic reduction initiatives remain the strongest driver of market growth.
Restraint:
Hygiene concerns in refill processes
Consumers often question the safety and cleanliness of in-store refill stations and reusable containers. Fear of contamination or improper handling reduces confidence in refillable formats. Regulatory requirements for hygiene standards add complexity for manufacturers and retailers. Limited consumer education on safe refill practices exacerbates the issue. As a result, hygiene concerns continue to slow widespread adoption of refillable personal care products.
Opportunity:
In-store refill station expansion
Retailers are increasingly investing in refill infrastructure to encourage sustainable purchasing behavior. These stations allow consumers to reduce packaging waste while accessing cost-effective product options. Integration with digital loyalty programs enhances customer engagement. Partnerships between brands and retailers are driving innovation in refill formats. As refill stations become more mainstream, they will serve as a key growth catalyst for the market.
Threat:
Consumer inconvenience in refilling
Consumer inconvenience in refilling remains a critical threat to market adoption. Many users perceive refill processes as time-consuming compared to purchasing ready-packaged products. Limited availability of refill stations further adds to the challenge. Inconsistent refill experiences across retailers can frustrate consumers and reduce repeat usage. The need to carry reusable containers also deters some buyers. These factors highlight the importance of convenience-focused innovation to overcome adoption barriers.
Covid-19 Impact:
The Covid-19 pandemic had a mixed impact on the refillable personal care products market. Heightened hygiene concerns initially reduced consumer willingness to use refill stations. However, the pandemic also accelerated awareness of sustainability and responsible consumption. Online retail channels gained prominence, offering refill packs and eco-friendly alternatives. Supply chain disruptions highlighted the need for resilient packaging solutions.
The skincare products segment is expected to be the largest during the forecast period
The skincare products segment is expected to account for the largest market share during the forecast period as its essential role in daily personal care routines. Rising demand for moisturizers, cleansers, and serums supports segment dominance. Skincare brands are leading the transition to refillable packaging formats. Consumer preference for premium, eco-friendly skincare further strengthens adoption. Regulatory emphasis on sustainable packaging enhances market confidence.
The online retail segment is expected to have the highest CAGR during the forecast period
Over the forecast period, the online retail segment is predicted to witness the highest growth rate due to rising digital adoption and subscription models fuel growth in this segment. E-commerce platforms provide convenient access to refill packs and eco-friendly personal care products. Online channels also enable brands to educate consumers about sustainability benefits. Direct-to-consumer strategies enhance personalization and loyalty. As a result, online retail will witness the fastest growth rate in the refillable personal care products market.
Region with largest share:
During the forecast period, the Europe region is expected to hold the largest market share owing to strong regulatory frameworks promoting sustainability. Consumer awareness of eco-friendly living is particularly high across Western Europe. The presence of leading personal care brands reinforces regional dominance. Government-led initiatives supporting circular economy practices further strengthen adoption. Premium demand for refillable and certified sustainable products enhances market growth.
Region with highest CAGR:
Over the forecast period, the Asia Pacific region is anticipated to exhibit the highest CAGR driven by rapid urbanization and rising health awareness. Expanding middle-class populations in countries such as China and India fuel demand for sustainable personal care solutions. Increasing pollution concerns heighten consumer interest in eco-friendly alternatives. E-commerce platforms accelerate accessibility of refillable products across diverse geographies. Government-led initiatives promoting environmental responsibility further support adoption.

Key players in the market
Some of the key players in Refillable Personal Care Products Market include L’Oréal S.A., Unilever plc, Procter & Gamble Company, Beiersdorf AG, Estée Lauder Companies Inc., The Body Shop International Limited, Lush Cosmetics Ltd., Shiseido Company, Limited, Kao Corporation, Amorepacific Corporation, Henkel AG & Co. KGaA, Coty Inc., Puig Group, Rituals Cosmetics and Fenty Beauty.
Key Developments:
In March 2026, Puig reported a significant strategic expansion with a specific target to double its market share in China by the end of the year. This move leverages the company's 2024 IPO capital to open new flagship boutiques for Byredo and Penhaligon's, featuring in-store "AirParfum" sampling and refill stations to capture the rising demand for prestige, sustainable scents among affluent urban consumers.
In January 2024, L'Oréal expanded its "refill revolution" through a strategic pilot program with Sephora to deploy multi-brand fragrance refill fountains in flagship stores. This partnership allows customers to refill bestselling scents from Lancôme, YSL, and Prada at the point of sale, utilizing a modernized version of the "Mugler Fountain" concept to reduce glass and plastic waste by over 40%.
Product Types Covered:
• Skincare Products
• Haircare Products
• Oral Care Products
• Fragrances & Deodorants
• Other Product Types
Refill Formats Covered:
• Refill Packs & Pouches
• Refill Cartridges
• In-Store Refill Systems
• Subscription Refill Models
• Other Refill Formats
Packaging Types Covered:
• Reusable Containers
• Recyclable Packaging
• Glass Packaging
• Metal Packaging
• Other Packaging Types
Distribution Channels Covered:
• Specialty Stores
• Online Retail
• Supermarkets & Hypermarkets
• Pharmacies
• Other Distribution Channels
End Users Covered:
• Men
• Women
• Unisex Consumers
• Professional Salons
• Other End Users
Regions Covered:
• North America
o United States
o Canada
o Mexico
• Europe
o United Kingdom
o Germany
o France
o Italy
o Spain
o Netherlands
o Belgium
o Sweden
o Switzerland
o Poland
o Rest of Europe
• Asia Pacific
o China
o Japan
o India
o South Korea
o Australia
o Indonesia
o Thailand
o Malaysia
o Singapore
o Vietnam
o Rest of Asia Pacific
• South America
o Brazil
o Argentina
o Colombia
o Chile
o Peru
o Rest of South America
• Rest of the World (RoW)
o Middle East
§ Saudi Arabia
§ United Arab Emirates
§ Qatar
§ Israel
§ Rest of Middle East
o Africa
§ South Africa
§ Egypt
§ Morocco
§ Rest of Africa
What our report offers:
- Market share assessments for the regional and country-level segments
- Strategic recommendations for the new entrants
- Covers Market data for the years 2023, 2024, 2025, 2026, 2027, 2028, 2030, 2032 and 2034
- Market Trends (Drivers, Constraints, Opportunities, Threats, Challenges, Investment Opportunities, and recommendations)
- Strategic recommendations in key business segments based on the market estimations
- Competitive landscaping mapping the key common trends
- Company profiling with detailed strategies, financials, and recent developments
- Supply chain trends mapping the latest technological advancements
Free Customization Offerings:
All the customers of this report will be entitled to receive one of the following free customization options:
• Company Profiling
o Comprehensive profiling of additional market players (up to 3)
o SWOT Analysis of key players (up to 3)
• Regional Segmentation
o Market estimations, Forecasts and CAGR of any prominent country as per the client's interest (Note: Depends on feasibility check)
• Competitive Benchmarking
o Benchmarking of key players based on product portfolio, geographical presence, and strategic alliances
Table of Contents
1 Executive Summary
1.1 Market Snapshot and Key Highlights
1.2 Growth Drivers, Challenges, and Opportunities
1.3 Competitive Landscape Overview
1.4 Strategic Insights and Recommendations
2 Research Framework
2.1 Study Objectives and Scope
2.2 Stakeholder Analysis
2.3 Research Assumptions and Limitations
2.4 Research Methodology
2.4.1 Data Collection (Primary and Secondary)
2.4.2 Data Modeling and Estimation Techniques
2.4.3 Data Validation and Triangulation
2.4.4 Analytical and Forecasting Approach
3 Market Dynamics and Trend Analysis
3.1 Market Definition and Structure
3.2 Key Market Drivers
3.3 Market Restraints and Challenges
3.4 Growth Opportunities and Investment Hotspots
3.5 Industry Threats and Risk Assessment
3.6 Technology and Innovation Landscape
3.7 Emerging and High-Growth Markets
3.8 Regulatory and Policy Environment
3.9 Impact of COVID-19 and Recovery Outlook
4 Competitive and Strategic Assessment
4.1 Porter's Five Forces Analysis
4.1.1 Supplier Bargaining Power
4.1.2 Buyer Bargaining Power
4.1.3 Threat of Substitutes
4.1.4 Threat of New Entrants
4.1.5 Competitive Rivalry
4.2 Market Share Analysis of Key Players
4.3 Product Benchmarking and Performance Comparison
5 Global Refillable Personal Care Products Market, By Product Type
5.1 Skincare Products
5.2 Haircare Products
5.3 Oral Care Products
5.4 Fragrances & Deodorants
5.5 Other Product Types
6 Global Refillable Personal Care Products Market, By Refill Format
6.1 Refill Packs & Pouches
6.2 Refill Cartridges
6.3 In-Store Refill Systems
6.4 Subscription Refill Models
6.5 Other Refill Formats
7 Global Refillable Personal Care Products Market, By Packaging Type
7.1 Reusable Containers
7.2 Recyclable Packaging
7.3 Glass Packaging
7.4 Metal Packaging
7.5 Other Packaging Types
8 Global Refillable Personal Care Products Market, By Distribution Channel
8.1 Specialty Stores
8.2 Online Retail
8.3 Supermarkets & Hypermarkets
8.4 Pharmacies
8.5 Other Distribution Channels
9 Global Refillable Personal Care Products Market, By End User
9.1 Men
9.2 Women
9.3 Unisex Consumers
9.4 Professional Salons
9.5 Other End Users
10 Global Refillable Personal Care Products Market, By Geography
10.1 North America
10.1.1 United States
10.1.2 Canada
10.1.3 Mexico
10.2 Europe
10.2.1 United Kingdom
10.2.2 Germany
10.2.3 France
10.2.4 Italy
10.2.5 Spain
10.2.6 Netherlands
10.2.7 Belgium
10.2.8 Sweden
10.2.9 Switzerland
10.2.10 Poland
10.2.11 Rest of Europe
10.3 Asia Pacific
10.3.1 China
10.3.2 Japan
10.3.3 India
10.3.4 South Korea
10.3.5 Australia
10.3.6 Indonesia
10.3.7 Thailand
10.3.8 Malaysia
10.3.9 Singapore
10.3.10 Vietnam
10.3.11 Rest of Asia Pacific
10.4 South America
10.4.1 Brazil
10.4.2 Argentina
10.4.3 Colombia
10.4.4 Chile
10.4.5 Peru
10.4.6 Rest of South America
10.5 Rest of the World (RoW)
10.5.1 Middle East
10.5.1.1 Saudi Arabia
10.5.1.2 United Arab Emirates
10.5.1.3 Qatar
10.5.1.4 Israel
10.5.1.5 Rest of Middle East
10.5.2 Africa
10.5.2.1 South Africa
10.5.2.2 Egypt
10.5.2.3 Morocco
10.5.2.4 Rest of Africa
11 Strategic Market Intelligence
11.1 Industry Value Network and Supply Chain Assessment
11.2 White-Space and Opportunity Mapping
11.3 Product Evolution and Market Life Cycle Analysis
11.4 Channel, Distributor, and Go-to-Market Assessment
12 Industry Developments and Strategic Initiatives
12.1 Mergers and Acquisitions
12.2 Partnerships, Alliances, and Joint Ventures
12.3 New Product Launches and Certifications
12.4 Capacity Expansion and Investments
12.5 Other Strategic Initiatives
13 Company Profiles
13.1 L’Oréal S.A.
13.2 Unilever plc
13.3 Procter & Gamble Company
13.4 Beiersdorf AG
13.5 Estée Lauder Companies Inc.
13.6 The Body Shop International Limited
13.7 Lush Cosmetics Ltd.
13.8 Shiseido Company, Limited
13.9 Kao Corporation
13.10 Amorepacific Corporation
13.11 Henkel AG & Co. KGaA
13.12 Coty Inc.
13.13 Puig Group
13.14 Rituals Cosmetics
13.15 Fenty Beauty
List of Tables
1 Global Refillable Personal Care Products Market Outlook, By Region (2023-2034) ($MN)
2 Global Refillable Personal Care Products Market, By Product Type (2023–2034) ($MN)
3 Global Refillable Personal Care Products Market, By Skincare Products (2023–2034) ($MN)
4 Global Refillable Personal Care Products Market, By Haircare Products (2023–2034) ($MN)
5 Global Refillable Personal Care Products Market, By Oral Care Products (2023–2034) ($MN)
6 Global Refillable Personal Care Products Market, By Fragrances & Deodorants (2023–2034) ($MN)
7 Global Refillable Personal Care Products Market, By Other Product Types (2023–2034) ($MN)
8 Global Refillable Personal Care Products Market, By Refill Format (2023–2034) ($MN)
9 Global Refillable Personal Care Products Market, By Refill Packs & Pouches (2023–2034) ($MN)
10 Global Refillable Personal Care Products Market, By Refill Cartridges (2023–2034) ($MN)
11 Global Refillable Personal Care Products Market, By In-Store Refill Systems (2023–2034) ($MN)
12 Global Refillable Personal Care Products Market, By Subscription Refill Models (2023–2034) ($MN)
13 Global Refillable Personal Care Products Market, By Other Refill Formats (2023–2034) ($MN)
14 Global Refillable Personal Care Products Market, By Packaging Type (2023–2034) ($MN)
15 Global Refillable Personal Care Products Market, By Reusable Containers (2023–2034) ($MN)
16 Global Refillable Personal Care Products Market, By Recyclable Packaging (2023–2034) ($MN)
17 Global Refillable Personal Care Products Market, By Glass Packaging (2023–2034) ($MN)
18 Global Refillable Personal Care Products Market, By Metal Packaging (2023–2034) ($MN)
19 Global Refillable Personal Care Products Market, By Other Packaging Types (2023–2034) ($MN)
20 Global Refillable Personal Care Products Market, By Distribution Channel (2023–2034) ($MN)
21 Global Refillable Personal Care Products Market, By Specialty Stores (2023–2034) ($MN)
22 Global Refillable Personal Care Products Market, By Online Retail (2023–2034) ($MN)
23 Global Refillable Personal Care Products Market, By Supermarkets & Hypermarkets (2023–2034) ($MN)
24 Global Refillable Personal Care Products Market, By Pharmacies (2023–2034) ($MN)
25 Global Refillable Personal Care Products Market, By Other Distribution Channels (2023–2034) ($MN)
26 Global Refillable Personal Care Products Market, By End User (2023–2034) ($MN)
27 Global Refillable Personal Care Products Market, By Men (2023–2034) ($MN)
28 Global Refillable Personal Care Products Market, By Women (2023–2034) ($MN)
29 Global Refillable Personal Care Products Market, By Unisex Consumers (2023–2034) ($MN)
30 Global Refillable Personal Care Products Market, By Professional Salons (2023–2034) ($MN)
31 Global Refillable Personal Care Products Market, By Other End Users (2023–2034) ($MN)
Note: Tables for North America, Europe, APAC, South America, and Rest of the World (RoW) are also represented in the same manner as above.
List of Figures
RESEARCH METHODOLOGY

We at ‘Stratistics’ opt for an extensive research approach which involves data mining, data validation, and data analysis. The various research sources include in-house repository, secondary research, competitor’s sources, social media research, client internal data, and primary research.
Our team of analysts prefers the most reliable and authenticated data sources in order to perform the comprehensive literature search. With access to most of the authenticated data bases our team highly considers the best mix of information through various sources to obtain extensive and accurate analysis.
Each report takes an average time of a month and a team of 4 industry analysts. The time may vary depending on the scope and data availability of the desired market report. The various parameters used in the market assessment are standardized in order to enhance the data accuracy.
Data Mining
The data is collected from several authenticated, reliable, paid and unpaid sources and is filtered depending on the scope & objective of the research. Our reports repository acts as an added advantage in this procedure. Data gathering from the raw material suppliers, distributors and the manufacturers is performed on a regular basis, this helps in the comprehensive understanding of the products value chain. Apart from the above mentioned sources the data is also collected from the industry consultants to ensure the objective of the study is in the right direction.
Market trends such as technological advancements, regulatory affairs, market dynamics (Drivers, Restraints, Opportunities and Challenges) are obtained from scientific journals, market related national & international associations and organizations.
Data Analysis
From the data that is collected depending on the scope & objective of the research the data is subjected for the analysis. The critical steps that we follow for the data analysis include:
- Product Lifecycle Analysis
- Competitor analysis
- Risk analysis
- Porters Analysis
- PESTEL Analysis
- SWOT Analysis
The data engineering is performed by the core industry experts considering both the Marketing Mix Modeling and the Demand Forecasting. The marketing mix modeling makes use of multiple-regression techniques to predict the optimal mix of marketing variables. Regression factor is based on a number of variables and how they relate to an outcome such as sales or profits.
Data Validation
The data validation is performed by the exhaustive primary research from the expert interviews. This includes telephonic interviews, focus groups, face to face interviews, and questionnaires to validate our research from all aspects. The industry experts we approach come from the leading firms, involved in the supply chain ranging from the suppliers, distributors to the manufacturers and consumers so as to ensure an unbiased analysis.
We are in touch with more than 15,000 industry experts with the right mix of consultants, CEO's, presidents, vice presidents, managers, experts from both supply side and demand side, executives and so on.
The data validation involves the primary research from the industry experts belonging to:
- Leading Companies
- Suppliers & Distributors
- Manufacturers
- Consumers
- Industry/Strategic Consultants
Apart from the data validation the primary research also helps in performing the fill gap research, i.e. providing solutions for the unmet needs of the research which helps in enhancing the reports quality.
For more details about research methodology, kindly write to us at info@strategymrc.com
Frequently Asked Questions
In case of any queries regarding this report, you can contact the customer service by filing the “Inquiry Before Buy” form available on the right hand side. You may also contact us through email: info@strategymrc.com or phone: +1-301-202-5929
Yes, the samples are available for all the published reports. You can request them by filling the “Request Sample” option available in this page.
Yes, you can request a sample with your specific requirements. All the customized samples will be provided as per the requirement with the real data masked.
All our reports are available in Digital PDF format. In case if you require them in any other formats, such as PPT, Excel etc you can submit a request through “Inquiry Before Buy” form available on the right hand side. You may also contact us through email: info@strategymrc.com or phone: +1-301-202-5929
We offer a free 15% customization with every purchase. This requirement can be fulfilled for both pre and post sale. You may send your customization requirements through email at info@strategymrc.com or call us on +1-301-202-5929.
We have 3 different licensing options available in electronic format.
- Single User Licence: Allows one person, typically the buyer, to have access to the ordered product. The ordered product cannot be distributed to anyone else.
- 2-5 User Licence: Allows the ordered product to be shared among a maximum of 5 people within your organisation.
- Corporate License: Allows the product to be shared among all employees of your organisation regardless of their geographical location.
All our reports are typically be emailed to you as an attachment.
To order any available report you need to register on our website. The payment can be made either through CCAvenue or PayPal payments gateways which accept all international cards.
We extend our support to 6 months post sale. A post sale customization is also provided to cover your unmet needs in the report.
Request Customization
We offer complimentary customization of up to 15% with every purchase. To share your customization requirements, feel free to email us at info@strategymrc.com or call us on +1-301-202-5929. .
Please Note: Customization within the 15% threshold is entirely free of charge. If your request exceeds this limit, we will conduct a feasibility assessment. Following that, a detailed quote and timeline will be provided.
WHY CHOOSE US ?

Assured Quality
Best in class reports with high standard of research integrity

24X7 Research Support
Continuous support to ensure the best customer experience.

Free Customization
Adding more values to your product of interest.

Safe & Secure Access
Providing a secured environment for all online transactions.

Trusted by 600+ Brands
Serving the most reputed brands across the world.