
Remote Power Panel Market
Remote Power Panel Market Forecasts to 2028 - Global Analysis By Type (Floor-Standing, Wall-Mounted and Other Types), Application (Network Cabinets, Server Rooms and Other Applications) and By Geography

|
Years Covered |
2020-2028 |
|
Estimated Year Value (2022) |
US $1.02 BN |
|
Projected Year Value (2028) |
US $1.52 BN |
|
CAGR (2022 - 2028) |
6.8% |
|
Regions Covered |
North America, Europe, Asia Pacific, South America, and Middle East & Africa |
|
Countries Covered |
US, Canada, Mexico, Germany, UK, Italy, France, Spain, Japan, China, India, Australia, New Zealand, South Korea, Rest of Asia Pacific, South America, Argentina, Brazil, Chile, Middle East & Africa, Saudi Arabia, UAE, Qatar, and South Africa |
|
Largest Market |
North America |
|
Highest Growing Market |
Asia Pacific |
According to Stratistics MRC, the Global Remote Power Panel Market is accounted for $1.02 billion in 2022 and is expected to reach $1.52 billion by 2028 growing at a CAGR of 6.8% during the forecast period. Modern power distribution systems must include remote power panels because they offer a reliable and efficient way to monitor and control power distribution assets from a central location. It's crucial to keep up with the most recent innovations and trends in the Remote Power Panel market as a consultant or industry expert at the VP level.
According to the BP Statistical Review of World Energy 2022, the primary energy consumption in the region increased from 220, 48 exajoules in 2013 to 272.45 exajoules in 2021. According to China's National Energy Administration, the country's renewable installed capacity reached 1.063 terawatts by the end of 2021, accounting for about 44.8% of the total installed generation capacity. According to the National Energy Administration (NEA) data, China installed 87.4 GW of solar in 2022.
Market Dynamics:
Driver:
Adoption of digital technologies in IT sector
A strong push towards digitization is driving the IT sector's rapid growth. To avoid data loss and assure automatic data backups, cloud storage solutions are becoming more and more popular. With the rapid improvements in the IT industry and the rising popularity of digital technologies and cloud services, there is a growing need for reliable data centres. Data centre investments are finding a variety of new prospects as a result of investments in digitalization. These initiatives are expected to increase demand for RPPs since they offer an essential layer of redundancy and failover security, aid in power usage optimisation and energy cost reduction, and allow IT managers to control power usage from any location in the world.
Restraint:
Technological advancements in power distribution systems will reduce the usage of RPPs
In light of their many advantages, various power distribution structural designs utilising overhead busway distribution systems are now being included in data centres more frequently for power distribution. Initially, major power distribution units (PDUs), which branch out to smaller remote power panels (RPPs), which provide power whips to racks, were used for power distribution in data centres as a normal industrial practise. Due to the frequent component replacements needed for power distribution, electricians are compelled to constantly utilise fresh whips, even when they are overheated. As a result, fewer PDUs and RPPs are required for power distribution.
Opportunity:
Huge investments, along with enforcement of stringent standards
Data centres generate a sizable amount of carbon emissions and are heavy users of water and electricity. Investors now have the chance to secure data centres with carbon-free energy sources thanks to these innovations. In order to better meet sustainability objectives, measurement and monitoring of data centre energy consumption are gaining popularity. Data centre operators may remotely manage and monitor power consumption with the help of RPPs, which enables them to spot places where energy is being wasted and make changes to lower energy consumption. This is crucial at a time when demand for data processing and storage is rising and data centres are playing a bigger role in the world's technological infrastructure.
Threat:
Entry barriers due to difficulty in complying with complex standards
Vendors of remote power panels must adhere to all legal requirements that apply to power supplies for data centres. The International Organisation for Standardisation (ISO), the European Committee for Electro-technical Standardisation, and the American National Standards Institute/Building Industry Consulting Services International (ANSI/BICSI) have established guidelines for how data centres must use electricity. As a result, the majority of vendors prefer to consume power in accordance with the needs of data centres, which has hampered the growth of the data centre power market. The accreditation process for new market entrants is challenging while adhering to these requirements.
Covid-19 Impact
The spread of the COVID-19 (coronavirus) has resulted in mass production shutdowns and problems along the supply chain across a number of industry sectors, particularly in China where the virus originated, but wider disruptions are now being felt as other jurisdictions take action to contain or delay the spread of the virus. Due to the shortage of labour in these nations as a result of restrictions put in place by governments to stem the spread of COVID-19 in the early stages of the crisis, the market share of remote power panels was negatively impacted. Nevertheless, the pandemic had little effect on the electricity industry, which supported the ongoing need for ECPs.
The floor-standing segment is expected to be the largest during the forecast period
The floor-standing segment is estimated to have a lucrative growth. Installation options for floor-standing remote power panels include freestanding or bolted-down options. They can hold more circuit breakers and other electrical components than wall-mounted panels since they are often larger and more durable. Their segmental expansion is boosted by their high power capacity, improved durability, and flexible installation advantages.
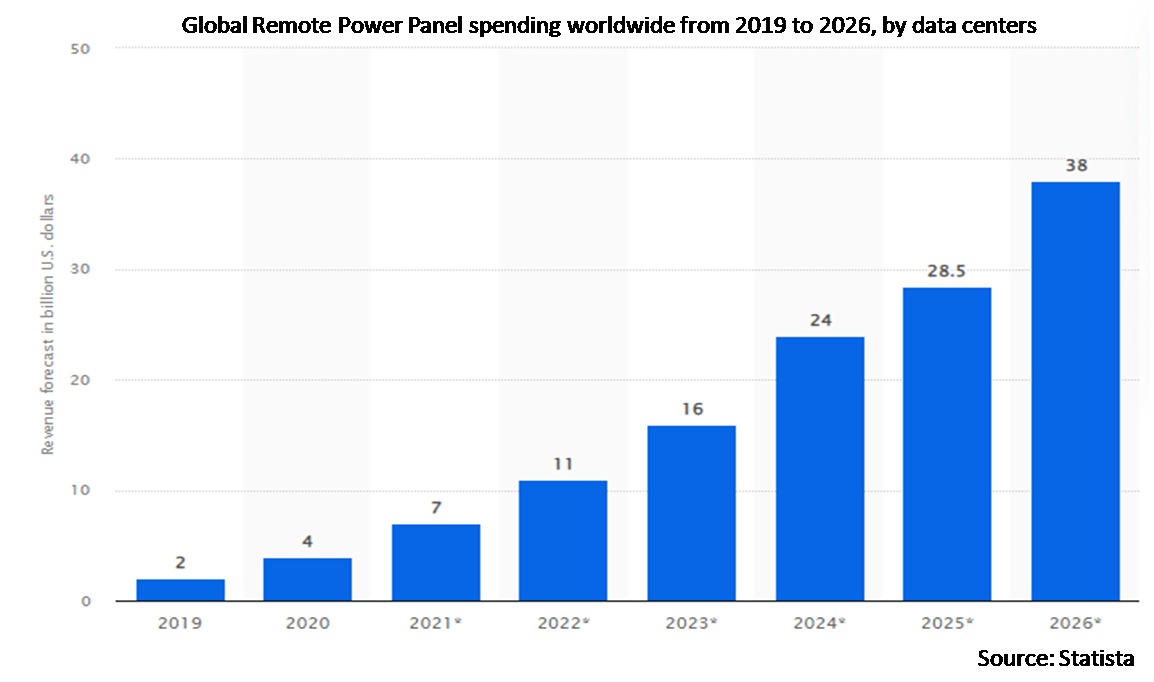
The data centres segment is expected to have the highest CAGR during the forecast period
The data centres segment is anticipated to witness the fastest CAGR growth during the forecast period. Over the past few years, data centres have changed from being privately owned, strictly regulated on-premises facilities housing traditional IT infrastructure for the sole use of one company to remote facilities or networks of facilities owned by cloud service providers housing virtualized IT infrastructure for the shared use of numerous companies and customers.
Region with highest share:
North America is projected to hold the largest market share during the forecast period owing to new innovations and rising trends are continually appearing in the North American data centre market. The demand for efficient power distribution is driving the market for remote power panels, along with other major trends like the rise of hyper scale, edge computing, and modular data centres.
Region with highest CAGR:
Asia Pacific is projected to have the highest CAGR over the forecast period, owing to rapid industrialization is taking place in these countries, and all industrial operations are moving online. Investments in data centres are soaring in the area as privatisation of the industrial sector rises.

Key players in the market
Some of the key players profiled in the Remote Power Panel Market include Eaton, Toshiba International Corporation, ABB, Universal Power and Cooling, Allied Power and Control, Delta Group, Raptor Power Systems, Anord Mardix, Vertiv Group Corporation, Layerzero Power Systems, Inc., Hanley Energy, C&C Power, Inc., The Ea Group, Schneider Electric, Jiangsu Acrel Electrical Manufacturing Co. Ltd., Lutron Electronics Co. Inc, United Engineering Company, Inc., Socomec and Lyntec.
Key Developments:
In January 2023, Schneider Electric acquired AVEVA, a provider of industrial software solutions. The acquisition will enable both companies to digitally transform customers’ operations and drive improvements through a reduction in energy, carbon, and resource intensity, encouraging customers to achieve their goals regarding efficiency and sustainability.
In September 2021, ABB reached an agreement to sell the Power Conversion division to AcBel Polytech Inc. The transaction is subject to regulatory approvals and is expected to be completed in the second half of 2023. This segment offers power solutions for telecommunication, data center, and industrial applications. Upon closing, ABB expects to record a small non-operational book gain in income from operations on the sale.
In August 2020, Schneider Electric launched the Galaxy RPP. Galaxy RPP products are highly configurable and modular. It also offers anytime, anywhere monitoring and service support via cellphone. They are easy to install and maintain due to their compact design. The products compleiments all 75– 500 kVA PDUs.
Types Covered:
• Floor-Standing
• Wall-Mounted
• Other Types
Applications Covered:
• Network Cabinets
• Server Rooms
• Data Centers
• Other Applications
Regions Covered:
• North America
o US
o Canada
o Mexico
• Europe
o Germany
o UK
o Italy
o France
o Spain
o Rest of Europe
• Asia Pacific
o Japan
o China
o India
o Australia
o New Zealand
o South Korea
o Rest of Asia Pacific
• South America
o Argentina
o Brazil
o Chile
o Rest of South America
• Middle East & Africa
o Saudi Arabia
o UAE
o Qatar
o South Africa
o Rest of Middle East & Africa
What our report offers:
- Market share assessments for the regional and country-level segments
- Strategic recommendations for the new entrants
- Covers Market data for the years 2020, 2021, 2022, 2025, and 2028
- Market Trends (Drivers, Constraints, Opportunities, Threats, Challenges, Investment Opportunities, and recommendations)
- Strategic recommendations in key business segments based on the market estimations
- Competitive landscaping mapping the key common trends
- Company profiling with detailed strategies, financials, and recent developments
- Supply chain trends mapping the latest technological advancements
Free Customization Offerings:
All the customers of this report will be entitled to receive one of the following free customization options:
• Company Profiling
o Comprehensive profiling of additional market players (up to 3)
o SWOT Analysis of key players (up to 3)
• Regional Segmentation
o Market estimations, Forecasts and CAGR of any prominent country as per the client's interest (Note: Depends on feasibility check)
• Competitive Benchmarking
o Benchmarking of key players based on product portfolio, geographical presence, and strategic alliances
Table of Contents
1 Executive Summary
2 Preface
2.1 Abstract
2.2 Stake Holders
2.3 Research Scope
2.4 Research Methodology
2.4.1 Data Mining
2.4.2 Data Analysis
2.4.3 Data Validation
2.4.4 Research Approach
2.5 Research Sources
2.5.1 Primary Research Sources
2.5.2 Secondary Research Sources
2.5.3 Assumptions
3 Market Trend Analysis
3.1 Introduction
3.2 Drivers
3.3 Restraints
3.4 Opportunities
3.5 Threats
3.6 Application Analysis
3.7 Emerging Markets
3.8 Impact of Covid-19
4 Porters Five Force Analysis
4.1 Bargaining power of suppliers
4.2 Bargaining power of buyers
4.3 Threat of substitutes
4.4 Threat of new entrants
4.5 Competitive rivalry
5 Global Remote Power Panel Market, By Type
5.1 Introduction
5.2 Floor-Standing
5.3 Wall-Mounted
5.4 Other Types
6 Global Remote Power Panel Market, By Application
6.1 Introduction
6.2 Network Cabinets
6.3 Server Rooms
6.4 Data Centers
6.4.1 Cloud
6.4.2 Enterprise
6.5 Other Applications
7 Global Remote Power Panel Market, By Geography
7.1 Introduction
7.2 North America
7.2.1 US
7.2.2 Canada
7.2.3 Mexico
7.3 Europe
7.3.1 Germany
7.3.2 UK
7.3.3 Italy
7.3.4 France
7.3.5 Spain
7.3.6 Rest of Europe
7.4 Asia Pacific
7.4.1 Japan
7.4.2 China
7.4.3 India
7.4.4 Australia
7.4.5 New Zealand
7.4.6 South Korea
7.4.7 Rest of Asia Pacific
7.5 South America
7.5.1 Argentina
7.5.2 Brazil
7.5.3 Chile
7.5.4 Rest of South America
7.6 Middle East & Africa
7.6.1 Saudi Arabia
7.6.2 UAE
7.6.3 Qatar
7.6.4 South Africa
7.6.5 Rest of Middle East & Africa
8 Key Developments
8.1 Agreements, Partnerships, Collaborations and Joint Ventures
8.2 Acquisitions & Mergers
8.3 New Product Launch
8.4 Expansions
8.5 Other Key Strategies
9 Company Profiling
9.1 Eaton
9.2 Toshiba International Corporation
9.3 ABB
9.4 Universal Power and Cooling
9.5 Allied Power and Control
9.6 Delta Group
9.7 Raptor Power Systems
9.8 Anord Mardix
9.9 Vertiv Group Corporation
9.10 Layerzero Power Systems, Inc.
9.11 Hanley Energy
9.12 C&C Power, Inc.
9.13 The Ea Group
9.14 Schneider Electric
9.15 Jiangsu Acrel Electrical Manufacturing Co. Ltd.
9.16 Lutron Electronics Co. Inc.
9.17 United Engineering Company, Inc.
9.18 Socomec
9.19 Lyntec
List of Tables
1 Global Remote Power Panel Market Outlook, By Region (2020-2028) ($MN)
2 Global Remote Power Panel Market Outlook, By Type (2020-2028) ($MN)
3 Global Remote Power Panel Market Outlook, By Floor-Standing (2020-2028) ($MN)
4 Global Remote Power Panel Market Outlook, By Wall-Mounted (2020-2028) ($MN)
5 Global Remote Power Panel Market Outlook, By Other Types (2020-2028) ($MN)
6 Global Remote Power Panel Market Outlook, By Application (2020-2028) ($MN)
7 Global Remote Power Panel Market Outlook, By Network Cabinets (2020-2028) ($MN)
8 Global Remote Power Panel Market Outlook, By Server Rooms (2020-2028) ($MN)
9 Global Remote Power Panel Market Outlook, By Data Centers (2020-2028) ($MN)
10 Global Remote Power Panel Market Outlook, By Cloud (2020-2028) ($MN)
11 Global Remote Power Panel Market Outlook, By Enterprise (2020-2028) ($MN)
12 Global Remote Power Panel Market Outlook, By Other Applications (2020-2028) ($MN)
13 North America Remote Power Panel Market Outlook, By Country (2020-2028) ($MN)
14 North America Remote Power Panel Market Outlook, By Type (2020-2028) ($MN)
15 North America Remote Power Panel Market Outlook, By Floor-Standing (2020-2028) ($MN)
16 North America Remote Power Panel Market Outlook, By Wall-Mounted (2020-2028) ($MN)
17 North America Remote Power Panel Market Outlook, By Other Types (2020-2028) ($MN)
18 North America Remote Power Panel Market Outlook, By Application (2020-2028) ($MN)
19 North America Remote Power Panel Market Outlook, By Network Cabinets (2020-2028) ($MN)
20 North America Remote Power Panel Market Outlook, By Server Rooms (2020-2028) ($MN)
21 North America Remote Power Panel Market Outlook, By Data Centers (2020-2028) ($MN)
22 North America Remote Power Panel Market Outlook, By Cloud (2020-2028) ($MN)
23 North America Remote Power Panel Market Outlook, By Enterprise (2020-2028) ($MN)
24 North America Remote Power Panel Market Outlook, By Other Applications (2020-2028) ($MN)
25 Europe Remote Power Panel Market Outlook, By Country (2020-2028) ($MN)
26 Europe Remote Power Panel Market Outlook, By Type (2020-2028) ($MN)
27 Europe Remote Power Panel Market Outlook, By Floor-Standing (2020-2028) ($MN)
28 Europe Remote Power Panel Market Outlook, By Wall-Mounted (2020-2028) ($MN)
29 Europe Remote Power Panel Market Outlook, By Other Types (2020-2028) ($MN)
30 Europe Remote Power Panel Market Outlook, By Application (2020-2028) ($MN)
31 Europe Remote Power Panel Market Outlook, By Network Cabinets (2020-2028) ($MN)
32 Europe Remote Power Panel Market Outlook, By Server Rooms (2020-2028) ($MN)
33 Europe Remote Power Panel Market Outlook, By Data Centers (2020-2028) ($MN)
34 Europe Remote Power Panel Market Outlook, By Cloud (2020-2028) ($MN)
35 Europe Remote Power Panel Market Outlook, By Enterprise (2020-2028) ($MN)
36 Europe Remote Power Panel Market Outlook, By Other Applications (2020-2028) ($MN)
37 Asia Pacific Remote Power Panel Market Outlook, By Country (2020-2028) ($MN)
38 Asia Pacific Remote Power Panel Market Outlook, By Type (2020-2028) ($MN)
39 Asia Pacific Remote Power Panel Market Outlook, By Floor-Standing (2020-2028) ($MN)
40 Asia Pacific Remote Power Panel Market Outlook, By Wall-Mounted (2020-2028) ($MN)
41 Asia Pacific Remote Power Panel Market Outlook, By Other Types (2020-2028) ($MN)
42 Asia Pacific Remote Power Panel Market Outlook, By Application (2020-2028) ($MN)
43 Asia Pacific Remote Power Panel Market Outlook, By Network Cabinets (2020-2028) ($MN)
44 Asia Pacific Remote Power Panel Market Outlook, By Server Rooms (2020-2028) ($MN)
45 Asia Pacific Remote Power Panel Market Outlook, By Data Centers (2020-2028) ($MN)
46 Asia Pacific Remote Power Panel Market Outlook, By Cloud (2020-2028) ($MN)
47 Asia Pacific Remote Power Panel Market Outlook, By Enterprise (2020-2028) ($MN)
48 Asia Pacific Remote Power Panel Market Outlook, By Other Applications (2020-2028) ($MN)
49 South America Remote Power Panel Market Outlook, By Country (2020-2028) ($MN)
50 South America Remote Power Panel Market Outlook, By Type (2020-2028) ($MN)
51 South America Remote Power Panel Market Outlook, By Floor-Standing (2020-2028) ($MN)
52 South America Remote Power Panel Market Outlook, By Wall-Mounted (2020-2028) ($MN)
53 South America Remote Power Panel Market Outlook, By Other Types (2020-2028) ($MN)
54 South America Remote Power Panel Market Outlook, By Application (2020-2028) ($MN)
55 South America Remote Power Panel Market Outlook, By Network Cabinets (2020-2028) ($MN)
56 South America Remote Power Panel Market Outlook, By Server Rooms (2020-2028) ($MN)
57 South America Remote Power Panel Market Outlook, By Data Centers (2020-2028) ($MN)
58 South America Remote Power Panel Market Outlook, By Cloud (2020-2028) ($MN)
59 South America Remote Power Panel Market Outlook, By Enterprise (2020-2028) ($MN)
60 South America Remote Power Panel Market Outlook, By Other Applications (2020-2028) ($MN)
61 Middle East & Africa Remote Power Panel Market Outlook, By Country (2020-2028) ($MN)
62 Middle East & Africa Remote Power Panel Market Outlook, By Type (2020-2028) ($MN)
63 Middle East & Africa Remote Power Panel Market Outlook, By Floor-Standing (2020-2028) ($MN)
64 Middle East & Africa Remote Power Panel Market Outlook, By Wall-Mounted (2020-2028) ($MN)
65 Middle East & Africa Remote Power Panel Market Outlook, By Other Types (2020-2028) ($MN)
66 Middle East & Africa Remote Power Panel Market Outlook, By Application (2020-2028) ($MN)
67 Middle East & Africa Remote Power Panel Market Outlook, By Network Cabinets (2020-2028) ($MN)
68 Middle East & Africa Remote Power Panel Market Outlook, By Server Rooms (2020-2028) ($MN)
69 Middle East & Africa Remote Power Panel Market Outlook, By Data Centers (2020-2028) ($MN)
70 Middle East & Africa Remote Power Panel Market Outlook, By Cloud (2020-2028) ($MN)
71 Middle East & Africa Remote Power Panel Market Outlook, By Enterprise (2020-2028) ($MN)
72 Middle East & Africa Remote Power Panel Market Outlook, By Other Applications (2020-2028) ($MN)
List of Figures
RESEARCH METHODOLOGY

We at ‘Stratistics’ opt for an extensive research approach which involves data mining, data validation, and data analysis. The various research sources include in-house repository, secondary research, competitor’s sources, social media research, client internal data, and primary research.
Our team of analysts prefers the most reliable and authenticated data sources in order to perform the comprehensive literature search. With access to most of the authenticated data bases our team highly considers the best mix of information through various sources to obtain extensive and accurate analysis.
Each report takes an average time of a month and a team of 4 industry analysts. The time may vary depending on the scope and data availability of the desired market report. The various parameters used in the market assessment are standardized in order to enhance the data accuracy.
Data Mining
The data is collected from several authenticated, reliable, paid and unpaid sources and is filtered depending on the scope & objective of the research. Our reports repository acts as an added advantage in this procedure. Data gathering from the raw material suppliers, distributors and the manufacturers is performed on a regular basis, this helps in the comprehensive understanding of the products value chain. Apart from the above mentioned sources the data is also collected from the industry consultants to ensure the objective of the study is in the right direction.
Market trends such as technological advancements, regulatory affairs, market dynamics (Drivers, Restraints, Opportunities and Challenges) are obtained from scientific journals, market related national & international associations and organizations.
Data Analysis
From the data that is collected depending on the scope & objective of the research the data is subjected for the analysis. The critical steps that we follow for the data analysis include:
- Product Lifecycle Analysis
- Competitor analysis
- Risk analysis
- Porters Analysis
- PESTEL Analysis
- SWOT Analysis
The data engineering is performed by the core industry experts considering both the Marketing Mix Modeling and the Demand Forecasting. The marketing mix modeling makes use of multiple-regression techniques to predict the optimal mix of marketing variables. Regression factor is based on a number of variables and how they relate to an outcome such as sales or profits.
Data Validation
The data validation is performed by the exhaustive primary research from the expert interviews. This includes telephonic interviews, focus groups, face to face interviews, and questionnaires to validate our research from all aspects. The industry experts we approach come from the leading firms, involved in the supply chain ranging from the suppliers, distributors to the manufacturers and consumers so as to ensure an unbiased analysis.
We are in touch with more than 15,000 industry experts with the right mix of consultants, CEO's, presidents, vice presidents, managers, experts from both supply side and demand side, executives and so on.
The data validation involves the primary research from the industry experts belonging to:
- Leading Companies
- Suppliers & Distributors
- Manufacturers
- Consumers
- Industry/Strategic Consultants
Apart from the data validation the primary research also helps in performing the fill gap research, i.e. providing solutions for the unmet needs of the research which helps in enhancing the reports quality.
For more details about research methodology, kindly write to us at info@strategymrc.com
Frequently Asked Questions
In case of any queries regarding this report, you can contact the customer service by filing the “Inquiry Before Buy” form available on the right hand side. You may also contact us through email: info@strategymrc.com or phone: +1-301-202-5929
Yes, the samples are available for all the published reports. You can request them by filling the “Request Sample” option available in this page.
Yes, you can request a sample with your specific requirements. All the customized samples will be provided as per the requirement with the real data masked.
All our reports are available in Digital PDF format. In case if you require them in any other formats, such as PPT, Excel etc you can submit a request through “Inquiry Before Buy” form available on the right hand side. You may also contact us through email: info@strategymrc.com or phone: +1-301-202-5929
We offer a free 15% customization with every purchase. This requirement can be fulfilled for both pre and post sale. You may send your customization requirements through email at info@strategymrc.com or call us on +1-301-202-5929.
We have 3 different licensing options available in electronic format.
- Single User Licence: Allows one person, typically the buyer, to have access to the ordered product. The ordered product cannot be distributed to anyone else.
- 2-5 User Licence: Allows the ordered product to be shared among a maximum of 5 people within your organisation.
- Corporate License: Allows the product to be shared among all employees of your organisation regardless of their geographical location.
All our reports are typically be emailed to you as an attachment.
To order any available report you need to register on our website. The payment can be made either through CCAvenue or PayPal payments gateways which accept all international cards.
We extend our support to 6 months post sale. A post sale customization is also provided to cover your unmet needs in the report.
Request Customization
We offer complimentary customization of up to 15% with every purchase. To share your customization requirements, feel free to email us at info@strategymrc.com or call us on +1-301-202-5929. .
Please Note: Customization within the 15% threshold is entirely free of charge. If your request exceeds this limit, we will conduct a feasibility assessment. Following that, a detailed quote and timeline will be provided.
WHY CHOOSE US ?

Assured Quality
Best in class reports with high standard of research integrity

24X7 Research Support
Continuous support to ensure the best customer experience.

Free Customization
Adding more values to your product of interest.

Safe & Secure Access
Providing a secured environment for all online transactions.

Trusted by 600+ Brands
Serving the most reputed brands across the world.