
Renewable Drones Market
Renewable Drones Market Forecasts to 2028 - Global Analysis By Drone Type (Multirotor and Fixed Wing), Solution (End-To-End Solution and Point Solution), End User and Geography

|
Years Covered |
2020-2028 |
|
Estimated Year Value (2022) |
US $72.69 BN |
|
Projected Year Value (2028) |
US $306.46 BN |
|
CAGR (2022 - 2028) |
27.1% |
|
Regions Covered |
North America, Europe, Asia Pacific, South America, and Middle East & Africa |
|
Countries Covered |
US, Canada, Mexico, Germany, UK, Italy, France, Spain, Japan, China, India, Australia, New Zealand, South Korea, Rest of Asia Pacific, South America, Argentina, Brazil, Chile, Middle East & Africa, Saudi Arabia, UAE, Qatar, and South Africa |
|
Largest Market |
Asia Pacific |
|
Highest Growing Market |
Europe |
According to Stratistics MRC, the Global Renewable Drones Market is accounted for $72.69 billion in 2022 and is expected to reach $306.46 billion by 2028 growing at a CAGR of 27.1% during the forecast period. Drones have lately entered the environmental sector, offering renewable energy development and maintenance a bright future. As natural TV shows demonstrate, the tiniest ascending computers may provide us distinctive images of Earth. Drones can map and survey the ground using their imaging capabilities, and they can also find problems with renewable energy systems. They can also generate their own electricity and reduce pollution from package transportation. In order to evaluate potential renewable energy sites, such as solar and wind farms, it is crucial to quantify potential interference and issue identification. Renewable drones are employed in a variety of applications, including surveying and mapping.
According to BP Statistical Review of World Energy, in 2021, the global electricity generation was about 28,466.3 Terawatt-Hour (TWh), up by 6.2% year-on-year and 10.1% since 2017. The increase in electricity generation depicts the worldwide increase in the number of power plants and transmission lines, which are expected to drive the fixed Wing segment of the renewable drone market.
Market Dynamics:
Driver:
Increasing demand for inspection operations
Due to the size of most solar farms, a drone with an adequate thermal camera can scan the entire farm more quickly than using a hand-held thermal camera on the ground. Inspections of wind turbines are carried out manually by climbing or taking long-range photographs. Manual inspections that require climbing present risks that can be avoided with drone inspections. Drone inspections of wind turbines can be completed in around 40 minutes, which makes them a quicker, more cost-effective, and more reliable option than manual inspections.
Restraint:
Strict regulations for drone operations
When undertaking inspection activities, drones are incredibly helpful to utilities. The drone market hasn't advanced much, though, due to legal restrictions. In particular, these restrictions forbid drone operations when they occur at night or when they are out of visible line of sight. Utility firms have not been able to deploy drones to the fullest extent possible for boosting the efficiency and efficacy of inspection operations because the FAA has not kept up with the quickly evolving drone technologies. The use of drones by public power utilities is not explicitly defined as a government activity, and these regulations do not permit users to operate outside the visual line of sight which hampers the market growth.
Opportunity:
Increasing number of solar and wind farms
One of the industries with the most rapid growth is the one for renewable energy. The demand for clean, sustainable energy is driving a rapid development of renewable energy facilities using cutting-edge technology. Countries are reorienting their attention away from traditional energy sources and toward boosting the production of renewable energy sources. Due to this, there will be a demand for both new installations and existing turbine replacements of wind turbines. Since the construction of wind power plants requires a lot of capital, asset owners seek to maximise profits while minimising costs are creating wide range of opportunities of the market growth.
Threat:
Lack of skilled personnel
Commercial drones must be remotely piloted and operated in a variety of weather and terrain conditions, which requires a qualified drone pilot. Midflight control issues are the cause of numerous accidents. To lower the risk of accidents, efforts are made to increase the effectiveness of autonomous drone solutions. Personnel that are knowledgeable about the program and the technical aspects of the facilities being examined are also needed to further analyze the inspection data. Numerous initiatives are being made to train personnel to improve drone operation.
Covid-19 Impact
In addition to spreading throughout metropolitan areas, COVID-19 has also infiltrated rural areas, changing the agricultural industry. Due to this development, more businesses and entrepreneurs are finding a need for renewable drones to monitor and track lands safely at their leisure. The improvement in the financial standing of different nations, climate change, and technological innovation are promoting market expansion.
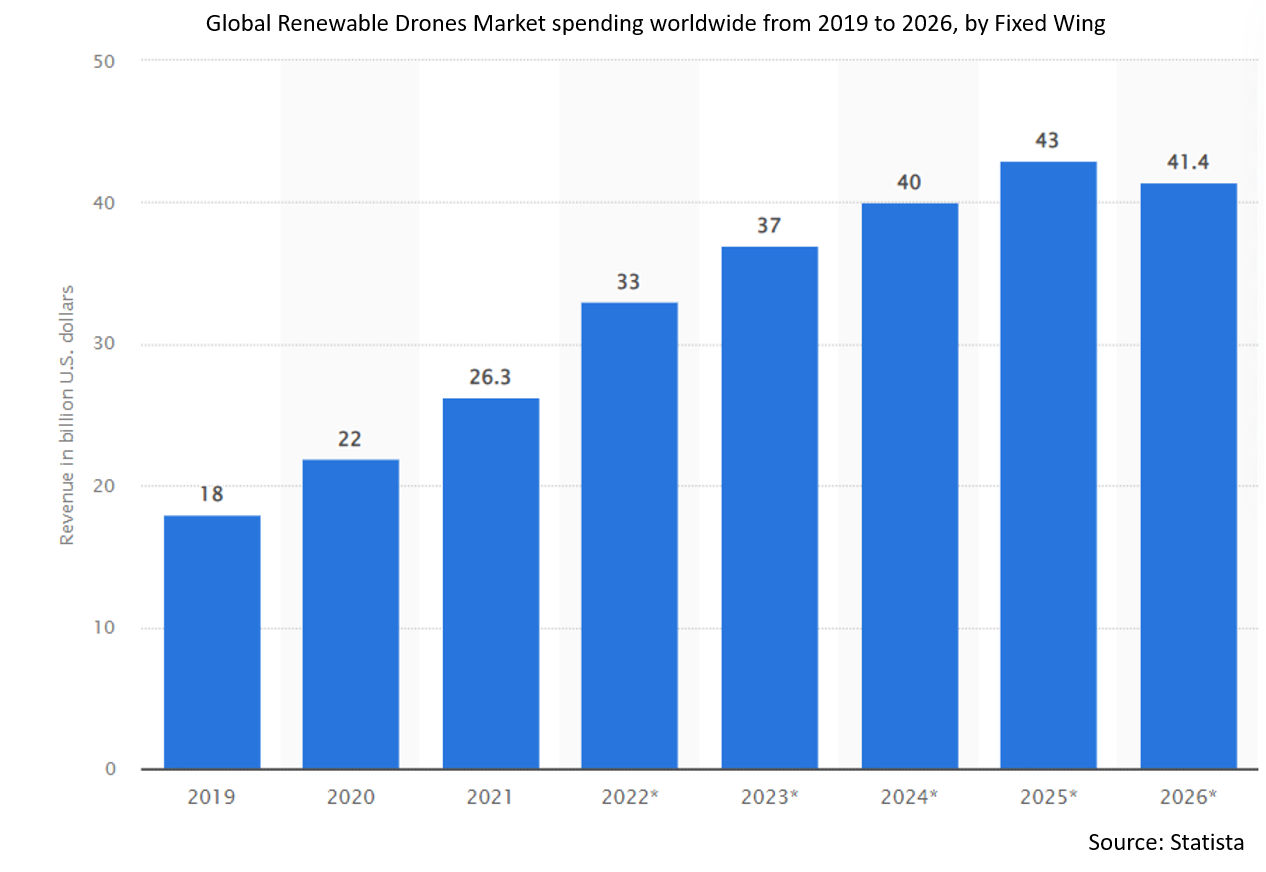
The fixed wing segment is expected to be the largest during the forecast period
The fixed wing segment is estimated to have a lucrative growth, due to its less extent of energy requirement. Fixed-wing aircraft just need the energy necessary to move forward. The aeroplane generates lift passively by cutting through the air at a particular angle with its wings. This means that compared to multi rotors, these systems can fly significantly farther and cover a lot more ground. In addition fixed-wing aircraft have traditionally been the only option for providing extensive coverage with respectable data quality, resolution, and accuracy options which are propelling the market growth.
The solar segment is expected to have the highest CAGR during the forecast period
The solar segment is anticipated to witness the fastest CAGR growth during the forecast period, due to the unmanned aerial vehicles were equipped with photovoltaic (PV) panels, which allowed the researchers to generate power continuously when the sun was out. Various sectors and geographical areas use PV panels to reliably power drones. They also get rid of the shipping and transportation-related pollutants that fight climate change. There are many ways that society can employ solar drones to boost efficiency and safety.
Region with largest share:
Asia Pacific is projected to hold the largest market share during the forecast period owing to due to the increase in urbanisation, industrialization, and population expansion in the China, India, Japan, Australia, and the rest of Asia Pacific. The need for power would rise as a result of the economy's rapid expansion. This would call for bigger investments in the infrastructure for producing renewable energy. The dramatic decline in solar panel prices is anticipated to result in more investment in the region.
Region with highest CAGR:
Europe is projected to have the highest CAGR over the forecast period, owing to rising adaptation of renewable energy in Norway and Germany. Moreover due to the determinants such as government initiatives towards green energy, jump in greenhouse gas emissions by industries and demand in energy consumption, this growth is mainly attributed to the tax incentives & favourable policies for solar energy and growing demand from various end-use industries which are driving the market growth.

Key players in the market
Some of the key players profiled in the Renewable Drones Market include ABJ Renewables, DRONE VOLT, DJI, DroneDeploy, Flyability, Skylark Drone, Parrot Group, ABJ Drones, Aerodyne Measure Inc, Terra Drone Corporation, AIRPIX, Sitemark, Cyberhawk Innovations Limited, ULC Robotics, Sharper Shape Inc, Sky Futures, Asset Drone and Siemens Gamesa.
Key Developments:
In June 2020, Siemens gamesa won a contract from trianel windkraftwerk borkum for 5 years full scope offshore service and maintenance of trianel windpark borkum, the installation of the 32 senvion 6.33 MW turbines. TWB II has total output capacity of 200MW and produces clean energy for around 200,000 households per year.
In June 2020, Terra Drone opened a new base named Terra Drone Technology Malaysia Sdn Bhd in kuala Lumpur Malaysia. TDMY will be providing drone survey, inspection and industrial services for multiple industries such as oil & gas, telecommunications, power, construction, agriculture and government agencies.
In Dec 2019, Aerodyne Group acquired a controlling interest in the service business of measure to create a new, combined business entity named aerodyne measure. Aerodyne measure will serve enterprise clients in North America with aerial inspections and data analysis services. This agreement also provides measure with additional funding as it grows its stand alone SaaS offering and measure ground control, an end to end software solution for enterprise drone programs.
In Feb 2019, Terra Drone entered the Indian market with the establishment of terra drone india. Terra drone areas of specialization include agriculture, energy, urban development and management, defence, water, security, mining, infrastructure, forest, utilities and disaster management. Its customer centric industrial drone solutions use a multitude of sensors such as visual, multispectral, thermal and hyderspectral and to help clients plan, collect, and process the data.
Drone Types Covered:
• Multirotor
• Fixed Wing
Solutions Covered:
• End-To-End Solution
• Point Solution
End Users Covered:
• Solar
• Wind
Regions Covered:
• North America
o US
o Canada
o Mexico
• Europe
o Germany
o UK
o Italy
o France
o Spain
o Rest of Europe
• Asia Pacific
o Japan
o China
o India
o Australia
o New Zealand
o South Korea
o Rest of Asia Pacific
• South America
o Argentina
o Brazil
o Chile
o Rest of South America
• Middle East & Africa
o Saudi Arabia
o UAE
o Qatar
o South Africa
o Rest of Middle East & Africa
What our report offers:
- Market share assessments for the regional and country-level segments
- Strategic recommendations for the new entrants
- Covers Market data for the years 2020, 2021, 2022, 2025, and 2028
- Market Trends (Drivers, Constraints, Opportunities, Threats, Challenges, Investment Opportunities, and recommendations)
- Strategic recommendations in key business segments based on the market estimations
- Competitive landscaping mapping the key common trends
- Company profiling with detailed strategies, financials, and recent developments
- Supply chain trends mapping the latest technological advancements
Free Customization Offerings:
All the customers of this report will be entitled to receive one of the following free customization options:
• Company Profiling
o Comprehensive profiling of additional market players (up to 3)
o SWOT Analysis of key players (up to 3)
• Regional Segmentation
o Market estimations, Forecasts and CAGR of any prominent country as per the client's interest (Note: Depends on feasibility check)
• Competitive Benchmarking
o Benchmarking of key players based on product portfolio, geographical presence, and strategic alliances
Table of Contents
1 Executive Summary
2 Preface
2.1 Abstract
2.2 Stake Holders
2.3 Research Scope
2.4 Research Methodology
2.4.1 Data Mining
2.4.2 Data Analysis
2.4.3 Data Validation
2.4.4 Research Approach
2.5 Research Sources
2.5.1 Primary Research Sources
2.5.2 Secondary Research Sources
2.5.3 Assumptions
3 Market Trend Analysis
3.1 Introduction
3.2 Drivers
3.3 Restraints
3.4 Opportunities
3.5 Threats
3.6 End User Analysis
3.7 Emerging Markets
3.8 Impact of Covid-19
4 Porters Five Force Analysis
4.1 Bargaining power of suppliers
4.2 Bargaining power of buyers
4.3 Threat of substitutes
4.4 Threat of new entrants
4.5 Competitive rivalry
5 Global Renewable Drones Market, By Drone Type
5.1 Introduction
5.2 Multirotor
5.3 Fixed Wing
6 Global Renewable Drones Market, By Solution
6.1 Introduction
6.2 End-To-End Solution
6.3 Point Solution
7 Global Renewable Drones Market, By End User
7.1 Introduction
7.2 Solar
7.2.1 Solar PV
7.2.2 Solar CSP
7.3 Wind
8 Global Renewable Drones Market, By Geography
8.1 Introduction
8.2 North America
8.2.1 US
8.2.2 Canada
8.2.3 Mexico
8.3 Europe
8.3.1 Germany
8.3.2 UK
8.3.3 Italy
8.3.4 France
8.3.5 Spain
8.3.6 Rest of Europe
8.4 Asia Pacific
8.4.1 Japan
8.4.2 China
8.4.3 India
8.4.4 Australia
8.4.5 New Zealand
8.4.6 South Korea
8.4.7 Rest of Asia Pacific
8.5 South America
8.5.1 Argentina
8.5.2 Brazil
8.5.3 Chile
8.5.4 Rest of South America
8.6 Middle East & Africa
8.6.1 Saudi Arabia
8.6.2 UAE
8.6.3 Qatar
8.6.4 South Africa
8.6.5 Rest of Middle East & Africa
9 Key Developments
9.1 Agreements, Partnerships, Collaborations and Joint Ventures
9.2 Acquisitions & Mergers
9.3 New Product Launch
9.4 Expansions
9.5 Other Key Strategies
10 Company Profiling
10.1 ABJ Renewables
10.2 DRONE VOLT
10.3 DJI
10.4 DroneDeploy
10.5 Flyability
10.6 Skylark Drone
10.7 Parrot Group
10.8 ABJ Drones
10.9 Aerodyne Measure Inc
10.10 Terra Drone Corporation
10.11 AIRPIX
10.12 Sitemark
10.13 Cyberhawk Innovations Limited
10.14 ULC Robotics
10.15 Sharper Shape Inc.
10.16 Sky Futures
10.17 Asset Drone
List of Tables
1 Global Renewable Drones Market Outlook, By Region (2020-2028) ($MN)
2 Global Renewable Drones Market Outlook, By Drone Type (2020-2028) ($MN)
3 Global Renewable Drones Market Outlook, By Multirotor (2020-2028) ($MN)
4 Global Renewable Drones Market Outlook, By Fixed Wing (2020-2028) ($MN)
5 Global Renewable Drones Market Outlook, By Solution (2020-2028) ($MN)
6 Global Renewable Drones Market Outlook, By End-To-End Solution (2020-2028) ($MN)
7 Global Renewable Drones Market Outlook, By Point Solution (2020-2028) ($MN)
8 Global Renewable Drones Market Outlook, By End User (2020-2028) ($MN)
9 Global Renewable Drones Market Outlook, By Solar (2020-2028) ($MN)
10 Global Renewable Drones Market Outlook, By Solar PV (2020-2028) ($MN)
11 Global Renewable Drones Market Outlook, By Solar CSP (2020-2028) ($MN)
12 Global Renewable Drones Market Outlook, By Wind (2020-2028) ($MN)
13 North America Renewable Drones Market Outlook, By Country (2020-2028) ($MN)
14 North America Renewable Drones Market Outlook, By Drone Type (2020-2028) ($MN)
15 North America Renewable Drones Market Outlook, By Multirotor (2020-2028) ($MN)
16 North America Renewable Drones Market Outlook, By Fixed Wing (2020-2028) ($MN)
17 North America Renewable Drones Market Outlook, By Solution (2020-2028) ($MN)
18 North America Renewable Drones Market Outlook, By End-To-End Solution (2020-2028) ($MN)
19 North America Renewable Drones Market Outlook, By Point Solution (2020-2028) ($MN)
20 North America Renewable Drones Market Outlook, By End User (2020-2028) ($MN)
21 North America Renewable Drones Market Outlook, By Solar (2020-2028) ($MN)
22 North America Renewable Drones Market Outlook, By Solar PV (2020-2028) ($MN)
23 North America Renewable Drones Market Outlook, By Solar CSP (2020-2028) ($MN)
24 North America Renewable Drones Market Outlook, By Wind (2020-2028) ($MN)
25 Europe Renewable Drones Market Outlook, By Country (2020-2028) ($MN)
26 Europe Renewable Drones Market Outlook, By Drone Type (2020-2028) ($MN)
27 Europe Renewable Drones Market Outlook, By Multirotor (2020-2028) ($MN)
28 Europe Renewable Drones Market Outlook, By Fixed Wing (2020-2028) ($MN)
29 Europe Renewable Drones Market Outlook, By Solution (2020-2028) ($MN)
30 Europe Renewable Drones Market Outlook, By End-To-End Solution (2020-2028) ($MN)
31 Europe Renewable Drones Market Outlook, By Point Solution (2020-2028) ($MN)
32 Europe Renewable Drones Market Outlook, By End User (2020-2028) ($MN)
33 Europe Renewable Drones Market Outlook, By Solar (2020-2028) ($MN)
34 Europe Renewable Drones Market Outlook, By Solar PV (2020-2028) ($MN)
35 Europe Renewable Drones Market Outlook, By Solar CSP (2020-2028) ($MN)
36 Europe Renewable Drones Market Outlook, By Wind (2020-2028) ($MN)
37 Asia Pacific Renewable Drones Market Outlook, By Country (2020-2028) ($MN)
38 Asia Pacific Renewable Drones Market Outlook, By Drone Type (2020-2028) ($MN)
39 Asia Pacific Renewable Drones Market Outlook, By Multirotor (2020-2028) ($MN)
40 Asia Pacific Renewable Drones Market Outlook, By Fixed Wing (2020-2028) ($MN)
41 Asia Pacific Renewable Drones Market Outlook, By Solution (2020-2028) ($MN)
42 Asia Pacific Renewable Drones Market Outlook, By End-To-End Solution (2020-2028) ($MN)
43 Asia Pacific Renewable Drones Market Outlook, By Point Solution (2020-2028) ($MN)
44 Asia Pacific Renewable Drones Market Outlook, By End User (2020-2028) ($MN)
45 Asia Pacific Renewable Drones Market Outlook, By Solar (2020-2028) ($MN)
46 Asia Pacific Renewable Drones Market Outlook, By Solar PV (2020-2028) ($MN)
47 Asia Pacific Renewable Drones Market Outlook, By Solar CSP (2020-2028) ($MN)
48 Asia Pacific Renewable Drones Market Outlook, By Wind (2020-2028) ($MN)
49 South America Renewable Drones Market Outlook, By Country (2020-2028) ($MN)
50 South America Renewable Drones Market Outlook, By Drone Type (2020-2028) ($MN)
51 South America Renewable Drones Market Outlook, By Multirotor (2020-2028) ($MN)
52 South America Renewable Drones Market Outlook, By Fixed Wing (2020-2028) ($MN)
53 South America Renewable Drones Market Outlook, By Solution (2020-2028) ($MN)
54 South America Renewable Drones Market Outlook, By End-To-End Solution (2020-2028) ($MN)
55 South America Renewable Drones Market Outlook, By Point Solution (2020-2028) ($MN)
56 South America Renewable Drones Market Outlook, By End User (2020-2028) ($MN)
57 South America Renewable Drones Market Outlook, By Solar (2020-2028) ($MN)
58 South America Renewable Drones Market Outlook, By Solar PV (2020-2028) ($MN)
59 South America Renewable Drones Market Outlook, By Solar CSP (2020-2028) ($MN)
60 South America Renewable Drones Market Outlook, By Wind (2020-2028) ($MN)
61 Middle East & Africa Renewable Drones Market Outlook, By Country (2020-2028) ($MN)
62 Middle East & Africa Renewable Drones Market Outlook, By Drone Type (2020-2028) ($MN)
63 Middle East & Africa Renewable Drones Market Outlook, By Multirotor (2020-2028) ($MN)
64 Middle East & Africa Renewable Drones Market Outlook, By Fixed Wing (2020-2028) ($MN)
65 Middle East & Africa Renewable Drones Market Outlook, By Solution (2020-2028) ($MN)
66 Middle East & Africa Renewable Drones Market Outlook, By End-To-End Solution (2020-2028) ($MN)
67 Middle East & Africa Renewable Drones Market Outlook, By Point Solution (2020-2028) ($MN)
68 Middle East & Africa Renewable Drones Market Outlook, By End User (2020-2028) ($MN)
69 Middle East & Africa Renewable Drones Market Outlook, By Solar (2020-2028) ($MN)
70 Middle East & Africa Renewable Drones Market Outlook, By Solar PV (2020-2028) ($MN)
71 Middle East & Africa Renewable Drones Market Outlook, By Solar CSP (2020-2028) ($MN)
72 Middle East & Africa Renewable Drones Market Outlook, By Wind (2020-2028) ($MN)
List of Figures
RESEARCH METHODOLOGY

We at ‘Stratistics’ opt for an extensive research approach which involves data mining, data validation, and data analysis. The various research sources include in-house repository, secondary research, competitor’s sources, social media research, client internal data, and primary research.
Our team of analysts prefers the most reliable and authenticated data sources in order to perform the comprehensive literature search. With access to most of the authenticated data bases our team highly considers the best mix of information through various sources to obtain extensive and accurate analysis.
Each report takes an average time of a month and a team of 4 industry analysts. The time may vary depending on the scope and data availability of the desired market report. The various parameters used in the market assessment are standardized in order to enhance the data accuracy.
Data Mining
The data is collected from several authenticated, reliable, paid and unpaid sources and is filtered depending on the scope & objective of the research. Our reports repository acts as an added advantage in this procedure. Data gathering from the raw material suppliers, distributors and the manufacturers is performed on a regular basis, this helps in the comprehensive understanding of the products value chain. Apart from the above mentioned sources the data is also collected from the industry consultants to ensure the objective of the study is in the right direction.
Market trends such as technological advancements, regulatory affairs, market dynamics (Drivers, Restraints, Opportunities and Challenges) are obtained from scientific journals, market related national & international associations and organizations.
Data Analysis
From the data that is collected depending on the scope & objective of the research the data is subjected for the analysis. The critical steps that we follow for the data analysis include:
- Product Lifecycle Analysis
- Competitor analysis
- Risk analysis
- Porters Analysis
- PESTEL Analysis
- SWOT Analysis
The data engineering is performed by the core industry experts considering both the Marketing Mix Modeling and the Demand Forecasting. The marketing mix modeling makes use of multiple-regression techniques to predict the optimal mix of marketing variables. Regression factor is based on a number of variables and how they relate to an outcome such as sales or profits.
Data Validation
The data validation is performed by the exhaustive primary research from the expert interviews. This includes telephonic interviews, focus groups, face to face interviews, and questionnaires to validate our research from all aspects. The industry experts we approach come from the leading firms, involved in the supply chain ranging from the suppliers, distributors to the manufacturers and consumers so as to ensure an unbiased analysis.
We are in touch with more than 15,000 industry experts with the right mix of consultants, CEO's, presidents, vice presidents, managers, experts from both supply side and demand side, executives and so on.
The data validation involves the primary research from the industry experts belonging to:
- Leading Companies
- Suppliers & Distributors
- Manufacturers
- Consumers
- Industry/Strategic Consultants
Apart from the data validation the primary research also helps in performing the fill gap research, i.e. providing solutions for the unmet needs of the research which helps in enhancing the reports quality.
For more details about research methodology, kindly write to us at info@strategymrc.com
Frequently Asked Questions
In case of any queries regarding this report, you can contact the customer service by filing the “Inquiry Before Buy” form available on the right hand side. You may also contact us through email: info@strategymrc.com or phone: +1-301-202-5929
Yes, the samples are available for all the published reports. You can request them by filling the “Request Sample” option available in this page.
Yes, you can request a sample with your specific requirements. All the customized samples will be provided as per the requirement with the real data masked.
All our reports are available in Digital PDF format. In case if you require them in any other formats, such as PPT, Excel etc you can submit a request through “Inquiry Before Buy” form available on the right hand side. You may also contact us through email: info@strategymrc.com or phone: +1-301-202-5929
We offer a free 15% customization with every purchase. This requirement can be fulfilled for both pre and post sale. You may send your customization requirements through email at info@strategymrc.com or call us on +1-301-202-5929.
We have 3 different licensing options available in electronic format.
- Single User Licence: Allows one person, typically the buyer, to have access to the ordered product. The ordered product cannot be distributed to anyone else.
- 2-5 User Licence: Allows the ordered product to be shared among a maximum of 5 people within your organisation.
- Corporate License: Allows the product to be shared among all employees of your organisation regardless of their geographical location.
All our reports are typically be emailed to you as an attachment.
To order any available report you need to register on our website. The payment can be made either through CCAvenue or PayPal payments gateways which accept all international cards.
We extend our support to 6 months post sale. A post sale customization is also provided to cover your unmet needs in the report.
Request Customization
We offer complimentary customization of up to 15% with every purchase. To share your customization requirements, feel free to email us at info@strategymrc.com or call us on +1-301-202-5929. .
Please Note: Customization within the 15% threshold is entirely free of charge. If your request exceeds this limit, we will conduct a feasibility assessment. Following that, a detailed quote and timeline will be provided.
WHY CHOOSE US ?

Assured Quality
Best in class reports with high standard of research integrity

24X7 Research Support
Continuous support to ensure the best customer experience.

Free Customization
Adding more values to your product of interest.

Safe & Secure Access
Providing a secured environment for all online transactions.

Trusted by 600+ Brands
Serving the most reputed brands across the world.