
Reusable Packaging Systems Market
Reusable Packaging Systems Market Forecasts to 2034 - Global Analysis By Packaging Type (Reusable Containers, Reusable Crates & Pallets, Reusable Totes & Bags and Other Packaging Types), Material, End User and By Geography

|
Years Covered |
2023-2034 |
|
Estimated Year Value (2026) |
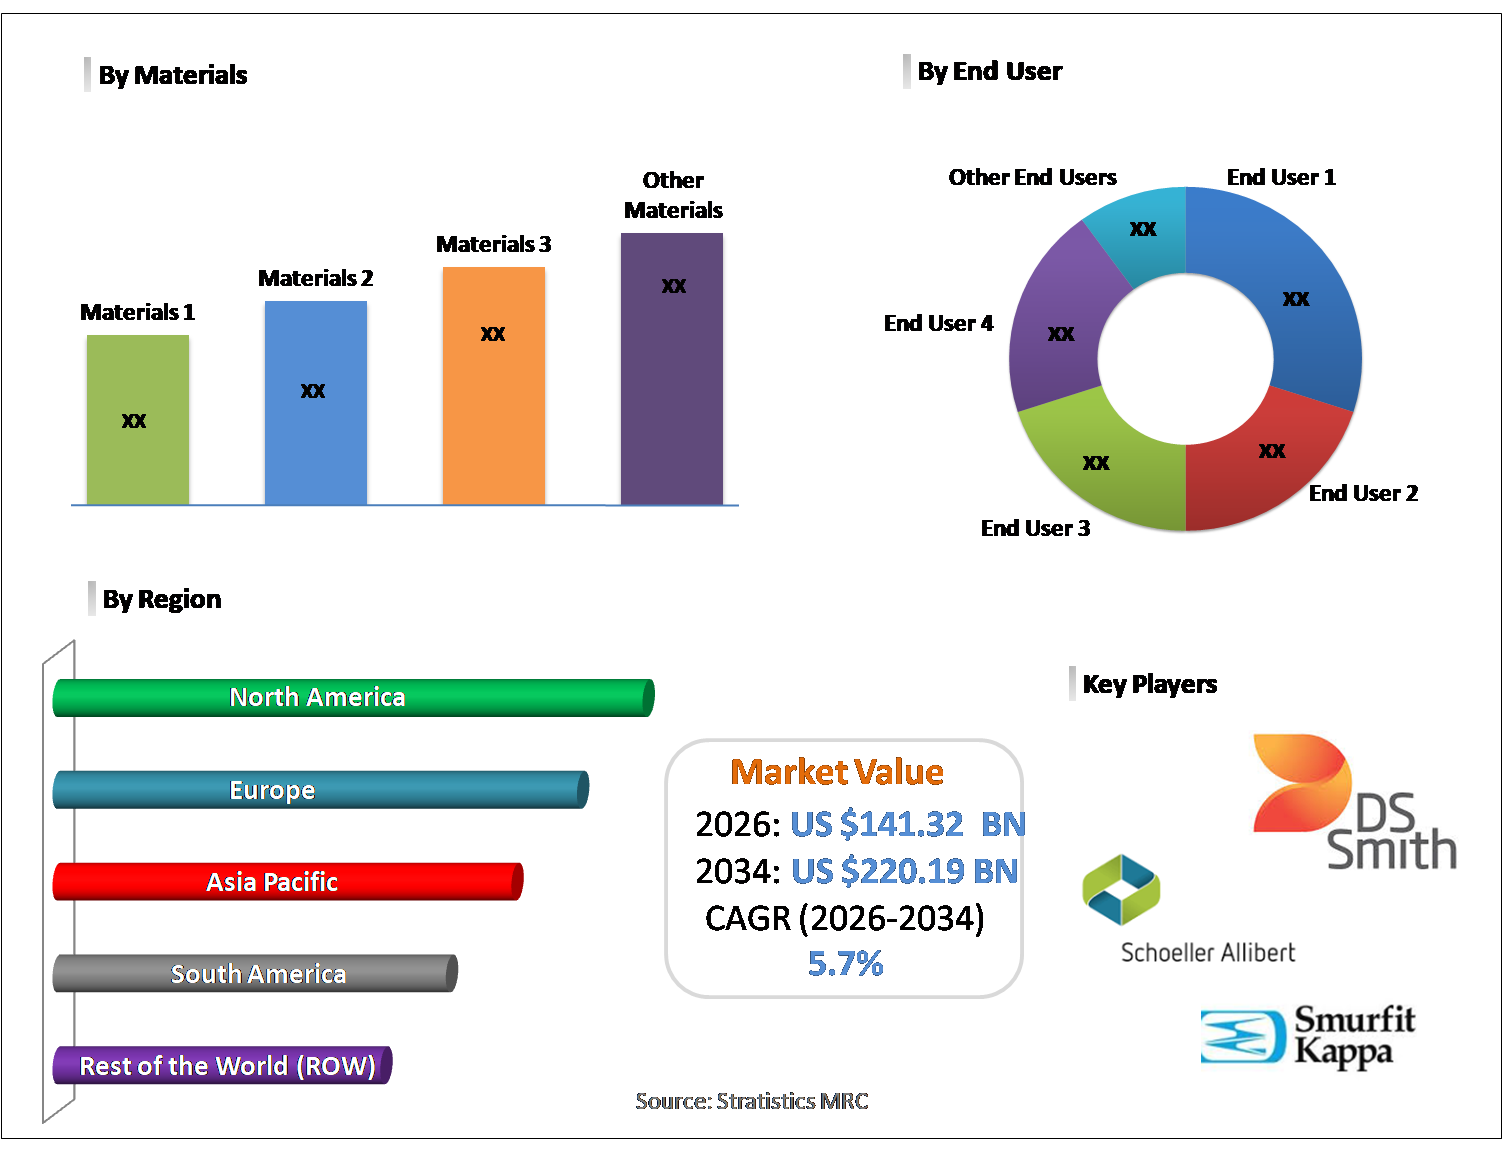
US $141.32 BN |
|
Projected Year Value (2034) |
US $220.19 BN |
|
CAGR (2026-2034) |
5.7% |
|
Regions Covered |
North America, Europe, Asia Pacific, South America, and Rest of the World (RoW) |
|
Countries Covered |
United States, Canada, Mexico, United Kingdom, Germany, France, Italy, Spain, Netherlands, Belgium, Sweden, Switzerland, Poland, Rest of Europe, China, Japan, India, South Korea, Australia, Indonesia, Thailand, Malaysia, Singapore, Vietnam, Rest of Asia Pacific, Brazil, Argentina, Colombia, Chile, Peru, Rest of South America, Saudi Arabia, United Arab Emirates, Qatar, Israel, Rest of Middle East, South Africa, Egypt, Morocco, and Rest of Africa. |
|
Largest Market |
North America |
|
Highest Growing Market |
Asia Pacific |
According to Stratistics MRC, the Global Reusable Packaging Systems Market is accounted for $141.32 billion in 2026 and is expected to reach $220.19 billion by 2034 growing at a CAGR of 5.7% during the forecast period. Reusable packaging systems refer to durable, returnable packaging solutions designed for multiple use cycles within supply chains, reducing single use waste and overall packaging costs. These systems typically include pallets, crates, containers, drums, and intermediate bulk containers made from robust materials such as plastic, metal, or wood. They operate through structured collection, cleaning, and redistribution processes supported by tracking technologies and reverse logistics networks. Widely adopted across automotive, food and beverage, retail, and industrial sectors, reusable packaging systems enhance sustainability, improve asset utilization, and support circular economy objectives while maintaining product protection and transport efficiency.
Market Dynamics:
Driver:
Strong sustainability and circular economy push
The accelerating global emphasis on sustainability and circular economy practices is a primary driver for reusable packaging systems. Governments and corporations are increasingly prioritizing waste reduction and resource efficiency. Reusable solutions help organizations comply with tightening environmental regulations while advancing ESG goals. Moreover, large retailers and manufacturers are integrating returnable packaging into their supply chains to reduce single use materials. This structural shift toward closed loop logistics continues to strengthen long term demand for durable, multi cycle packaging assets across industries.
Restraint:
High upfront investment requirements
High initial capital expenditure remains a significant restraint for the reusable packaging systems market. Organizations must invest in durable containers, pooling systems, tracking technologies, and cleaning infrastructure before realizing lifecycle cost benefits. For small and medium enterprises, the payback period can appear lengthy and financially burdensome. Additionally, transitioning from single use packaging often requires operational redesign and employee training. These financial and structural barriers can slow adoption, particularly in cost sensitive markets.
Opportunity:
Growth of e-commerce and supply chain optimization
The rapid expansion of e-commerce and the growing need for efficient supply chain operations present substantial opportunities for reusable packaging systems. High shipment volumes and repetitive distribution cycles makes returnable packaging economically attractive. Companies are increasingly adopting durable containers to improve product protection, reduce damage rates, and enhance warehouse automation compatibility. Furthermore, integration with RFID and IoT tracking improves asset visibility and utilization. As omnichannel fulfillment models expand, reusable packaging is expected to play a critical role in optimizing performance.
Threat:
Complex reverse logistics and operational challenges
Managing reverse logistics remains a key threat to the scalable deployment of reusable packaging systems. Efficient collection, cleaning, repair, and redistribution require well-coordinated networks and sophisticated tracking capabilities. Any inefficiency can increase costs and reduce asset availability. In geographically dispersed or low-density markets, return flows may be inconsistent, undermining economic viability. Additionally, handling contamination risks and maintaining quality standards add operational burden. Without strong pooling models and digital visibility, these complexities may limit adoption.
Covid-19 Impact:
The COVID-19 pandemic created mixed effects on the market. Initially, concerns around hygiene and cross-contamination prompted some industries to temporarily revert to single-use packaging. However, as supply chains stabilized, the focus returned to sustainability and cost efficiency. Increased e-commerce activity and supply chain disruptions highlighted the value of durable, trackable packaging assets. Post-pandemic, companies are investing more in automated cleaning, digital tracking, and resilient logistics networks, reinforcing the long-term outlook for reusable packaging solutions.
The glass segment is expected to be the largest during the forecast period
The glass segment is expected to account for the largest market share during the forecast period, due to its strong adoption in the beverage, pharmaceutical, and food industries. Glass offers excellent product protection, chemical inertness, and high reusability across multiple cycles. Its well established return and refill infrastructure, particularly in beverage bottling, supports large-scale deployment. Additionally, growing consumer preference for sustainable and recyclable packaging materials further strengthens demand for reusable glass containers in both developed and emerging markets.
The food & beverages segment is expected to have the highest CAGR during the forecast period
Over the forecast period, the food & beverages segment is predicted to witness the highest growth rate, due to rising demand for sustainable packaging in grocery, dairy, and beverage supply chains. High product turnover and frequent distribution cycles make reusable packaging economically viable in this sector. Retailers and food producers are increasingly adopting returnable crates, pallets, and containers to reduce waste and improve cold chain efficiency. Expanding online grocery delivery and regulatory pressure on single use plastics are further accelerating segment growth.
Region with largest share:
During the forecast period, the North America region is expected to hold the largest market share, due to its mature logistics infrastructure, strong presence of reusable packaging pooling providers, and early adoption of sustainable supply chain practices. Large retailers, automotive manufacturers, and food producers in the United States and Canada actively deploy returnable packaging to improve efficiency and meet ESG targets. Additionally, advanced tracking technologies and well developed reverse logistics networks support high asset utilization and reinforce regional market leadership.
Region with highest CAGR:
Over the forecast period, the Asia Pacific region is anticipated to exhibit the highest CAGR, owing to rapid industrialization and increasing environmental awareness across major economies such as China, India, and Southeast Asia. Growing e-commerce penetration and rising demand for efficient logistics solutions are accelerating adoption of reusable packaging. Governments in the region are also promoting waste reduction initiatives, encouraging businesses to transition toward circular packaging models. Improving supply chain infrastructure further supports strong regional growth potential.

Key players in the market
Some of the key players in Reusable Packaging Systems Market include Brambles, DS Smith, Schoeller Allibert, IFCO Systems, ORBIS Corporation, Smurfit Kappa, Mauser Packaging Solutions, SSI Schaefer, Buckhorn Inc, Nefab Group, Rehrig Pacific Company, RPP Containers, Schutz GmbH & Co. KGaA, Tri-Wall Limited and GWP Group.
Key Developments:
In May 2025, Hitachi Digital Services has partnered with DS Smith to modernize its global integration platform, enabling a cloud-native, AI-powered architecture that replaces legacy middleware. The initiative enhances interoperability, accelerates deployment, improves operational agility, and supports DS Smith’s broader digital transformation and future-ready growth strategy.
In March 2025, DS Smith has extended its agreement with a major automotive manufacturer through a five year; £108 million contract to deliver fibre-based packaging solutions. The deal provides an integrated, end-to-end service model designed to enhance sustainability, reduce packaging waste, improve supply-chain efficiency, and support the customer’s long-term environmental strategy.
Packaging Types Covered:
• Reusable Containers
• Reusable Crates & Pallets
• Reusable Totes & Bags
• Other Packaging Types
Materials Covered:
• Plastic
• Metal
• Glass
• Corrugated Paper & Fiberboard
• Other Materials
End Users Covered:
• Food & Beverages
• Pharmaceuticals & Healthcare
• Automotive & Industrial
• E-commerce & Retail
• Consumer Goods
• Other End Users
Regions Covered:
• North America
o United States
o Canada
o Mexico
• Europe
o United Kingdom
o Germany
o France
o Italy
o Spain
o Netherlands
o Belgium
o Sweden
o Switzerland
o Poland
o Rest of Europe
• Asia Pacific
o China
o Japan
o India
o South Korea
o Australia
o Indonesia
o Thailand
o Malaysia
o Singapore
o Vietnam
o Rest of Asia Pacific
• South America
o Brazil
o Argentina
o Colombia
o Chile
o Peru
o Rest of South America
• Rest of the World (RoW)
o Middle East
§ Saudi Arabia
§ United Arab Emirates
§ Qatar
§ Israel
§ Rest of Middle East
o Africa
§ South Africa
§ Egypt
§ Morocco
§ Rest of Africa
What our report offers:
- Market share assessments for the regional and country-level segments
- Strategic recommendations for the new entrants
- Covers Market data for the years 2023, 2024, 2025, 2026, 2027, 2028, 2030, 2032 and 2034
- Market Trends (Drivers, Constraints, Opportunities, Threats, Challenges, Investment Opportunities, and recommendations)
- Strategic recommendations in key business segments based on the market estimations
- Competitive landscaping mapping the key common trends
- Company profiling with detailed strategies, financials, and recent developments
- Supply chain trends mapping the latest technological advancements
Free Customization Offerings:
All the customers of this report will be entitled to receive one of the following free customization options:
• Company Profiling
o Comprehensive profiling of additional market players (up to 3)
o SWOT Analysis of key players (up to 3)
• Regional Segmentation
o Market estimations, Forecasts and CAGR of any prominent country as per the client's interest (Note: Depends on feasibility check)
• Competitive Benchmarking
o Benchmarking of key players based on product portfolio, geographical presence, and strategic alliances
Table of Contents
1 Executive Summary
1.1 Market Snapshot and Key Highlights
1.2 Growth Drivers, Challenges, and Opportunities
1.3 Competitive Landscape Overview
1.4 Strategic Insights and Recommendations
2 Research Framework
2.1 Study Objectives and Scope
2.2 Stakeholder Analysis
2.3 Research Assumptions and Limitations
2.4 Research Methodology
2.4.1 Data Collection (Primary and Secondary)
2.4.2 Data Modeling and Estimation Techniques
2.4.3 Data Validation and Triangulation
2.4.4 Analytical and Forecasting Approach
3 Market Dynamics and Trend Analysis
3.1 Market Definition and Structure
3.2 Key Market Drivers
3.3 Market Restraints and Challenges
3.4 Growth Opportunities and Investment Hotspots
3.5 Industry Threats and Risk Assessment
3.6 Technology and Innovation Landscape
3.7 Emerging and High-Growth Markets
3.8 Regulatory and Policy Environment
3.9 Impact of COVID-19 and Recovery Outlook
4 Competitive and Strategic Assessment
4.1 Porter's Five Forces Analysis
4.1.1 Supplier Bargaining Power
4.1.2 Buyer Bargaining Power
4.1.3 Threat of Substitutes
4.1.4 Threat of New Entrants
4.1.5 Competitive Rivalry
4.2 Market Share Analysis of Key Players
4.3 Product Benchmarking and Performance Comparison
5 Global Reusable Packaging Systems Market, By Packaging Type
5.1 Reusable Containers
5.2 Reusable Crates & Pallets
5.3 Reusable Totes & Bags
5.4 Other Packaging Types
6 Global Reusable Packaging Systems Market, By Material
6.1 Plastic
6.2 Metal
6.3 Glass
6.4 Corrugated Paper & Fiberboard
6.5 Other Materials
7 Global Reusable Packaging Systems Market, By End User
7.1 Food & Beverages
7.2 Pharmaceuticals & Healthcare
7.3 Automotive & Industrial
7.4 E-commerce & Retail
7.5 Consumer Goods
7.6 Other End Users
8 Global Reusable Packaging Systems Market, By Geography
8.1 North America
8.1.1 United States
8.1.2 Canada
8.1.3 Mexico
8.2 Europe
8.2.1 United Kingdom
8.2.2 Germany
8.2.3 France
8.2.4 Italy
8.2.5 Spain
8.2.6 Netherlands
8.2.7 Belgium
8.2.8 Sweden
8.2.9 Switzerland
8.2.10 Poland
8.2.11 Rest of Europe
8.3 Asia Pacific
8.3.1 China
8.3.2 Japan
8.3.3 India
8.3.4 South Korea
8.3.5 Australia
8.3.6 Indonesia
8.3.7 Thailand
8.3.8 Malaysia
8.3.9 Singapore
8.3.10 Vietnam
8.3.11 Rest of Asia Pacific
8.4 South America
8.4.1 Brazil
8.4.2 Argentina
8.4.3 Colombia
8.4.4 Chile
8.4.5 Peru
8.4.6 Rest of South America
8.5 Rest of the World (RoW)
8.5.1 Middle East
8.5.1.1 Saudi Arabia
8.5.1.2 United Arab Emirates
8.5.1.3 Qatar
8.5.1.4 Israel
8.5.1.5 Rest of Middle East
8.5.2 Africa
8.5.2.1 South Africa
8.5.2.2 Egypt
8.5.2.3 Morocco
8.5.2.4 Rest of Africa
9 Strategic Market Intelligence
9.1 Industry Value Network and Supply Chain Assessment
9.2 White-Space and Opportunity Mapping
9.3 Product Evolution and Market Life Cycle Analysis
9.4 Channel, Distributor, and Go-to-Market Assessment
10 Industry Developments and Strategic Initiatives
10.1 Mergers and Acquisitions
10.2 Partnerships, Alliances, and Joint Ventures
10.3 New Product Launches and Certifications
10.4 Capacity Expansion and Investments
10.5 Other Strategic Initiatives
11 Company Profiles
11.1 Brambles
11.2 DS Smith
11.3 Schoeller Allibert
11.4 IFCO Systems
11.5 ORBIS Corporation
11.6 Smurfit Kappa
11.7 Mauser Packaging Solutions
11.8 SSI Schaefer
11.9 Buckhorn Inc
11.10 Nefab Group
11.11 Rehrig Pacific Company
11.12 RPP Containers
11.13 Schutz GmbH & Co. KGaA
11.14 Tri Wall Limited
11.15 GWP Group
List of Tables
1 Global Reusable Packaging Systems Market Outlook, By Region (2023-2034) ($MN)
2 Global Reusable Packaging Systems Market Outlook, By Packaging Type (2023-2034) ($MN)
3 Global Reusable Packaging Systems Market Outlook, By Reusable Containers (2023-2034) ($MN)
4 Global Reusable Packaging Systems Market Outlook, By Reusable Crates & Pallets (2023-2034) ($MN)
5 Global Reusable Packaging Systems Market Outlook, By Reusable Totes & Bags (2023-2034) ($MN)
6 Global Reusable Packaging Systems Market Outlook, By Other Packaging Types (2023-2034) ($MN)
7 Global Reusable Packaging Systems Market Outlook, By Material (2023-2034) ($MN)
8 Global Reusable Packaging Systems Market Outlook, By Plastic (2023-2034) ($MN)
9 Global Reusable Packaging Systems Market Outlook, By Metal (2023-2034) ($MN)
10 Global Reusable Packaging Systems Market Outlook, By Glass (2023-2034) ($MN)
11 Global Reusable Packaging Systems Market Outlook, By Corrugated Paper & Fiberboard (2023-2034) ($MN)
12 Global Reusable Packaging Systems Market Outlook, By Other Materials (2023-2034) ($MN)
13 Global Reusable Packaging Systems Market Outlook, By End User (2023-2034) ($MN)
14 Global Reusable Packaging Systems Market Outlook, By Food & Beverages (2023-2034) ($MN)
15 Global Reusable Packaging Systems Market Outlook, By Pharmaceuticals & Healthcare (2023-2034) ($MN)
16 Global Reusable Packaging Systems Market Outlook, By Automotive & Industrial (2023-2034) ($MN)
17 Global Reusable Packaging Systems Market Outlook, By E-commerce & Retail (2023-2034) ($MN)
18 Global Reusable Packaging Systems Market Outlook, By Consumer Goods (2023-2034) ($MN)
19 Global Reusable Packaging Systems Market Outlook, By Other End Users (2023-2034) ($MN)
Note: Tables for North America, Europe, APAC, South America, and Rest of the World (RoW) Regions are also represented in the same manner as above.
List of Figures
RESEARCH METHODOLOGY

We at ‘Stratistics’ opt for an extensive research approach which involves data mining, data validation, and data analysis. The various research sources include in-house repository, secondary research, competitor’s sources, social media research, client internal data, and primary research.
Our team of analysts prefers the most reliable and authenticated data sources in order to perform the comprehensive literature search. With access to most of the authenticated data bases our team highly considers the best mix of information through various sources to obtain extensive and accurate analysis.
Each report takes an average time of a month and a team of 4 industry analysts. The time may vary depending on the scope and data availability of the desired market report. The various parameters used in the market assessment are standardized in order to enhance the data accuracy.
Data Mining
The data is collected from several authenticated, reliable, paid and unpaid sources and is filtered depending on the scope & objective of the research. Our reports repository acts as an added advantage in this procedure. Data gathering from the raw material suppliers, distributors and the manufacturers is performed on a regular basis, this helps in the comprehensive understanding of the products value chain. Apart from the above mentioned sources the data is also collected from the industry consultants to ensure the objective of the study is in the right direction.
Market trends such as technological advancements, regulatory affairs, market dynamics (Drivers, Restraints, Opportunities and Challenges) are obtained from scientific journals, market related national & international associations and organizations.
Data Analysis
From the data that is collected depending on the scope & objective of the research the data is subjected for the analysis. The critical steps that we follow for the data analysis include:
- Product Lifecycle Analysis
- Competitor analysis
- Risk analysis
- Porters Analysis
- PESTEL Analysis
- SWOT Analysis
The data engineering is performed by the core industry experts considering both the Marketing Mix Modeling and the Demand Forecasting. The marketing mix modeling makes use of multiple-regression techniques to predict the optimal mix of marketing variables. Regression factor is based on a number of variables and how they relate to an outcome such as sales or profits.
Data Validation
The data validation is performed by the exhaustive primary research from the expert interviews. This includes telephonic interviews, focus groups, face to face interviews, and questionnaires to validate our research from all aspects. The industry experts we approach come from the leading firms, involved in the supply chain ranging from the suppliers, distributors to the manufacturers and consumers so as to ensure an unbiased analysis.
We are in touch with more than 15,000 industry experts with the right mix of consultants, CEO's, presidents, vice presidents, managers, experts from both supply side and demand side, executives and so on.
The data validation involves the primary research from the industry experts belonging to:
- Leading Companies
- Suppliers & Distributors
- Manufacturers
- Consumers
- Industry/Strategic Consultants
Apart from the data validation the primary research also helps in performing the fill gap research, i.e. providing solutions for the unmet needs of the research which helps in enhancing the reports quality.
For more details about research methodology, kindly write to us at info@strategymrc.com
Frequently Asked Questions
In case of any queries regarding this report, you can contact the customer service by filing the “Inquiry Before Buy” form available on the right hand side. You may also contact us through email: info@strategymrc.com or phone: +1-301-202-5929
Yes, the samples are available for all the published reports. You can request them by filling the “Request Sample” option available in this page.
Yes, you can request a sample with your specific requirements. All the customized samples will be provided as per the requirement with the real data masked.
All our reports are available in Digital PDF format. In case if you require them in any other formats, such as PPT, Excel etc you can submit a request through “Inquiry Before Buy” form available on the right hand side. You may also contact us through email: info@strategymrc.com or phone: +1-301-202-5929
We offer a free 15% customization with every purchase. This requirement can be fulfilled for both pre and post sale. You may send your customization requirements through email at info@strategymrc.com or call us on +1-301-202-5929.
We have 3 different licensing options available in electronic format.
- Single User Licence: Allows one person, typically the buyer, to have access to the ordered product. The ordered product cannot be distributed to anyone else.
- 2-5 User Licence: Allows the ordered product to be shared among a maximum of 5 people within your organisation.
- Corporate License: Allows the product to be shared among all employees of your organisation regardless of their geographical location.
All our reports are typically be emailed to you as an attachment.
To order any available report you need to register on our website. The payment can be made either through CCAvenue or PayPal payments gateways which accept all international cards.
We extend our support to 6 months post sale. A post sale customization is also provided to cover your unmet needs in the report.
Request Customization
We offer complimentary customization of up to 15% with every purchase. To share your customization requirements, feel free to email us at info@strategymrc.com or call us on +1-301-202-5929. .
Please Note: Customization within the 15% threshold is entirely free of charge. If your request exceeds this limit, we will conduct a feasibility assessment. Following that, a detailed quote and timeline will be provided.
WHY CHOOSE US ?

Assured Quality
Best in class reports with high standard of research integrity

24X7 Research Support
Continuous support to ensure the best customer experience.

Free Customization
Adding more values to your product of interest.

Safe & Secure Access
Providing a secured environment for all online transactions.

Trusted by 600+ Brands
Serving the most reputed brands across the world.