
Rf Over Fiber Market
RF-over-Fiber Market Forecasts to 2032 - Global Analysis By Component (Optical Cables, Optical Amplifiers, Optical Transceivers, Optical Switches and Other Components), Frequency Band, Deployment Type, Application, End User and By Geography

|
Years Covered |
2022-2030 |
|
Estimated Year Value (2024) |
US $714.99 BN |
|
Projected Year Value (2030) |
US $1465.82 BN |
|
CAGR (2024 - 2030) |
10.8% |
|
Regions Covered |
North America, Europe, Asia Pacific, South America, and Middle East & Africa |
|
Countries Covered |
US, Canada, Mexico, Germany, UK, Italy, France, Spain, Japan, China, India, Australia, New Zealand, South Korea, Rest of Asia Pacific, South America, Argentina, Brazil, Chile, Middle East & Africa, Saudi Arabia, UAE, Qatar, and South Africa |
|
Largest Market |
Asia Pacific |
|
Highest Growing Market |
North America |
According to Stratistics MRC, the Global RF-over-Fiber Market is accounted for $714.99 billion in 2025 and is expected to reach $1465.82 billion by 2032 growing at a CAGR of 10.8% during the forecast period. A system known as RF-over-Fiber (RFoF) uses optical fibre cables rather than conventional coaxial cables to send radio frequency (RF) communications. Through the use of electro-optical modulators, it transforms radio frequency (RF) signals into optical signals, enabling high-frequency signals to travel over long distances with reduced loss, less interference, and increased bandwidth. Applications for RFoF are numerous and include broadcasting, cellular networks, satellite communication, and military systems. RFoF is an affordable and high-performing solution for contemporary communication systems since it uses optical fibre to improve signal integrity, allow centralised topologies, and accommodate remote antenna sites.
According to the Nokia MBiT 2021 report, the continuous transition to 4G of mobile networks in India has facilitated increased online learning, remote working for professionals and higher OTT viewership.
Market Dynamics:
Driver:
Increasing demand in aerospace & defense
High-performance communication systems with low signal loss over long distances are necessary for these industries, and RFoF technology effectively meets their needs. For military applications that are vital to the mission, its resilience to electromagnetic interference is essential. RFoF is being used more and more in radar systems and satellite communications to guarantee low latency and high bandwidth. RFoF integration is enhanced by the increased emphasis on safe and instantaneous data transfer in defence operations. All things considered, the RFoF industry is steadily expanding because to developments in defence technology.
Restraint:
High initial investment
Fibre infrastructure, modulators, and optical transceivers are among the costly parts needed for the adoption of RFoF systems. Small and medium-sized businesses frequently find it difficult to set aside enough money for these up-front expenses. Furthermore, integrating RFoF technology necessitates complicated installation processes and experienced labour, which raises the initial costs even more. Widespread adoption is constrained by these financial obstacles, particularly in areas where costs are high. Potential customers might therefore postpone or refrain from switching from conventional radio frequency systems to fiber-based alternatives.
Opportunity:
Growth in remote sensing and broadcasting
Real-time data transfer, which is essential for remote sensing applications like satellite imaging and environmental monitoring, is made possible by RFoF. The ability of RFoF to preserve signal integrity over long distances improves the quality of content transmission for the television industry. The usage of RFoF for smooth data flow is further fuelled by developments in 5G and satellite communication. The technology's ability to withstand electromagnetic interference allows for continuous sensing and broadcasting. In general, these industries' demand for dependable, high-bandwidth communication propels the growth of the RFoF market.
Threat:
Fiber infrastructure limitations in rural areas
The high-speed fiber-optic networks required for RFoF deployment are frequently absent from these areas. For many service providers, growth is not economically feasible due to the high cost of installing fibre across large, sparsely inhabited areas. Hence, RFoF applications in broadcasting, telecommunications, and defence continue to be confined in urban or well-connected areas. This geographical disparity slows broad adoption and limits market penetration. In the end, RFoF technology progress is hindered and demand is limited by the absence of rural infrastructure.
Covid-19 Impact
The COVID-19 pandemic had a mixed impact on the RF-over-Fiber market. Initially, the market faced disruptions due to supply chain interruptions, halted manufacturing activities, and reduced capital expenditure in key sectors like aerospace and defense. However, the growing demand for high-speed data transmission and remote communication solutions during lockdowns accelerated the adoption of RF-over-Fiber in telecommunications and data centers. As remote work and digitalization surged, the market gradually rebounded. Post-pandemic recovery efforts and increased investments in 5G infrastructure further fueled market growth.
The military & aerospace segment is expected to be the largest during the forecast period
The military & aerospace segment is expected to account for the largest market share during the forecast period, due to its demand for secure, high-bandwidth, and long-distance communication systems. RFoF technology ensures minimal signal loss and immunity to electromagnetic interference, making it ideal for harsh and mission-critical environments. It supports applications such as radar systems, electronic warfare, and satellite communications with enhanced reliability and performance. The increasing defense budgets and modernization of military infrastructure worldwide further fuel its adoption. Additionally, the need for lightweight and compact systems in aircraft and unmanned vehicles accelerates RFoF integration.
The optical amplifiers segment is expected to have the highest CAGR during the forecast period
Over the forecast period, the optical amplifiers segment is predicted to witness the highest growth rate by enabling long-distance signal transmission with minimal loss. These amplifiers enhance signal strength, reducing the need for multiple repeaters and improving overall system efficiency. Their ability to support high bandwidth and low noise performance makes them ideal for defense, telecommunications, and satellite communications. As demand for high-speed, high-frequency communication grows, optical amplifiers become critical for maintaining signal integrity over fiber links. Advancements in erbium-doped fiber amplifiers (EDFAs) and Raman amplifiers further drive adoption across key industries.
Region with largest share:
During the forecast period, the Asia Pacific region is expected to hold the largest market share due to the proliferation of smart city initiatives, expanding telecommunications infrastructure, and rising defense spending. Countries like China, Japan, South Korea, and India are investing heavily in 5G networks and satellite communications, driving demand for RF-over-Fiber solutions. Rapid urbanization and industrial automation increase the need for low-latency, high-bandwidth communication systems. Furthermore, the presence of cost-effective manufacturing hubs enhances supply chain efficiency and attracts global players to the region. Government-backed digital transformation projects significantly contribute to the market’s positive momentum.
Region with highest CAGR:
Over the forecast period, the North America region is anticipated to exhibit the highest CAGR, owing to increasing investments in defense, aerospace, and 5G infrastructure. The region benefits from robust demand for high-speed, long-distance signal transmission solutions and a strong presence of key industry players. Government initiatives and funding to enhance communication capabilities in military and satellite applications also fuel market expansion. The United States remains the dominant contributor due to advanced technological infrastructure and strategic collaborations. Growing adoption in data centers and remote sensing applications further supports sustained regional market growth.

Key players in the market
Some of the key players profiled in the RF-over-Fiber Market include Coherent Corp., HUBER+SUHNER AG, EMCORE Corporation, Seikoh Giken Co., Ltd., Broadcom Inc., DEV Systemtechnik GmbH, Global Foxcom, Optical Zonu Corp., ViaLite Communications, APIC Corporation, Glenair, TeraXion, RF-Lambda, Quintech Electronics & Communications, Inc., Microwave Photonic Systems, Inc., Octane Wireless and RFOptic Ltd.
Key Developments:
In November 2024, EMCORE entered a merger agreement to become a wholly-owned subsidiary of Velocity One, backed by Charlesbank and co-existing with Cartridge Actuated Devices and Aerosphere Power. Approved at $3.10/share, the deal aims to create synergies within aerospace and defense.
In September 2024, Coherent & Marvell, Lumentum collaborated to showcased the industry’s first 800G ZR/ZR+ pluggable coherent modules. Designed for data center interconnects up to 500 km, the solution highlights low power, high-performance optics aimed at accelerating scalable RF-over-Fiber and long-haul coherent optical transmission deployments.
Components Covered:
• Optical Cables
• Optical Amplifiers
• Optical Transceivers
• Optical Switches
• Other Components
Frequency Bands Covered:
• L Band (1 GHz to 2 GHz)
• S Band (2 GHz to 4 GHz)
• C Band (4 GHz to 8 GHz)
• X Band (8 GHz to 12 GHz)
• Ku Band (12 GHz to 18 GHz)
• Ka Band (26.5 GHz to 40 GHz)
• Other Frequency Bands
Deployment Types Covered:
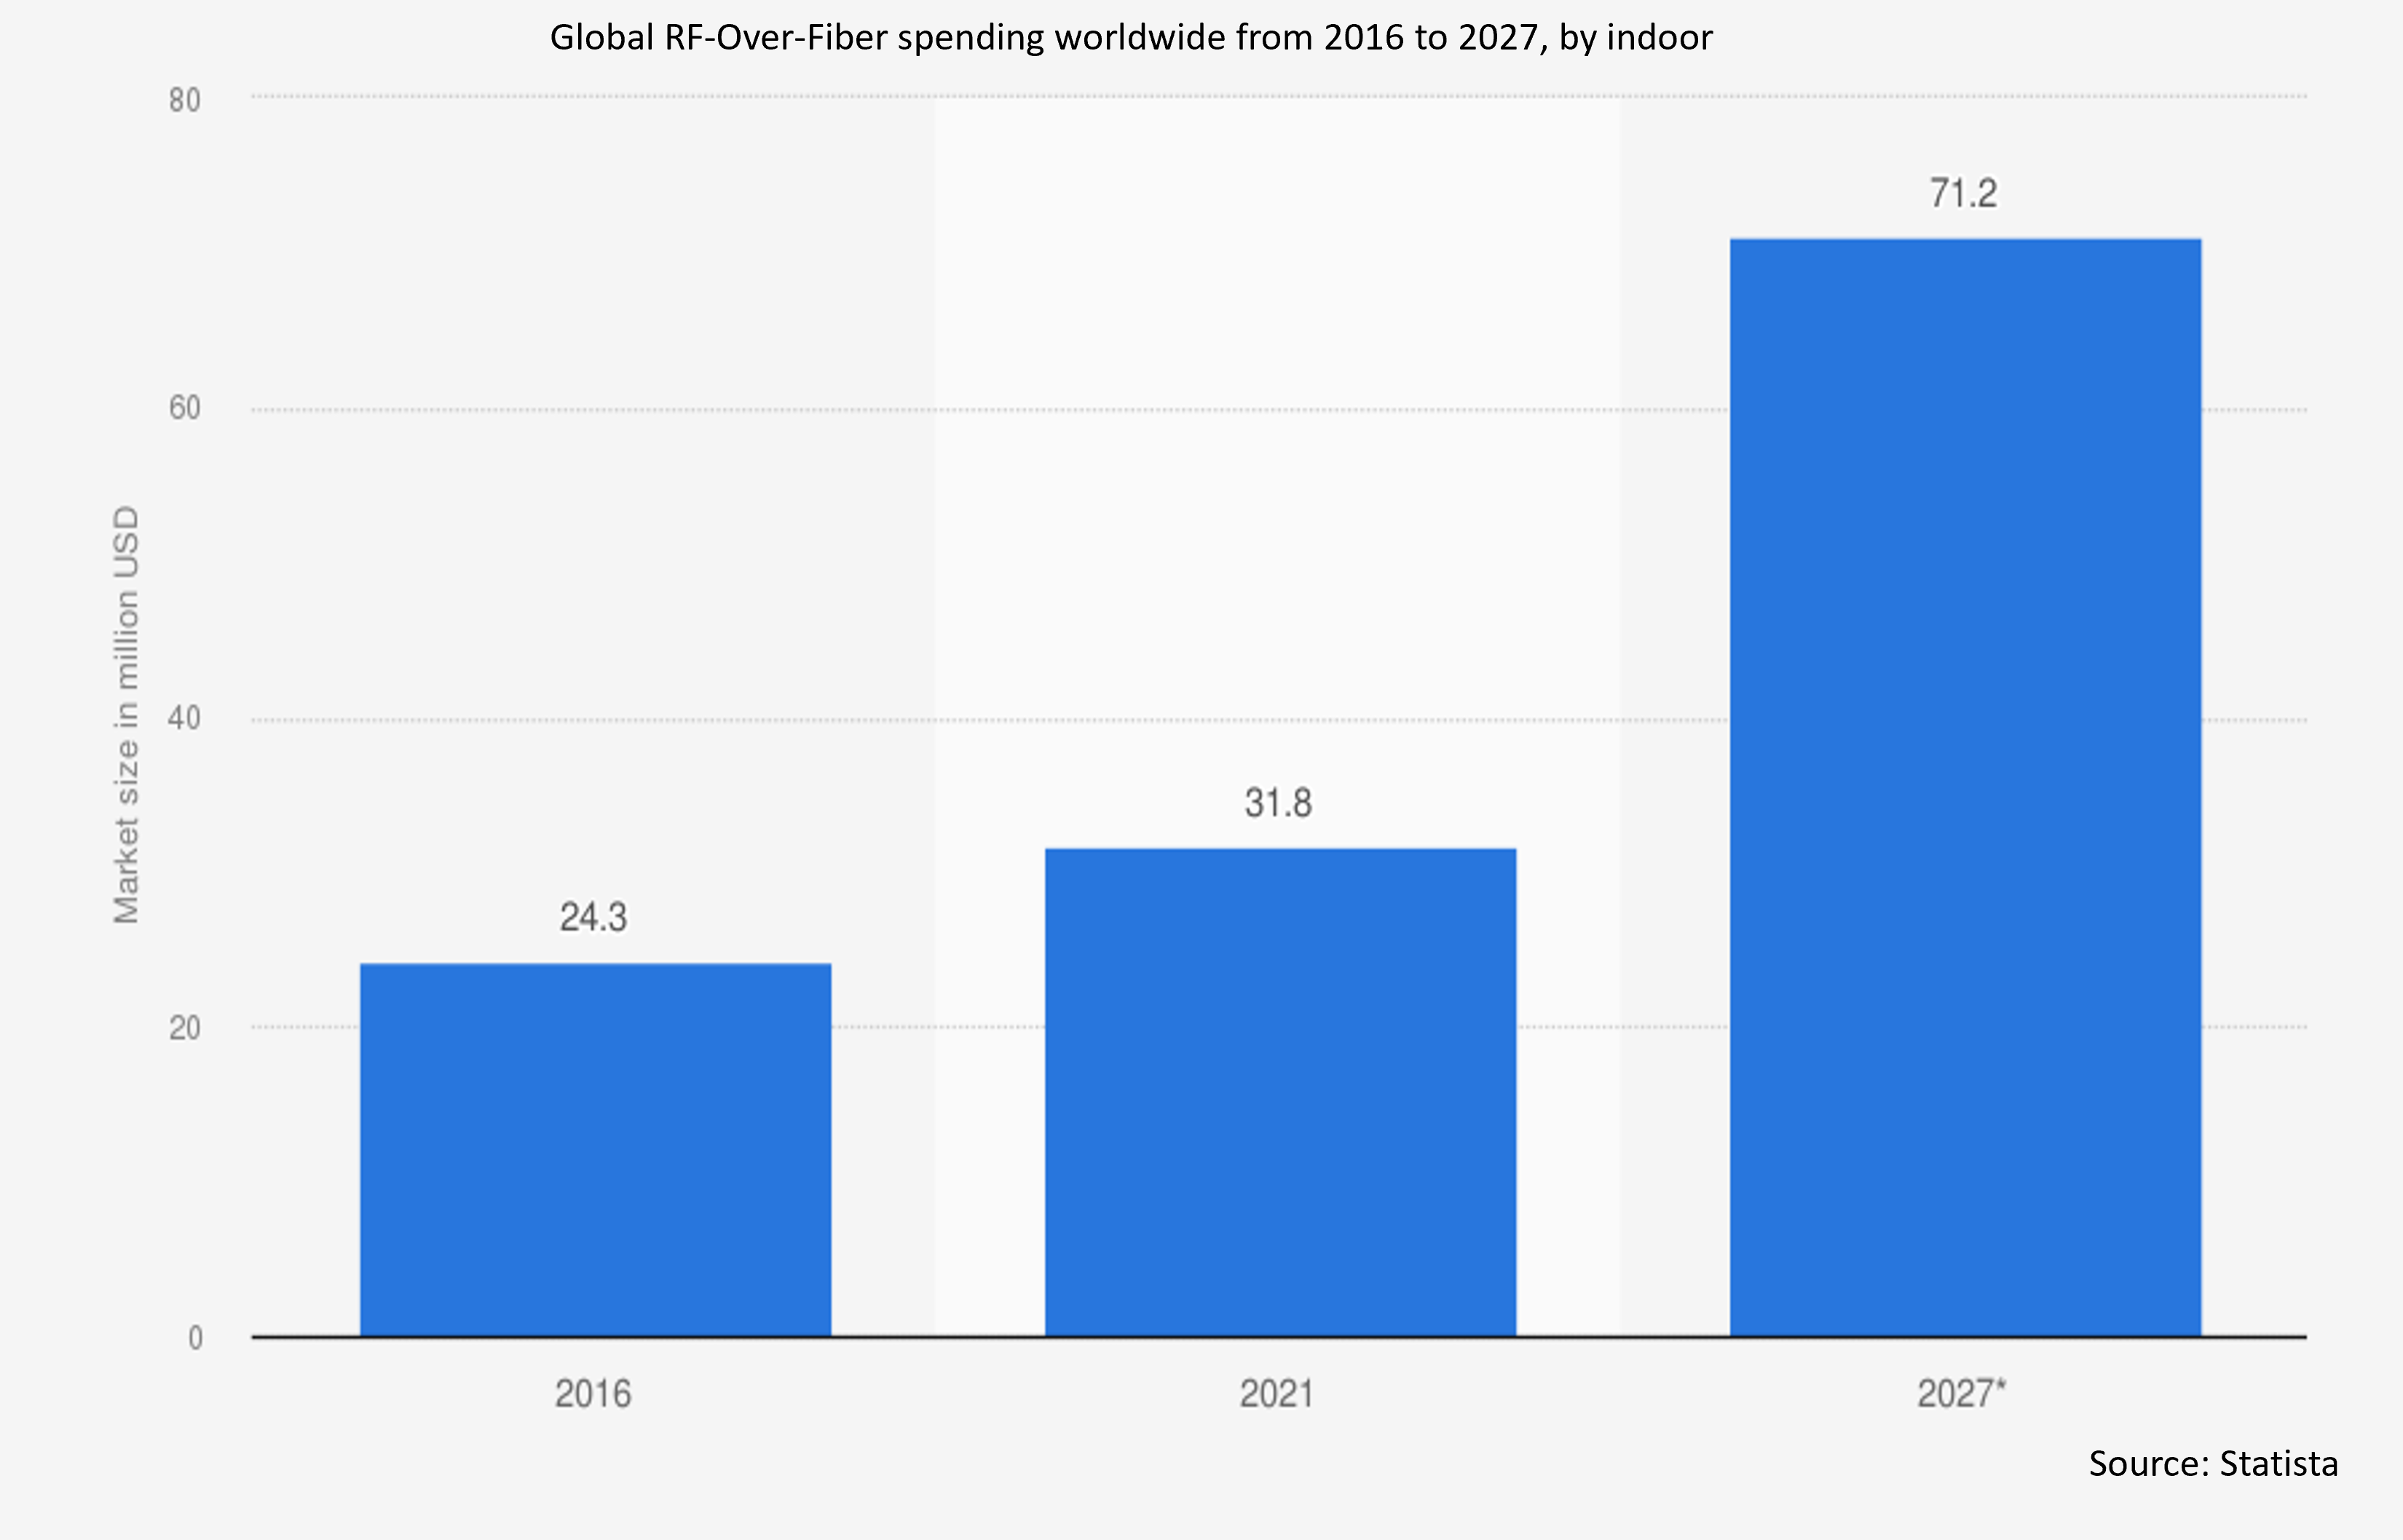
• Indoor
• Outdoor
Applications Covered:
• Telecommunications
• Broadcasting
• Navigation
• Radar
• Broadband
• Satellite Communications
• Military and Defense
• Other Applications
End Users Covered:
• Civil
• Military & Aerospace
• Transportation
• IT & Data Centers
• Other End Users
Regions Covered:
• North America
o US
o Canada
o Mexico
• Europe
o Germany
o UK
o Italy
o France
o Spain
o Rest of Europe
• Asia Pacific
o Japan
o China
o India
o Australia
o New Zealand
o South Korea
o Rest of Asia Pacific
• South America
o Argentina
o Brazil
o Chile
o Rest of South America
• Middle East & Africa
o Saudi Arabia
o UAE
o Qatar
o South Africa
o Rest of Middle East & Africa
What our report offers:
- Market share assessments for the regional and country-level segments
- Strategic recommendations for the new entrants
- Covers Market data for the years 2024, 2025, 2026, 2028, and 2032
- Market Trends (Drivers, Constraints, Opportunities, Threats, Challenges, Investment Opportunities, and recommendations)
- Strategic recommendations in key business segments based on the market estimations
- Competitive landscaping mapping the key common trends
- Company profiling with detailed strategies, financials, and recent developments
- Supply chain trends mapping the latest technological advancements
Free Customization Offerings:
All the customers of this report will be entitled to receive one of the following free customization options:
• Company Profiling
o Comprehensive profiling of additional market players (up to 3)
o SWOT Analysis of key players (up to 3)
• Regional Segmentation
o Market estimations, Forecasts and CAGR of any prominent country as per the client's interest (Note: Depends on feasibility check)
• Competitive Benchmarking
o Benchmarking of key players based on product portfolio, geographical presence, and strategic alliances
Table of Contents
1 Executive Summary
2 Preface
2.1 Abstract
2.2 Stake Holders
2.3 Research Scope
2.4 Research Methodology
2.4.1 Data Mining
2.4.2 Data Analysis
2.4.3 Data Validation
2.4.4 Research Approach
2.5 Research Sources
2.5.1 Primary Research Sources
2.5.2 Secondary Research Sources
2.5.3 Assumptions
3 Market Trend Analysis
3.1 Introduction
3.2 Drivers
3.3 Restraints
3.4 Opportunities
3.5 Threats
3.6 Application Analysis
3.7 End User Analysis
3.8 Emerging Markets
3.9 Impact of Covid-19
4 Porters Five Force Analysis
4.1 Bargaining power of suppliers
4.2 Bargaining power of buyers
4.3 Threat of substitutes
4.4 Threat of new entrants
4.5 Competitive rivalry
5 Global RF-over-Fiber Market, By Component
5.1 Introduction
5.2 Optical Cables
5.3 Optical Amplifiers
5.4 Optical Transceivers
5.5 Optical Switches
5.6 Other Components
6 Global RF-over-Fiber Market, By Frequency Band
6.1 Introduction
6.2 L Band (1 GHz to 2 GHz)
6.3 S Band (2 GHz to 4 GHz)
6.4 C Band (4 GHz to 8 GHz)
6.5 X Band (8 GHz to 12 GHz)
6.6 Ku Band (12 GHz to 18 GHz)
6.7 Ka Band (26.5 GHz to 40 GHz)
6.8 Other Frequency Bands
7 Global RF-over-Fiber Market, By Deployment Type
7.1 Introduction
7.2 Indoor
7.3 Outdoor
8 Global RF-over-Fiber Market, By Application
8.1 Introduction
8.2 Telecommunications
8.3 Broadcasting
8.4 Navigation
8.5 Radar
8.6 Broadband
8.7 Satellite Communications
8.8 Military and Defense
8.9 Other Applications
9 Global RF-over-Fiber Market, By End User
9.1 Introduction
9.2 Civil
9.3 Military & Aerospace
9.4 Transportation
9.5 IT & Data Centers
9.6 Other End Users
10 Global RF-over-Fiber Market, By Geography
10.1 Introduction
10.2 North America
10.2.1 US
10.2.2 Canada
10.2.3 Mexico
10.3 Europe
10.3.1 Germany
10.3.2 UK
10.3.3 Italy
10.3.4 France
10.3.5 Spain
10.3.6 Rest of Europe
10.4 Asia Pacific
10.4.1 Japan
10.4.2 China
10.4.3 India
10.4.4 Australia
10.4.5 New Zealand
10.4.6 South Korea
10.4.7 Rest of Asia Pacific
10.5 South America
10.5.1 Argentina
10.5.2 Brazil
10.5.3 Chile
10.5.4 Rest of South America
10.6 Middle East & Africa
10.6.1 Saudi Arabia
10.6.2 UAE
10.6.3 Qatar
10.6.4 South Africa
10.6.5 Rest of Middle East & Africa
11 Key Developments
11.1 Agreements, Partnerships, Collaborations and Joint Ventures
11.2 Acquisitions & Mergers
11.3 New Product Launch
11.4 Expansions
11.5 Other Key Strategies
12 Company Profiling
12.1 Coherent Corp.
12.2 HUBER+SUHNER AG
12.3 EMCORE Corporation
12.4 Seikoh Giken Co., Ltd.
12.5 Broadcom Inc.
12.6 DEV Systemtechnik GmbH
12.7 Global Foxcom
12.8 Optical Zonu Corp.
12.9 ViaLite Communications
12.10 APIC Corporation
12.11 Glenair
12.12 TeraXion
12.12 RF-Lambda
12.14 Quintech Electronics & Communications, Inc.
12.15 Microwave Photonic Systems, Inc.
12.16 Octane Wireless
12.17 RFOptic Ltd.
List of Tables
1 Global RF-over-Fiber Market Outlook, By Region (2024-2032) ($MN)
2 Global RF-over-Fiber Market Outlook, By Component (2024-2032) ($MN)
3 Global RF-over-Fiber Market Outlook, By Optical Cables (2024-2032) ($MN)
4 Global RF-over-Fiber Market Outlook, By Optical Amplifiers (2024-2032) ($MN)
5 Global RF-over-Fiber Market Outlook, By Optical Transceivers (2024-2032) ($MN)
6 Global RF-over-Fiber Market Outlook, By Optical Switches (2024-2032) ($MN)
7 Global RF-over-Fiber Market Outlook, By Other Components (2024-2032) ($MN)
8 Global RF-over-Fiber Market Outlook, By Frequency Band (2024-2032) ($MN)
9 Global RF-over-Fiber Market Outlook, By L Band (1 GHz to 2 GHz) (2024-2032) ($MN)
10 Global RF-over-Fiber Market Outlook, By S Band (2 GHz to 4 GHz) (2024-2032) ($MN)
11 Global RF-over-Fiber Market Outlook, By C Band (4 GHz to 8 GHz) (2024-2032) ($MN)
12 Global RF-over-Fiber Market Outlook, By X Band (8 GHz to 12 GHz) (2024-2032) ($MN)
13 Global RF-over-Fiber Market Outlook, By Ku Band (12 GHz to 18 GHz) (2024-2032) ($MN)
14 Global RF-over-Fiber Market Outlook, By Ka Band (26.5 GHz to 40 GHz) (2024-2032) ($MN)
15 Global RF-over-Fiber Market Outlook, By Other Frequency Bands (2024-2032) ($MN)
16 Global RF-over-Fiber Market Outlook, By Deployment Type (2024-2032) ($MN)
17 Global RF-over-Fiber Market Outlook, By Indoor (2024-2032) ($MN)
18 Global RF-over-Fiber Market Outlook, By Outdoor (2024-2032) ($MN)
19 Global RF-over-Fiber Market Outlook, By Application (2024-2032) ($MN)
20 Global RF-over-Fiber Market Outlook, By Telecommunications (2024-2032) ($MN)
21 Global RF-over-Fiber Market Outlook, By Broadcasting (2024-2032) ($MN)
22 Global RF-over-Fiber Market Outlook, By Navigation (2024-2032) ($MN)
23 Global RF-over-Fiber Market Outlook, By Radar (2024-2032) ($MN)
24 Global RF-over-Fiber Market Outlook, By Broadband (2024-2032) ($MN)
25 Global RF-over-Fiber Market Outlook, By Satellite Communications (2024-2032) ($MN)
26 Global RF-over-Fiber Market Outlook, By Military and Defense (2024-2032) ($MN)
27 Global RF-over-Fiber Market Outlook, By Other Applications (2024-2032) ($MN)
28 Global RF-over-Fiber Market Outlook, By End User (2024-2032) ($MN)
29 Global RF-over-Fiber Market Outlook, By Civil (2024-2032) ($MN)
30 Global RF-over-Fiber Market Outlook, By Military & Aerospace (2024-2032) ($MN)
31 Global RF-over-Fiber Market Outlook, By Transportation (2024-2032) ($MN)
32 Global RF-over-Fiber Market Outlook, By IT & Data Centers (2024-2032) ($MN)
33 Global RF-over-Fiber Market Outlook, By Other End Users (2024-2032) ($MN)
Note: Tables for North America, Europe, APAC, South America, and Middle East & Africa Regions are also represented in the same manner as above.
List of Figures
RESEARCH METHODOLOGY

We at ‘Stratistics’ opt for an extensive research approach which involves data mining, data validation, and data analysis. The various research sources include in-house repository, secondary research, competitor’s sources, social media research, client internal data, and primary research.
Our team of analysts prefers the most reliable and authenticated data sources in order to perform the comprehensive literature search. With access to most of the authenticated data bases our team highly considers the best mix of information through various sources to obtain extensive and accurate analysis.
Each report takes an average time of a month and a team of 4 industry analysts. The time may vary depending on the scope and data availability of the desired market report. The various parameters used in the market assessment are standardized in order to enhance the data accuracy.
Data Mining
The data is collected from several authenticated, reliable, paid and unpaid sources and is filtered depending on the scope & objective of the research. Our reports repository acts as an added advantage in this procedure. Data gathering from the raw material suppliers, distributors and the manufacturers is performed on a regular basis, this helps in the comprehensive understanding of the products value chain. Apart from the above mentioned sources the data is also collected from the industry consultants to ensure the objective of the study is in the right direction.
Market trends such as technological advancements, regulatory affairs, market dynamics (Drivers, Restraints, Opportunities and Challenges) are obtained from scientific journals, market related national & international associations and organizations.
Data Analysis
From the data that is collected depending on the scope & objective of the research the data is subjected for the analysis. The critical steps that we follow for the data analysis include:
- Product Lifecycle Analysis
- Competitor analysis
- Risk analysis
- Porters Analysis
- PESTEL Analysis
- SWOT Analysis
The data engineering is performed by the core industry experts considering both the Marketing Mix Modeling and the Demand Forecasting. The marketing mix modeling makes use of multiple-regression techniques to predict the optimal mix of marketing variables. Regression factor is based on a number of variables and how they relate to an outcome such as sales or profits.
Data Validation
The data validation is performed by the exhaustive primary research from the expert interviews. This includes telephonic interviews, focus groups, face to face interviews, and questionnaires to validate our research from all aspects. The industry experts we approach come from the leading firms, involved in the supply chain ranging from the suppliers, distributors to the manufacturers and consumers so as to ensure an unbiased analysis.
We are in touch with more than 15,000 industry experts with the right mix of consultants, CEO's, presidents, vice presidents, managers, experts from both supply side and demand side, executives and so on.
The data validation involves the primary research from the industry experts belonging to:
- Leading Companies
- Suppliers & Distributors
- Manufacturers
- Consumers
- Industry/Strategic Consultants
Apart from the data validation the primary research also helps in performing the fill gap research, i.e. providing solutions for the unmet needs of the research which helps in enhancing the reports quality.
For more details about research methodology, kindly write to us at info@strategymrc.com
Frequently Asked Questions
In case of any queries regarding this report, you can contact the customer service by filing the “Inquiry Before Buy” form available on the right hand side. You may also contact us through email: info@strategymrc.com or phone: +1-301-202-5929
Yes, the samples are available for all the published reports. You can request them by filling the “Request Sample” option available in this page.
Yes, you can request a sample with your specific requirements. All the customized samples will be provided as per the requirement with the real data masked.
All our reports are available in Digital PDF format. In case if you require them in any other formats, such as PPT, Excel etc you can submit a request through “Inquiry Before Buy” form available on the right hand side. You may also contact us through email: info@strategymrc.com or phone: +1-301-202-5929
We offer a free 15% customization with every purchase. This requirement can be fulfilled for both pre and post sale. You may send your customization requirements through email at info@strategymrc.com or call us on +1-301-202-5929.
We have 3 different licensing options available in electronic format.
- Single User Licence: Allows one person, typically the buyer, to have access to the ordered product. The ordered product cannot be distributed to anyone else.
- 2-5 User Licence: Allows the ordered product to be shared among a maximum of 5 people within your organisation.
- Corporate License: Allows the product to be shared among all employees of your organisation regardless of their geographical location.
All our reports are typically be emailed to you as an attachment.
To order any available report you need to register on our website. The payment can be made either through CCAvenue or PayPal payments gateways which accept all international cards.
We extend our support to 6 months post sale. A post sale customization is also provided to cover your unmet needs in the report.
Request Customization
We offer complimentary customization of up to 15% with every purchase. To share your customization requirements, feel free to email us at info@strategymrc.com or call us on +1-301-202-5929. .
Please Note: Customization within the 15% threshold is entirely free of charge. If your request exceeds this limit, we will conduct a feasibility assessment. Following that, a detailed quote and timeline will be provided.
WHY CHOOSE US ?

Assured Quality
Best in class reports with high standard of research integrity

24X7 Research Support
Continuous support to ensure the best customer experience.

Free Customization
Adding more values to your product of interest.

Safe & Secure Access
Providing a secured environment for all online transactions.

Trusted by 600+ Brands
Serving the most reputed brands across the world.