
Sand Cone Density Apparatus Market
Sand Cone Density Apparatus Market Forecasts to 2030 - Global Analysis By Type (0 - 5 L and Above 5 L), Application (Road Construction, Civil Engineering Projects, Building Construction and Other Applications), and By Geography
|
Years Covered |
2021-2030 |
|
CAGR (2023 - 2030) |
6.0% |
|
Regions Covered |
North America, Europe, Asia Pacific, South America, and Middle East & Africa |
|
Countries Covered |
US, Canada, Mexico, Germany, UK, Italy, France, Spain, Japan, China, India, Australia, New Zealand, South Korea, Rest of Asia Pacific, South America, Argentina, Brazil, Chile, Middle East & Africa, Saudi Arabia, UAE, Qatar, and South Africa |
|
Largest Market |
Europe |
|
Highest Growing Market |
North America |
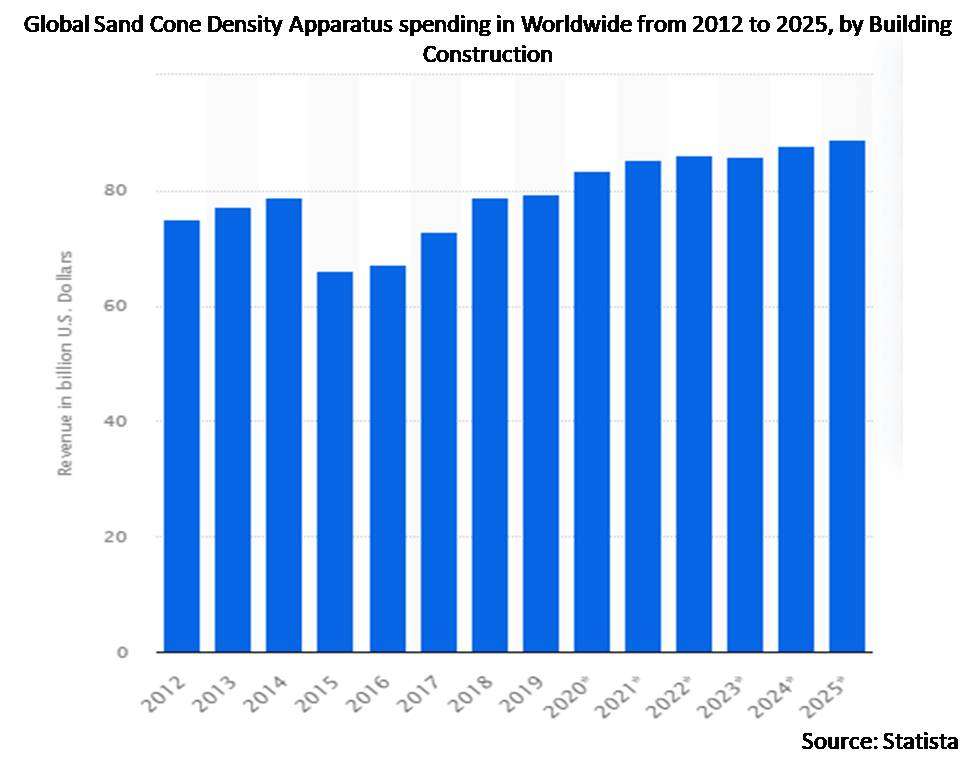
According to Stratistics MRC, the Global Sand Cone Density Apparatus Market is growing at a CAGR of 6.0% during the forecast period. The Sand Cone Density Apparatus is a field testing instrument used in geotechnical engineering to measure the in-place density of soil. It is commonly employed for quality control purposes during construction projects, particularly in road construction and foundation work. The process involves excavating a test hole in the ground and collecting the soil sample from the hole. Further, this method provides an indication of the in-situ density of the soil, which is crucial for assessing the compaction quality and ensuring that the soil meets the specified engineering requirements.
Market Dynamics:
Driver:
Government regulations and standards
In construction and civil engineering, adherence to specified guidelines is essential to ensuring the safety, reliability, and longevity of structures. Government regulations often mandate thorough soil density testing to assess the compaction of soil at construction sites. Furthermore, regulatory bodies, such as ASTM (American Society for Testing and Materials) and AASHTO (American Association of State Highway and Transportation Officials), define standards for soil compaction in construction projects. This ensures that construction projects align with safety and quality standards set by authorities, reducing the risk of structural failures and significantly driving market growth.
Restraint:
High initial costs
The instruments require a significant upfront investment, including the purchase of the apparatus itself, associated accessories, and sometimes specialized training for operators. Ongoing costs for calibration, maintenance, and potential repairs further contribute to the financial burden. Moreover, small or budget-constrained construction firms may find it challenging to allocate resources for such substantial capital expenses, impacting their overall market penetration.
Opportunity:
Construction and infrastructure development
The expansion of construction and infrastructure development activities is increasing globally for robust standards and specifications mandated by the growing number of construction projects. Construction projects, including roads, bridges, buildings, and other civil engineering endeavors, necessitate accurate soil density measurements to ensure structural stability and safety. Moreover, the apparatus is particularly crucial for projects in which soil compaction directly influences the structural integrity and performance of the built environment, thereby boosting this market.
Threat:
Shortage of qualified technicians
The shortage of qualified technicians limits the widespread adoption of the apparatus in construction projects. Without skilled operators, the accuracy and reliability of soil density measurements may be compromised, affecting the overall quality and safety of construction endeavors. Additionally, training programs to develop proficient technicians may be lacking or not readily accessible, further exacerbating the scarcity hampering this market size.
Covid-19 Impact
The COVID-19 pandemic has had a detrimental impact on the Sand Cone Density Apparatus Market. The global construction industry, a major consumer of this equipment, faced disruptions in project timelines and workforce availability due to lockdowns and social distancing measures. Travel restrictions and limitations on international trade further impeded the global supply chain, affecting the availability of raw materials and components. Additionally, economic uncertainties and reduced investments in infrastructure projects during the pandemic contributed to a decline in market growth.
The 0 - 5 L segment is expected to be the largest during the forecast period
The 0–5 L segment is estimated to hold the largest share due to its crucial role in geotechnical testing for smaller-scale projects and laboratory applications. Typically, the apparatus in this capacity range features a double-walled conical container with a precise valve mechanism at the apex, ensuring controlled sand release during testing. Moreover, engineers and geotechnical professionals often prefer the 0–5-liter Sand Cone Density Apparatus for its versatility in assessing the compaction characteristics of soils in small-scale construction projects, research studies, and quality control testing, thereby driving segment growth.
The road construction segment is expected to have the highest CAGR during the forecast period
The road construction segment is anticipated to have highest CAGR during the forecast period, due to a fundamental tool for ensuring the quality and stability of soil compaction, a critical aspect of road foundation construction. The compact and portable nature of these instruments allows for easy deployment at various locations along the road alignment. Furthermore, the controlled release of sand from the conical container facilitates accurate measurements, enabling engineers to evaluate the compaction levels and make informed decisions regarding further compaction efforts which are boosting this segment expansion.
Region with largest share:
Europe commanded the largest market share during the extrapolated period owing to the realm of geotechnical engineering and construction quality control. European construction projects, which are known for their adherence to stringent standards, benefit from the precision and reliability offered by the sand cone density apparatus. Moreover, its role in ensuring proper soil compaction contributes to the overall durability and stability of infrastructure projects throughout the region, which is propelling this market size.
Region with highest CAGR:
North America is expected to witness highest CAGR over the projection period. Infrastructure maintenance, upgrades, and new developments align well with the capabilities of the sand cone density apparatus in providing accurate in-situ density measurements. Some of the key market players reflect its significance in upholding construction quality and adherence to industry standards throughout the North American region. Therefore, the compact and portable design of these apparatuses facilitates their use in various terrains and construction sites, from urban developments to expansive transportation projects, boosting this region’s growth.

Key players in the market
Some of the key players in the Sand Cone Density Apparatus Market include Nova Engineering Works, Myers , Gilson Company, Inc., SN Scientific Solution, GlobeTrek Engineering Corporation, HïRA, Humboldt Mfg. Co., Forney LP, Aimil Ltd., Cooper Technology and Karol-Warner.
Key Developments:
In October 2023, The New Jersey Pride Chamber of Commerce (NJPCC), the Wayne-based LGBTQ+ business organization, is proud to announce its partnership with Bristol Myers Squibb (BMS), a global biopharmaceutical company which employs thousands of people at four major New Jersey campuses.
In May 2023, Mr. Cooper Group Inc. and Home Point Capital Inc. announced the signing of a definitive agreement for Mr. Cooper to acquire all outstanding shares of Home Point for approximately $324 million in cash.
Types Covered:
• 0 - 5 L
• Above 5 L
Applications Covered:
• Road Construction
• Civil Engineering Projects
• Building Construction
• Other Applications
Regions Covered:
• North America
o US
o Canada
o Mexico
• Europe
o Germany
o UK
o Italy
o France
o Spain
o Rest of Europe
• Asia Pacific
o Japan
o China
o India
o Australia
o New Zealand
o South Korea
o Rest of Asia Pacific
• South America
o Argentina
o Brazil
o Chile
o Rest of South America
• Middle East & Africa
o Saudi Arabia
o UAE
o Qatar
o South Africa
o Rest of Middle East & Africa
What our report offers:
- Market share assessments for the regional and country-level segments
- Strategic recommendations for the new entrants
- Covers Market data for the years 2021, 2022, 2023, 2026, and 2030
- Market Trends (Drivers, Constraints, Opportunities, Threats, Challenges, Investment Opportunities, and recommendations)
- Strategic recommendations in key business segments based on the market estimations
- Competitive landscaping mapping the key common trends
- Company profiling with detailed strategies, financials, and recent developments
- Supply chain trends mapping the latest technological advancements
Free Customization Offerings:
All the customers of this report will be entitled to receive one of the following free customization options:
• Company Profiling
o Comprehensive profiling of additional market players (up to 3)
o SWOT Analysis of key players (up to 3)
• Regional Segmentation
o Market estimations, Forecasts and CAGR of any prominent country as per the client's interest (Note: Depends on feasibility check)
• Competitive Benchmarking
Benchmarking of key players based on product portfolio, geographical presence, and strategic alliances
Table of Contents
1 Executive Summary
2 Preface
2.1 Abstract
2.2 Stake Holders
2.3 Research Scope
2.4 Research Methodology
2.4.1 Data Mining
2.4.2 Data Analysis
2.4.3 Data Validation
2.4.4 Research Approach
2.5 Research Sources
2.5.1 Primary Research Sources
2.5.2 Secondary Research Sources
2.5.3 Assumptions
3 Market Trend Analysis
3.1 Introduction
3.2 Drivers
3.3 Restraints
3.4 Opportunities
3.5 Threats
3.6 Application Analysis
3.7 Emerging Markets
3.8 Impact of Covid-19
4 Porters Five Force Analysis
4.1 Bargaining power of suppliers
4.2 Bargaining power of buyers
4.3 Threat of substitutes
4.4 Threat of new entrants
4.5 Competitive rivalry
5 Global Sand Cone Density Apparatus Market, By Type
5.1 Introduction
5.2 0 - 5 L
5.3 Above 5 L
6 Global Sand Cone Density Apparatus Market, By Application
6.1 Introduction
6.2 Road Construction
6.3 Civil Engineering Projects
6.4 Building Construction
6.5 Other Applications
7 Global Sand Cone Density Apparatus Market, By Geography
7.1 Introduction
7.2 North America
7.2.1 US
7.2.2 Canada
7.2.3 Mexico
7.3 Europe
7.3.1 Germany
7.3.2 UK
7.3.3 Italy
7.3.4 France
7.3.5 Spain
7.3.6 Rest of Europe
7.4 Asia Pacific
7.4.1 Japan
7.4.2 China
7.4.3 India
7.4.4 Australia
7.4.5 New Zealand
7.4.6 South Korea
7.4.7 Rest of Asia Pacific
7.5 South America
7.5.1 Argentina
7.5.2 Brazil
7.5.3 Chile
7.5.4 Rest of South America
7.6 Middle East & Africa
7.6.1 Saudi Arabia
7.6.2 UAE
7.6.3 Qatar
7.6.4 South Africa
7.6.5 Rest of Middle East & Africa
8 Key Developments
8.1 Agreements, Partnerships, Collaborations and Joint Ventures
8.2 Acquisitions & Mergers
8.3 New Product Launch
8.4 Expansions
8.5 Other Key Strategies
9 Company Profiling
9.1 Nova Engineering Works
9.2 Myers
9.3 Gilson Company, Inc.
9.4 SN Scientific Solution
9.5 GlobeTrek Engineering Corporation
9.6 HïRA
9.7 Humboldt Mfg. Co.
9.8 Forney LP
9.9 Aimil Ltd.
9.10 Cooper Technology
9.11 Karol-Warner
List of Tables
1 Global Sand Cone Density Apparatus Market Outlook, By Region (2021-2030) ($MN)
2 Global Sand Cone Density Apparatus Market Outlook, By Type (2021-2030) ($MN)
3 Global Sand Cone Density Apparatus Market Outlook, By 0 - 5 L (2021-2030) ($MN)
4 Global Sand Cone Density Apparatus Market Outlook, By Above 5 L (2021-2030) ($MN)
5 Global Sand Cone Density Apparatus Market Outlook, By Application (2021-2030) ($MN)
6 Global Sand Cone Density Apparatus Market Outlook, By Road Construction (2021-2030) ($MN)
7 Global Sand Cone Density Apparatus Market Outlook, By Civil Engineering Projects (2021-2030) ($MN)
8 Global Sand Cone Density Apparatus Market Outlook, By Building Construction (2021-2030) ($MN)
9 Global Sand Cone Density Apparatus Market Outlook, By Other Applications (2021-2030) ($MN)
10 North America Sand Cone Density Apparatus Market Outlook, By Country (2021-2030) ($MN)
7 North America Sand Cone Density Apparatus Market Outlook, By Type (2021-2030) ($MN)
8 North America Sand Cone Density Apparatus Market Outlook, By 0 - 5 L (2021-2030) ($MN)
9 North America Sand Cone Density Apparatus Market Outlook, By Above 5 L (2021-2030) ($MN)
14 North America Sand Cone Density Apparatus Market Outlook, By Application (2021-2030) ($MN)
15 North America Sand Cone Density Apparatus Market Outlook, By Road Construction (2021-2030) ($MN)
16 North America Sand Cone Density Apparatus Market Outlook, By Civil Engineering Projects (2021-2030) ($MN)
17 North America Sand Cone Density Apparatus Market Outlook, By Building Construction (2021-2030) ($MN)
18 North America Sand Cone Density Apparatus Market Outlook, By Other Applications (2021-2030) ($MN)
19 Europe Sand Cone Density Apparatus Market Outlook, By Country (2021-2030) ($MN)
20 Europe Sand Cone Density Apparatus Market Outlook, By Type (2021-2030) ($MN)
21 Europe Sand Cone Density Apparatus Market Outlook, By 0 - 5 L (2021-2030) ($MN)
22 Europe Sand Cone Density Apparatus Market Outlook, By Above 5 L (2021-2030) ($MN)
23 Europe Sand Cone Density Apparatus Market Outlook, By Application (2021-2030) ($MN)
24 Europe Sand Cone Density Apparatus Market Outlook, By Road Construction (2021-2030) ($MN)
25 Europe Sand Cone Density Apparatus Market Outlook, By Civil Engineering Projects (2021-2030) ($MN)
26 Europe Sand Cone Density Apparatus Market Outlook, By Building Construction (2021-2030) ($MN)
27 Europe Sand Cone Density Apparatus Market Outlook, By Other Applications (2021-2030) ($MN)
28 Asia Pacific Sand Cone Density Apparatus Market Outlook, By Country (2021-2030) ($MN)
29 Asia Pacific Sand Cone Density Apparatus Market Outlook, By Type (2021-2030) ($MN)
30 Asia Pacific Sand Cone Density Apparatus Market Outlook, By 0 - 5 L (2021-2030) ($MN)
31 Asia Pacific Sand Cone Density Apparatus Market Outlook, By Above 5 L (2021-2030) ($MN)
32 Asia Pacific Sand Cone Density Apparatus Market Outlook, By Application (2021-2030) ($MN)
33 Asia Pacific Sand Cone Density Apparatus Market Outlook, By Road Construction (2021-2030) ($MN)
34 Asia Pacific Sand Cone Density Apparatus Market Outlook, By Civil Engineering Projects (2021-2030) ($MN)
35 Asia Pacific Sand Cone Density Apparatus Market Outlook, By Building Construction (2021-2030) ($MN)
36 Asia Pacific Sand Cone Density Apparatus Market Outlook, By Other Applications (2021-2030) ($MN)
37 South America Sand Cone Density Apparatus Market Outlook, By Country (2021-2030) ($MN)
38 South America Sand Cone Density Apparatus Market Outlook, By Type (2021-2030) ($MN)
39 South America Sand Cone Density Apparatus Market Outlook, By 0 - 5 L (2021-2030) ($MN)
40 South America Sand Cone Density Apparatus Market Outlook, By Above 5 L (2021-2030) ($MN)
41 South America Sand Cone Density Apparatus Market Outlook, By Application (2021-2030) ($MN)
42 South America Sand Cone Density Apparatus Market Outlook, By Road Construction (2021-2030) ($MN)
43 South America Sand Cone Density Apparatus Market Outlook, By Civil Engineering Projects (2021-2030) ($MN)
44 South America Sand Cone Density Apparatus Market Outlook, By Building Construction (2021-2030) ($MN)
45 South America Sand Cone Density Apparatus Market Outlook, By Other Applications (2021-2030) ($MN)
46 Middle East & Africa Sand Cone Density Apparatus Market Outlook, By Country (2021-2030) ($MN)
47 Middle East & Africa Sand Cone Density Apparatus Market Outlook, By Type (2021-2030) ($MN)
48 Middle East & Africa Sand Cone Density Apparatus Market Outlook, By 0 - 5 L (2021-2030) ($MN)
49 Middle East & Africa Sand Cone Density Apparatus Market Outlook, By Above 5 L (2021-2030) ($MN)
50 Middle East & Africa Sand Cone Density Apparatus Market Outlook, By Application (2021-2030) ($MN)
51 Middle East & Africa Sand Cone Density Apparatus Market Outlook, By Road Construction (2021-2030) ($MN)
52 Middle East & Africa Sand Cone Density Apparatus Market Outlook, By Civil Engineering Projects (2021-2030) ($MN)
53 Middle East & Africa Sand Cone Density Apparatus Market Outlook, By Building Construction (2021-2030) ($MN)
54 Middle East & Africa Sand Cone Density Apparatus Market Outlook, By Other Applications (2021-2030) ($MN)
List of Figures
RESEARCH METHODOLOGY

We at ‘Stratistics’ opt for an extensive research approach which involves data mining, data validation, and data analysis. The various research sources include in-house repository, secondary research, competitor’s sources, social media research, client internal data, and primary research.
Our team of analysts prefers the most reliable and authenticated data sources in order to perform the comprehensive literature search. With access to most of the authenticated data bases our team highly considers the best mix of information through various sources to obtain extensive and accurate analysis.
Each report takes an average time of a month and a team of 4 industry analysts. The time may vary depending on the scope and data availability of the desired market report. The various parameters used in the market assessment are standardized in order to enhance the data accuracy.
Data Mining
The data is collected from several authenticated, reliable, paid and unpaid sources and is filtered depending on the scope & objective of the research. Our reports repository acts as an added advantage in this procedure. Data gathering from the raw material suppliers, distributors and the manufacturers is performed on a regular basis, this helps in the comprehensive understanding of the products value chain. Apart from the above mentioned sources the data is also collected from the industry consultants to ensure the objective of the study is in the right direction.
Market trends such as technological advancements, regulatory affairs, market dynamics (Drivers, Restraints, Opportunities and Challenges) are obtained from scientific journals, market related national & international associations and organizations.
Data Analysis
From the data that is collected depending on the scope & objective of the research the data is subjected for the analysis. The critical steps that we follow for the data analysis include:
- Product Lifecycle Analysis
- Competitor analysis
- Risk analysis
- Porters Analysis
- PESTEL Analysis
- SWOT Analysis
The data engineering is performed by the core industry experts considering both the Marketing Mix Modeling and the Demand Forecasting. The marketing mix modeling makes use of multiple-regression techniques to predict the optimal mix of marketing variables. Regression factor is based on a number of variables and how they relate to an outcome such as sales or profits.
Data Validation
The data validation is performed by the exhaustive primary research from the expert interviews. This includes telephonic interviews, focus groups, face to face interviews, and questionnaires to validate our research from all aspects. The industry experts we approach come from the leading firms, involved in the supply chain ranging from the suppliers, distributors to the manufacturers and consumers so as to ensure an unbiased analysis.
We are in touch with more than 15,000 industry experts with the right mix of consultants, CEO's, presidents, vice presidents, managers, experts from both supply side and demand side, executives and so on.
The data validation involves the primary research from the industry experts belonging to:
- Leading Companies
- Suppliers & Distributors
- Manufacturers
- Consumers
- Industry/Strategic Consultants
Apart from the data validation the primary research also helps in performing the fill gap research, i.e. providing solutions for the unmet needs of the research which helps in enhancing the reports quality.
For more details about research methodology, kindly write to us at info@strategymrc.com
Frequently Asked Questions
In case of any queries regarding this report, you can contact the customer service by filing the “Inquiry Before Buy” form available on the right hand side. You may also contact us through email: info@strategymrc.com or phone: +1-301-202-5929
Yes, the samples are available for all the published reports. You can request them by filling the “Request Sample” option available in this page.
Yes, you can request a sample with your specific requirements. All the customized samples will be provided as per the requirement with the real data masked.
All our reports are available in Digital PDF format. In case if you require them in any other formats, such as PPT, Excel etc you can submit a request through “Inquiry Before Buy” form available on the right hand side. You may also contact us through email: info@strategymrc.com or phone: +1-301-202-5929
We offer a free 15% customization with every purchase. This requirement can be fulfilled for both pre and post sale. You may send your customization requirements through email at info@strategymrc.com or call us on +1-301-202-5929.
We have 3 different licensing options available in electronic format.
- Single User Licence: Allows one person, typically the buyer, to have access to the ordered product. The ordered product cannot be distributed to anyone else.
- 2-5 User Licence: Allows the ordered product to be shared among a maximum of 5 people within your organisation.
- Corporate License: Allows the product to be shared among all employees of your organisation regardless of their geographical location.
All our reports are typically be emailed to you as an attachment.
To order any available report you need to register on our website. The payment can be made either through CCAvenue or PayPal payments gateways which accept all international cards.
We extend our support to 6 months post sale. A post sale customization is also provided to cover your unmet needs in the report.
Request Customization
We offer complimentary customization of up to 15% with every purchase. To share your customization requirements, feel free to email us at info@strategymrc.com or call us on +1-301-202-5929. .
Please Note: Customization within the 15% threshold is entirely free of charge. If your request exceeds this limit, we will conduct a feasibility assessment. Following that, a detailed quote and timeline will be provided.
WHY CHOOSE US ?

Assured Quality
Best in class reports with high standard of research integrity

24X7 Research Support
Continuous support to ensure the best customer experience.

Free Customization
Adding more values to your product of interest.

Safe & Secure Access
Providing a secured environment for all online transactions.

Trusted by 600+ Brands
Serving the most reputed brands across the world.