
Security Labels Market
Security Labels Market Forecasts to 2030 - Global Analysis By Product (Holographic Labels, Barcode, Quick Response (QR) Code, Radio Frequency Identification (RFID), Electronic Article Surveillance (EAS), Near Field Communication (NFC) and Other Products), Type (Informative, Identification and Branding), Form, Material, Pattern, Application, End User and By Geography

|
Years Covered |
2021-2030 |
|
Estimated Year Value (2023) |
US $32.51 BN |
|
Projected Year Value (2030) |
US $52.55 BN |
|
CAGR (2023 - 2030) |
7.1% |
|
Regions Covered |
North America, Europe, Asia Pacific, South America, and Middle East & Africa |
|
Countries Covered |
US, Canada, Mexico, Germany, UK, Italy, France, Spain, Japan, China, India, Australia, New Zealand, South Korea, Rest of Asia Pacific, South America, Argentina, Brazil, Chile, Middle East & Africa, Saudi Arabia, UAE, Qatar, and South Africa |
|
Largest Market |
Asia Pacific |
|
Highest Growing Market |
North America |
According to Stratistics MRC, the Global Security Labels Market is accounted for $32.51 billion in 2023 and is expected to reach $52.55 billion by 2030 growing at a CAGR of 7.1% during the forecast period. Security labels, also known as tamper-evident labels or security seals, are specialized labels designed to provide visual evidence of tampering or unauthorized access to a product or package. They are used in various industries to protect the integrity of goods during transit, storage, or display. Some labels may have additional security features like UV printing, microprinting, or special inks that are only visible under certain conditions.
According to an IBM study, 71% of consumers are ready to pay an additional average premium of 37% for companies providing full transparency and traceability.
Market Dynamics:
Driver:
Increasing concerns about counterfeiting & tampering
Many industries such as pharmaceuticals, electronics, and automotive are subjected to strict regulatory requirements regarding labeling and product authentication. Counterfeiting can lead to significant financial losses for businesses. Security labels that comply with these regulations are essential for companies to operate legally and avoid potential penalties. Overall, the increasing concerns about counterfeiting and tampering highlight the critical need for effective security labeling solutions. This drives businesses to invest in advanced security features and technologies, creating a growing market for security labels.
Restraint:
Cost constraints
In a competitive market, businesses may face pressure to keep prices low to remain competitive. This may cause resources for premium security labels to be reluctantly allocated. Complying with industry-specific labeling regulations and laws can also be expensive. Producers of security labels could encounter demands to preserve sound profit margins while satisfying customers' pricing demands. Thus, market fragmentation may arise as a result of security label costs.
Opportunity:
Growth in industries requiring high-level security
Industries that deal with sensitive information or high-value assets, such as government, defense, pharmaceuticals, and finance, have a heightened need for security measures. This includes the use of security labels to ensure that products, documents, or assets remain protected and tamper-evident. High-security industries often have strong brands and reputations to uphold. Security labels can serve as a visual indicator of a brand's commitment to quality and security, instilling trust in customers and partners. Additionally, the advancements in technologies are fuelling the market demand.
Threat:
Cybersecurity concerns
Cybersecurity concerns with security labeling primarily revolve around the potential vulnerabilities or risks associated with the digital components or data linked to the labels. If security labels are linked to digital databases or systems, there is a risk of a data breach. If data associated with security labels is not properly encrypted, it could be intercepted and accessed by unauthorized parties during transmission. Further, it can also provide access to unauthorized users. Additionally, concerns such as data integrity concerns, insider threats, phishing attacks and vulnerabilities in software are hampering the market growth.
Covid-19 Impact
The COVID-19 pandemic had a notable impact on the security labels market. The demand for certain types of security labels altered during the pandemic. The pandemic heightened the focus on health and safety measures, which could have led to an increased demand for security labels that are used to indicate tampering or guarantee product integrity, especially in the food and pharmaceutical industries. With restrictions on physical retail locations and an increase in online shopping, there was a surge in demand for secure packaging and labeling solutions, including security labels. Further, the pandemic have accelerated the adoption of digital and advanced technologies in the security labels market.
The quick response (QR) code segment is expected to be the largest during the forecast period
The quick response (QR) code segment is estimated to have a lucrative growth. QR codes are two-dimensional barcodes that can store a variety of information. They can be encoded with unique information related to a product, such as a serial number, batch code, or other identifying information. This allows consumers, retailers, and inspectors to verify the authenticity of the product by scanning the QR code. QR codes are relatively inexpensive to implement and print compared to some other advanced security features. They are also easily scanned using smart phones, which are nearly ubiquitous in today's society.
The customized patterns segment is expected to have the highest CAGR during the forecast period
The customized patterns segment is anticipated to witness the highest CAGR growth during the forecast period. Customized patterns can be designed to be visually distinct, making it easier to detect. They can incorporate unique elements related to a brand, such as logos, colors, or proprietary designs. This helps customers easily recognize genuine products, providing a means of authentication. The presence of a customized security label can instill confidence in consumers, assuring them that the product is genuine, safe, and has not been tampered with during transit or storage.
Region with largest share:
Asia Pacific is projected to hold the largest market share during the forecast period owing to increasing awareness about product authenticity, raising incidents of counterfeiting, and the implementation of stringent government regulations. The pharmaceutical & food and beverage industries are significant end-users of security labels in this region. Further, countries like China, India, and Southeast Asian nations were witnessing significant growth in the security labels market due to rapid industrialization, increasing consumer awareness, and a growing middle-class population.
Region with highest CAGR:
North America is projected to have the highest CAGR over the forecast period. The North American security labels market was one of the largest and most mature markets globally. The North American market was characterized by a high level of technological sophistication. The market was highly competitive with several key players in the region, including 3M Company, Avery Dennison Corporation, UPM Raflatac, CCL Industries Inc., and others. Moreover, sustainability and eco-friendly labeling solutions were gaining traction in the North American market.

Key players in the market
Some of the key players profiled in the Security Labels Market include Zebra Technologies Corporation, Honeywell International Inc., The 3M Company, Covectra Inc., CCL Industries Inc., Thinfilm Electronics AS, Brady Corporation, UPM Raflatac, Invengo Technology Limited, Avery Dennison Corporation, Smartrac Group, Mega Fortris Group, Sato Holdings Corporation, Muehlbauer Holding AG, Tesa SE, Data Label, Tamperguard and CILS International.
Key Developments:
In October 2023, Honeywell launched Cyber Watch, a breakthrough enterprise solution designed to help organizations better identify, mitigate and manage the latest Operational Technology (OT) cyber threats.
In February 2023, 3M unveils its new medical adhesive that can stick to the skin for up to 28 days and is intended for use with a wide array of health monitors, sensors, and long-term medical wearables.
Products Covered:
• Holographic Labels
• Barcode
• Quick Response (QR) Code
• Radio Frequency Identification (RFID)
• Electronic Article Surveillance (EAS)
• Near Field Communication (NFC)
• Other Products
Types Covered:
• Informative
• Identification
• Branding
Forms Covered:
• Sheet
• Reel
Materials Covered:
• Paper
• Foil
• Plastic
• Other Materials
Patterns Covered:
• Destructible
• Void
• Checkboard
• Customized Patterns
• Other Patterns
Applications Covered:
• Bags & Pouches
• Boxes & Cartons
• Bottles & Jars
• Drums
• Intermediate Bulk Containers (IBCs)
• Other Applications
End Users Covered:
• Cosmetics Industry
• Food & Beverage Industry
• Pharmaceutical Industry
• Chemicals & Fertilizers Industry
• Electrical & Electronics Industry
• Other End Users
Regions Covered:
• North America
o US
o Canada
o Mexico
• Europe
o Germany
o UK
o Italy
o France
o Spain
o Rest of Europe
• Asia Pacific
o Japan
o China
o India
o Australia
o New Zealand
o South Korea
o Rest of Asia Pacific
• South America
o Argentina
o Brazil
o Chile
o Rest of South America
• Middle East & Africa
o Saudi Arabia
o UAE
o Qatar
o South Africa
o Rest of Middle East & Africa
What our report offers:
- Market share assessments for the regional and country-level segments
- Strategic recommendations for the new entrants
- Covers Market data for the years 2021, 2022, 2023, 2026, and 2030
- Market Trends (Drivers, Constraints, Opportunities, Threats, Challenges, Investment Opportunities, and recommendations)
- Strategic recommendations in key business segments based on the market estimations
- Competitive landscaping mapping the key common trends
- Company profiling with detailed strategies, financials, and recent developments
- Supply chain trends mapping the latest technological advancements
Free Customization Offerings:
All the customers of this report will be entitled to receive one of the following free customization options:
• Company Profiling
o Comprehensive profiling of additional market players (up to 3)
o SWOT Analysis of key players (up to 3)
• Regional Segmentation
o Market estimations, Forecasts and CAGR of any prominent country as per the client's interest (Note: Depends on feasibility check)
• Competitive Benchmarking
o Benchmarking of key players based on product portfolio, geographical presence, and strategic alliances
Table of Contents
1 Executive Summary
2 Preface
2.1 Abstract
2.2 Stake Holders
2.3 Research Scope
2.4 Research Methodology
2.4.1 Data Mining
2.4.2 Data Analysis
2.4.3 Data Validation
2.4.4 Research Approach
2.5 Research Sources
2.5.1 Primary Research Sources
2.5.2 Secondary Research Sources
2.5.3 Assumptions
3 Market Trend Analysis
3.1 Introduction
3.2 Drivers
3.3 Restraints
3.4 Opportunities
3.5 Threats
3.6 Product Analysis
3.7 Application Analysis
3.8 End User Analysis
3.9 Emerging Markets
3.10 Impact of Covid-19
4 Porters Five Force Analysis
4.1 Bargaining power of suppliers
4.2 Bargaining power of buyers
4.3 Threat of substitutes
4.4 Threat of new entrants
4.5 Competitive rivalry
5 Global Security Labels Market, By Product
5.1 Introduction
5.2 Holographic Labels
5.3 Barcode
5.4 Quick Response (QR) Code
5.5 Radio Frequency Identification (RFID)
5.6 Electronic Article Surveillance (EAS)
5.7 Near Field Communication (NFC)
5.8 Other Products
6 Global Security Labels Market, By Type
6.1 Introduction
6.2 Informative
6.3 Identification
6.4 Branding
7 Global Security Labels Market, By Form
7.1 Introduction
7.2 Sheet
7.3 Reel
8 Global Security Labels Market, By Material
8.1 Introduction
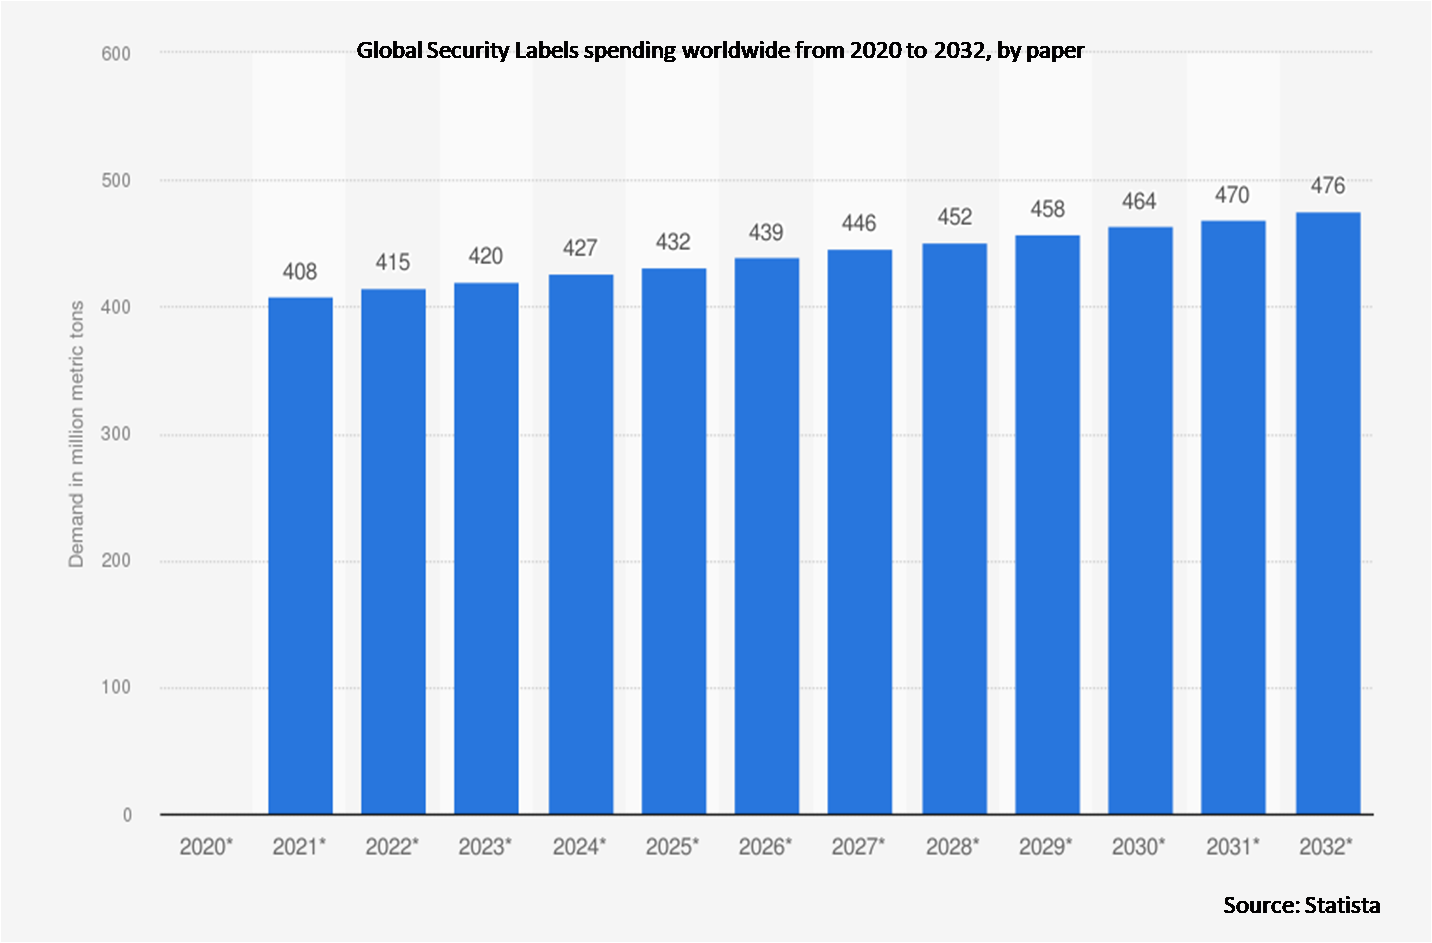
8.2 Paper
8.3 Foil
8.4 Plastic
8.4.1 Polyester
8.4.2 Vinyl
8.4.3 Polypropylene
8.5 Other Materials
9 Global Security Labels Market, By Pattern
9.1 Introduction
9.2 Destructible
9.3 Void
9.4 Checkboard
9.5 Customized Patterns
9.6 Other Patterns
10 Global Security Labels Market, By Application
10.1 Introduction
10.2 Bags & Pouches
10.3 Boxes & Cartons
10.4 Bottles & Jars
10.5 Drums
10.6 Intermediate Bulk Containers (IBCs)
10.7 Other Applications
11 Global Security Labels Market, By End User
11.1 Introduction
11.2 Cosmetics Industry
11.3 Food & Beverage Industry
11.4 Pharmaceutical Industry
11.5 Chemicals & Fertilizers Industry
11.6 Electrical & Electronics Industry
11.7 Other End Users
12 Global Security Labels Market, By Geography
12.1 Introduction
12.2 North America
12.2.1 US
12.2.2 Canada
12.2.3 Mexico
12.3 Europe
12.3.1 Germany
12.3.2 UK
12.3.3 Italy
12.3.4 France
12.3.5 Spain
12.3.6 Rest of Europe
12.4 Asia Pacific
12.4.1 Japan
12.4.2 China
12.4.3 India
12.4.4 Australia
12.4.5 New Zealand
12.4.6 South Korea
12.4.7 Rest of Asia Pacific
12.5 South America
12.5.1 Argentina
12.5.2 Brazil
12.5.3 Chile
12.5.4 Rest of South America
12.6 Middle East & Africa
12.6.1 Saudi Arabia
12.6.2 UAE
12.6.3 Qatar
12.6.4 South Africa
12.6.5 Rest of Middle East & Africa
13 Key Developments
13.1 Agreements, Partnerships, Collaborations and Joint Ventures
13.2 Acquisitions & Mergers
13.3 New Product Launch
13.4 Expansions
13.5 Other Key Strategies
14 Company Profiling
14.1 Zebra Technologies Corporation
14.2 Honeywell International Inc.
14.3 The 3M Company
14.4 Covectra Inc.
14.5 CCL Industries Inc.
14.6 Thinfilm Electronics AS
14.7 Brady Corporation
14.8 UPM Raflatac
14.9 Invengo Technology Limited
14.10 Avery Dennison Corporation
14.11 Smartrac Group
14.12 Mega Fortris Group
14.13 Sato Holdings Corporation
14.14 Muehlbauer Holding AG
14.15 Tesa SE
14.16 Data Label
14.17 Tamperguard
14.18 CILS International
List of Tables
1 Global Security Labels Market Outlook, By Region (2021-2030) ($MN)
2 Global Security Labels Market Outlook, By Product (2021-2030) ($MN)
3 Global Security Labels Market Outlook, By Holographic Labels (2021-2030) ($MN)
4 Global Security Labels Market Outlook, By Barcode (2021-2030) ($MN)
5 Global Security Labels Market Outlook, By Quick Response (QR) Code (2021-2030) ($MN)
6 Global Security Labels Market Outlook, By Radio Frequency Identification (RFID) (2021-2030) ($MN)
7 Global Security Labels Market Outlook, By Electronic Article Surveillance (EAS) (2021-2030) ($MN)
8 Global Security Labels Market Outlook, By Near Field Communication (NFC) (2021-2030) ($MN)
9 Global Security Labels Market Outlook, By Other Products (2021-2030) ($MN)
10 Global Security Labels Market Outlook, By Type (2021-2030) ($MN)
11 Global Security Labels Market Outlook, By Informative (2021-2030) ($MN)
12 Global Security Labels Market Outlook, By Identification (2021-2030) ($MN)
13 Global Security Labels Market Outlook, By Branding (2021-2030) ($MN)
14 Global Security Labels Market Outlook, By Form (2021-2030) ($MN)
15 Global Security Labels Market Outlook, By Sheet (2021-2030) ($MN)
16 Global Security Labels Market Outlook, By Reel (2021-2030) ($MN)
17 Global Security Labels Market Outlook, By Material (2021-2030) ($MN)
18 Global Security Labels Market Outlook, By Paper (2021-2030) ($MN)
19 Global Security Labels Market Outlook, By Foil (2021-2030) ($MN)
20 Global Security Labels Market Outlook, By Plastic (2021-2030) ($MN)
21 Global Security Labels Market Outlook, By Polyester (2021-2030) ($MN)
22 Global Security Labels Market Outlook, By Vinyl (2021-2030) ($MN)
23 Global Security Labels Market Outlook, By Polypropylene (2021-2030) ($MN)
24 Global Security Labels Market Outlook, By Other Materials (2021-2030) ($MN)
25 Global Security Labels Market Outlook, By Pattern (2021-2030) ($MN)
26 Global Security Labels Market Outlook, By Destructible (2021-2030) ($MN)
27 Global Security Labels Market Outlook, By Void (2021-2030) ($MN)
28 Global Security Labels Market Outlook, By Checkboard (2021-2030) ($MN)
29 Global Security Labels Market Outlook, By Customized Patterns (2021-2030) ($MN)
30 Global Security Labels Market Outlook, By Other Patterns (2021-2030) ($MN)
31 Global Security Labels Market Outlook, By Application (2021-2030) ($MN)
32 Global Security Labels Market Outlook, By Bags & Pouches (2021-2030) ($MN)
33 Global Security Labels Market Outlook, By Boxes & Cartons (2021-2030) ($MN)
34 Global Security Labels Market Outlook, By Bottles & Jars (2021-2030) ($MN)
35 Global Security Labels Market Outlook, By Drums (2021-2030) ($MN)
36 Global Security Labels Market Outlook, By Intermediate Bulk Containers (IBCs) (2021-2030) ($MN)
37 Global Security Labels Market Outlook, By Other Applications (2021-2030) ($MN)
38 Global Security Labels Market Outlook, By End User (2021-2030) ($MN)
39 Global Security Labels Market Outlook, By Cosmetics Industry (2021-2030) ($MN)
40 Global Security Labels Market Outlook, By Food & Beverage Industry (2021-2030) ($MN)
41 Global Security Labels Market Outlook, By Pharmaceutical Industry (2021-2030) ($MN)
42 Global Security Labels Market Outlook, By Chemicals & Fertilizers Industry (2021-2030) ($MN)
43 Global Security Labels Market Outlook, By Electrical & Electronics Industry (2021-2030) ($MN)
44 Global Security Labels Market Outlook, By Other End Users (2021-2030) ($MN)
Note: Tables for North America, Europe, APAC, South America, and Middle East & Africa Regions are also represented in the same manner as above.
List of Figures
RESEARCH METHODOLOGY

We at ‘Stratistics’ opt for an extensive research approach which involves data mining, data validation, and data analysis. The various research sources include in-house repository, secondary research, competitor’s sources, social media research, client internal data, and primary research.
Our team of analysts prefers the most reliable and authenticated data sources in order to perform the comprehensive literature search. With access to most of the authenticated data bases our team highly considers the best mix of information through various sources to obtain extensive and accurate analysis.
Each report takes an average time of a month and a team of 4 industry analysts. The time may vary depending on the scope and data availability of the desired market report. The various parameters used in the market assessment are standardized in order to enhance the data accuracy.
Data Mining
The data is collected from several authenticated, reliable, paid and unpaid sources and is filtered depending on the scope & objective of the research. Our reports repository acts as an added advantage in this procedure. Data gathering from the raw material suppliers, distributors and the manufacturers is performed on a regular basis, this helps in the comprehensive understanding of the products value chain. Apart from the above mentioned sources the data is also collected from the industry consultants to ensure the objective of the study is in the right direction.
Market trends such as technological advancements, regulatory affairs, market dynamics (Drivers, Restraints, Opportunities and Challenges) are obtained from scientific journals, market related national & international associations and organizations.
Data Analysis
From the data that is collected depending on the scope & objective of the research the data is subjected for the analysis. The critical steps that we follow for the data analysis include:
- Product Lifecycle Analysis
- Competitor analysis
- Risk analysis
- Porters Analysis
- PESTEL Analysis
- SWOT Analysis
The data engineering is performed by the core industry experts considering both the Marketing Mix Modeling and the Demand Forecasting. The marketing mix modeling makes use of multiple-regression techniques to predict the optimal mix of marketing variables. Regression factor is based on a number of variables and how they relate to an outcome such as sales or profits.
Data Validation
The data validation is performed by the exhaustive primary research from the expert interviews. This includes telephonic interviews, focus groups, face to face interviews, and questionnaires to validate our research from all aspects. The industry experts we approach come from the leading firms, involved in the supply chain ranging from the suppliers, distributors to the manufacturers and consumers so as to ensure an unbiased analysis.
We are in touch with more than 15,000 industry experts with the right mix of consultants, CEO's, presidents, vice presidents, managers, experts from both supply side and demand side, executives and so on.
The data validation involves the primary research from the industry experts belonging to:
- Leading Companies
- Suppliers & Distributors
- Manufacturers
- Consumers
- Industry/Strategic Consultants
Apart from the data validation the primary research also helps in performing the fill gap research, i.e. providing solutions for the unmet needs of the research which helps in enhancing the reports quality.
For more details about research methodology, kindly write to us at info@strategymrc.com
Frequently Asked Questions
In case of any queries regarding this report, you can contact the customer service by filing the “Inquiry Before Buy” form available on the right hand side. You may also contact us through email: info@strategymrc.com or phone: +1-301-202-5929
Yes, the samples are available for all the published reports. You can request them by filling the “Request Sample” option available in this page.
Yes, you can request a sample with your specific requirements. All the customized samples will be provided as per the requirement with the real data masked.
All our reports are available in Digital PDF format. In case if you require them in any other formats, such as PPT, Excel etc you can submit a request through “Inquiry Before Buy” form available on the right hand side. You may also contact us through email: info@strategymrc.com or phone: +1-301-202-5929
We offer a free 15% customization with every purchase. This requirement can be fulfilled for both pre and post sale. You may send your customization requirements through email at info@strategymrc.com or call us on +1-301-202-5929.
We have 3 different licensing options available in electronic format.
- Single User Licence: Allows one person, typically the buyer, to have access to the ordered product. The ordered product cannot be distributed to anyone else.
- 2-5 User Licence: Allows the ordered product to be shared among a maximum of 5 people within your organisation.
- Corporate License: Allows the product to be shared among all employees of your organisation regardless of their geographical location.
All our reports are typically be emailed to you as an attachment.
To order any available report you need to register on our website. The payment can be made either through CCAvenue or PayPal payments gateways which accept all international cards.
We extend our support to 6 months post sale. A post sale customization is also provided to cover your unmet needs in the report.
Request Customization
We offer complimentary customization of up to 15% with every purchase. To share your customization requirements, feel free to email us at info@strategymrc.com or call us on +1-301-202-5929. .
Please Note: Customization within the 15% threshold is entirely free of charge. If your request exceeds this limit, we will conduct a feasibility assessment. Following that, a detailed quote and timeline will be provided.
WHY CHOOSE US ?

Assured Quality
Best in class reports with high standard of research integrity

24X7 Research Support
Continuous support to ensure the best customer experience.

Free Customization
Adding more values to your product of interest.

Safe & Secure Access
Providing a secured environment for all online transactions.

Trusted by 600+ Brands
Serving the most reputed brands across the world.