
Semiconductor Gases Market
Semiconductor Gases Market Forecasts to 2028 - Global Analysis By Product (Electronic Bulk Gas, Electronic Special Gas and Other Products), Application (Logic, Memory and Other Applications) and By Geography

|
Years Covered |
2020-2028 |
|
Estimated Year Value (2022) |
US $9.53 BN |
|
Projected Year Value (2028) |
US $16.44 BN |
|
CAGR (2022 - 2028) |
9.51% |
|
Regions Covered |
North America, Europe, Asia Pacific, South America, and Middle East & Africa |
|
Countries Covered |
US, Canada, Mexico, Germany, UK, Italy, France, Spain, Japan, China, India, Australia, New Zealand, South Korea, Rest of Asia Pacific, South America, Argentina, Brazil, Chile, Middle East & Africa, Saudi Arabia, UAE, Qatar, and South Africa |
|
Largest Market |
Asia Pacific |
|
Highest Growing Market |
Europe |
According to Stratistics MRC, the Global Semiconductor Gases Market is accounted for $9.53 billion in 2022 and is expected to reach $16.44 billion by 2028 growing at a CAGR of 9.51% during the forecast period. Semiconductor gases are gases which are used to manufacture semiconductors. It is a material having property in between an insulator and most metals. The high-quality semiconductor gases are often used in electronic semiconductor manufacturing in order to maintain operations in a clean and efficiently manner. Nitrogen and Helium are the most used gases. Solar photovoltaic devices, micro-electromechanical systems and electronic products are creating a lucrative opportunity for semiconductor gases.
According to the Electronics and IT Ministry of India, semiconductor demand in India would increase to $70-$80 billion by 2026 with the growing demand for digital devices and electronic products. India’s $10 billion chip-making initiative for the development of a semiconductor and display manufacturing ecosystem in the country is attracting more investors.
Market Dynamics:
Driver:
Increasing consumer electronics
Consumer electronics such as smart phones, tablets and wearable electronics are now significantly more accessible to the general public because to the recent rapid advancements in technology. A larger acceptance of these consumer electronics is increasing the demand of the semiconductors. Adoption of smart interconnected household electronics that have integrated advanced technologies such as machine learning and AI are benefiting semiconductors gases and fuelling the market growth.
Restraint:
Strict regulations
Gases used in the fabrication of semiconductors are the worst polluting materials and hazardous to individuals and the environment. Government across the globe are enforcing stringent standards to limit hazardous greenhouse gases emitted during semiconductor production owing to rising concerns for environmental and public health. These new standards affect the company’s profit. Adoption of stricter health and environmental regulations is hindering the market growth.
Opportunity:
Rising demand for electric vehicles
The semiconductors have become a prevalent part of modern life and are at the centre of any technology that enables today’s electronic devices. The number of electronic components such as sensors, touch screens, processors and micro controllers in electric vehicles is generally high compared to conventional IC powered vehicles. These factors provide an exponential boost to semiconductor manufacturing market.
Threat:
Rising environmental concerns
Fluorinated gases are widely used during manufacturing steps such as chemical vapour deposition and chamber cleaning. The hazards associated with these type of gases can cause fire explosion and contamination. It imposes threat on workers health. It can cause accidental damage to the workplace. This translates to the additional costs to treat gas emissions which hamper the growth of the market.
Covid-19 Impact
The lockdown limitations implemented by numerous nations throughout the world disrupted the semiconductor industry's supply chain. Lack of raw materials has led to delays in logistics and other unnoticed problems. Despite the pandemic, there was still a significant demand for semiconductors. Because the supply side could not keep up with the rising demand, there were shortages of semiconductor chips.
The electronic special gas segment is expected to be the largest during the forecast period
The electronic special gas segment is estimated to have a lucrative growth, due to the special electronic gases such as nitrogen fluoride that are exclusively produced for the electronic devices. As the semiconductor manufacturing company encourages in producing advanced leading edge semiconductor, demand for gases and chemicals are expanding rapidly. Thus growing demand for high density advanced semiconductor chips are creating demand for electronic special gases.
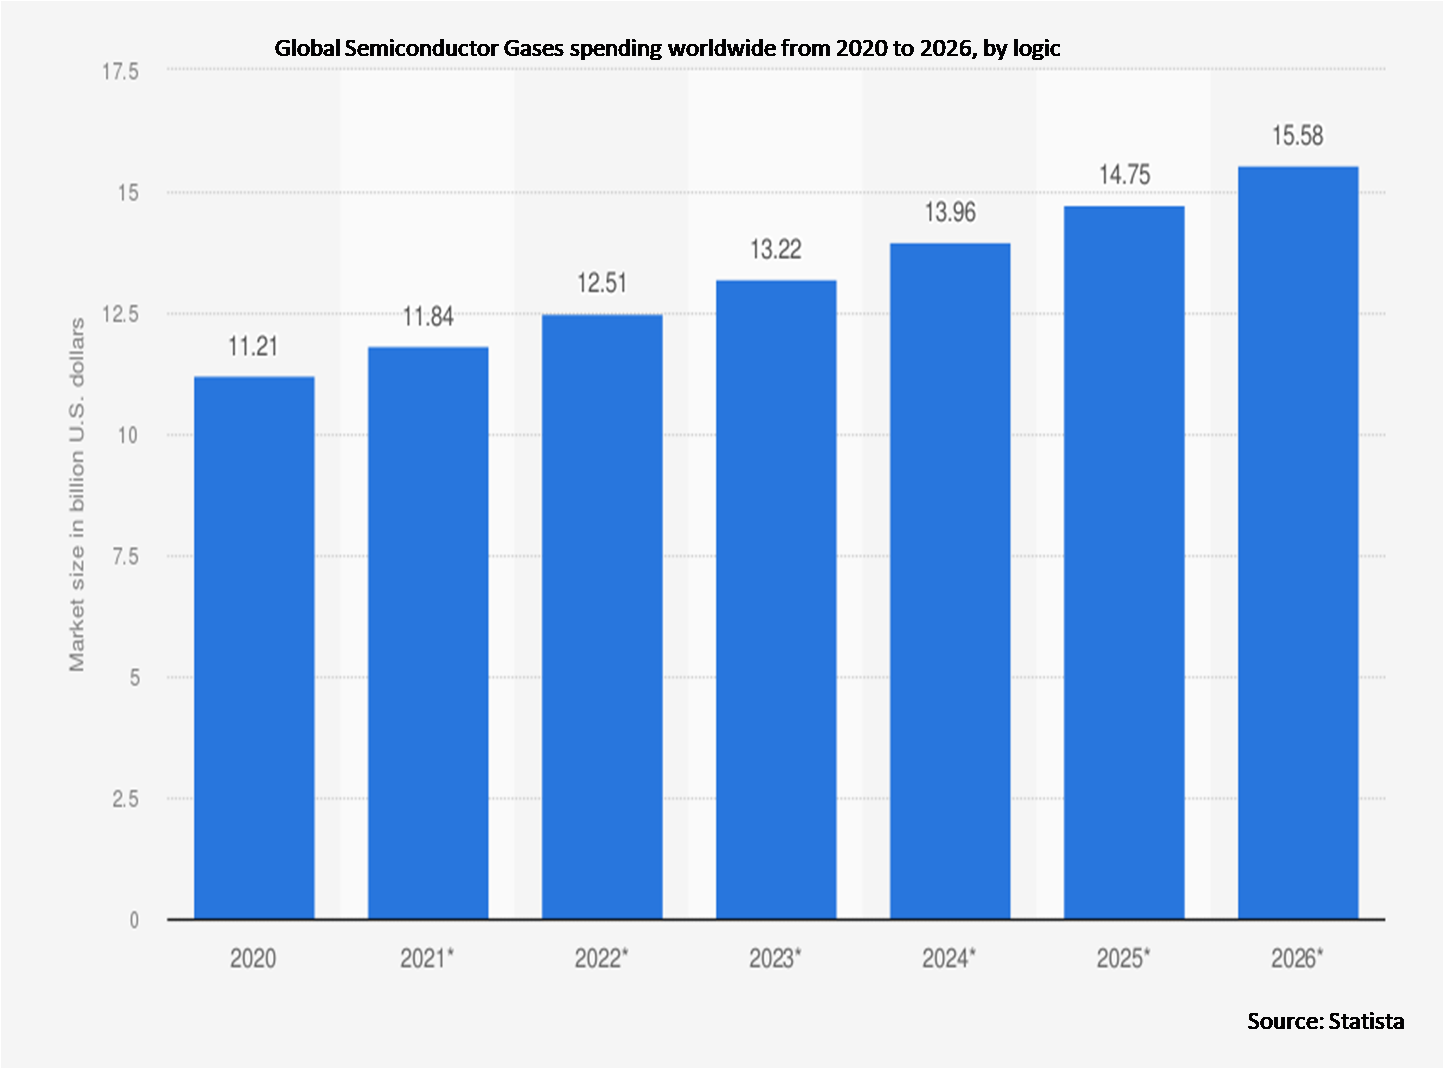
The logic segment is expected to have the highest CAGR during the forecast period
The logic segment is anticipated to witness the fastest CAGR growth during the forecast period, due to its usage in the manufacturing of high computation devices. These devices include CPUs, GPUs and NPUs. With the advancements in new technologies that need high computing ability to process machine learning algorithms, the demand for logic chips is witnessing lucrative growth.
Region with largest share:
Asia Pacific is projected to hold the largest market share during the forecast period owing to rapid urbanization and increase in digitalization. The emerging countries in this region are expanding semiconductor manufacturing sector drastically. This region is investing heavily to expand its current production capacity. The rising relevance of semiconductor industries in this region are playing critical role in geopolitics and raising the demand of the market.
Region with highest CAGR:
Europe is projected to have the highest CAGR over the forecast period, owing to new investments and conducive environment for new talents. This region is home to the most R&D intensive semiconductor sector. It mostly focused on domestic production and aiming to increase its share in global semiconductor production. Raising construction of infrastructure and government initiatives are anticipated to create new opportunities for the market.

Key players in the market
Some of the key players profiled in the Semiconductor Gases Market include Air Products and Chemicals Inc, Air Liquide, Iwatani Corporation, Linde plc, Electronic Fluorocarbons, LLC, Porvair Filtration Group, Donaldson Company, Pall Corporation, Ewald Associates, Messer Group, Solvay, Mott Corporation, Valin Corporation, Nippon Seisen Co, Parker Hannifin Corporation, Mycropore Corporation, SUMITOMO SEIKA CHEMICALS CO., LTD, American Gas Products, SHOWA DENKO K.K, Taiyo Nippon Sanso JFP Corporation
Key Developments:
In August 2022, Air Products and The AES Corporation announced plans to invest approximately $4 billion to build own and operate a green hydrogen production facility in Wilbarger County, Texas. The company has agreed to supply high purity gases such as nitrogen, oxygen, argon and hydrogen to an undisclosed semiconductor manufacturer in Taiwan.
In July 2022, Iwatani Corporation has signed a deal with Helious Speciality Gases, an Indian speciality gas company. This will make Helious the first company to have three helium transfill facilities in India. The company also plans to be a leading supplier of helium within the country, catering major OEM’s.
Products Covered:
• Electronic Bulk Gas
• Electronic Special Gas
• Other Products
Applications Covered:
• Logic
• Memory
• Other Applications
Regions Covered:
• North America
o US
o Canada
o Mexico
• Europe
o Germany
o UK
o Italy
o France
o Spain
o Rest of Europe
• Asia Pacific
o Japan
o China
o India
o Australia
o New Zealand
o South Korea
o Rest of Asia Pacific
• South America
o Argentina
o Brazil
o Chile
o Rest of South America
• Middle East & Africa
o Saudi Arabia
o UAE
o Qatar
o South Africa
o Rest of Middle East & Africa
What our report offers:
- Market share assessments for the regional and country-level segments
- Strategic recommendations for the new entrants
- Covers Market data for the years 2020, 2021, 2022, 2025, and 2028
- Market Trends (Drivers, Constraints, Opportunities, Threats, Challenges, Investment Opportunities, and recommendations)
- Strategic recommendations in key business segments based on the market estimations
- Competitive landscaping mapping the key common trends
- Company profiling with detailed strategies, financials, and recent developments
- Supply chain trends mapping the latest technological advancements
Free Customization Offerings:
All the customers of this report will be entitled to receive one of the following free customization options:
• Company Profiling
o Comprehensive profiling of additional market players (up to 3)
o SWOT Analysis of key players (up to 3)
• Regional Segmentation
o Market estimations, Forecasts and CAGR of any prominent country as per the client's interest (Note: Depends on feasibility check)
• Competitive Benchmarking
o Benchmarking of key players based on product portfolio, geographical presence, and strategic alliances
Table of Contents
1 Executive Summary
2 Preface
2.1 Abstract
2.2 Stake Holders
2.3 Research Scope
2.4 Research Methodology
2.4.1 Data Mining
2.4.2 Data Analysis
2.4.3 Data Validation
2.4.4 Research Approach
2.5 Research Sources
2.5.1 Primary Research Sources
2.5.2 Secondary Research Sources
2.5.3 Assumptions
3 Market Trend Analysis
3.1 Introduction
3.2 Drivers
3.3 Restraints
3.4 Opportunities
3.5 Threats
3.6 Product Analysis
3.7 Application Analysis
3.8 Emerging Markets
3.9 Impact of Covid-19
4 Porters Five Force Analysis
4.1 Bargaining power of suppliers
4.2 Bargaining power of buyers
4.3 Threat of substitutes
4.4 Threat of new entrants
4.5 Competitive rivalry
5 Global Semiconductor Gases Market, By Product
5.1 Introduction
5.2 Electronic Bulk Gas
5.3 Electronic Special Gas
5.4 Other Products
6 Global Semiconductor Gases Market, By Application
6.1 Introduction
6.2 Logic
6.3 Memory
6.4 Other Applications
7 Global Semiconductor Gases Market, By Geography
7.1 Introduction
7.2 North America
7.2.1 US
7.2.2 Canada
7.2.3 Mexico
7.3 Europe
7.3.1 Germany
7.3.2 UK
7.3.3 Italy
7.3.4 France
7.3.5 Spain
7.3.6 Rest of Europe
7.4 Asia Pacific
7.4.1 Japan
7.4.2 China
7.4.3 India
7.4.4 Australia
7.4.5 New Zealand
7.4.6 South Korea
7.4.7 Rest of Asia Pacific
7.5 South America
7.5.1 Argentina
7.5.2 Brazil
7.5.3 Chile
7.5.4 Rest of South America
7.6 Middle East & Africa
7.6.1 Saudi Arabia
7.6.2 UAE
7.6.3 Qatar
7.6.4 South Africa
7.6.5 Rest of Middle East & Africa
8 Key Developments
8.1 Agreements, Partnerships, Collaborations and Joint Ventures
8.2 Acquisitions & Mergers
8.3 New Product Launch
8.4 Expansions
8.5 Other Key Strategies
9 Company Profiling
9.1 Air Products and Chemicals Inc
9.2 Air Liquide
9.3 Iwatani Corporation
9.4 Linde plc
9.5 Electronic Fluorocarbons, LLC
9.6 Porvair Filtration Group
9.7 Donaldson Company
9.8 Pall Corporation
9.9 Ewald Associates
9.10 Messer Group
9.11 Solvay
9.12 Mott Corporation
9.13 Valin Corporation
9.14 Nippon Seisen Co
9.15 Parker Hannifin Corporation
9.16 Mycropore Corporation
9.17 SUMITOMO SEIKA CHEMICALS CO., LTD
9.18 American Gas Products
9.19 SHOWA DENKO K.K
9.20 Taiyo Nippon Sanso JFP Corporation
List of Tables
1 Global Semiconductor Gases Market Outlook, By Region (2020-2028) ($MN)
2 Global Semiconductor Gases Market Outlook, By Product (2020-2028) ($MN)
3 Global Semiconductor Gases Market Outlook, By Electronic Bulk Gas (2020-2028) ($MN)
4 Global Semiconductor Gases Market Outlook, By Electronic Special Gas (2020-2028) ($MN)
5 Global Semiconductor Gases Market Outlook, By Other Products (2020-2028) ($MN)
6 Global Semiconductor Gases Market Outlook, By Application (2020-2028) ($MN)
7 Global Semiconductor Gases Market Outlook, By Logic (2020-2028) ($MN)
8 Global Semiconductor Gases Market Outlook, By Memory (2020-2028) ($MN)
9 Global Semiconductor Gases Market Outlook, By Other Applications (2020-2028) ($MN)
10 North America Semiconductor Gases Market Outlook, By Country (2020-2028) ($MN)
11 North America Semiconductor Gases Market Outlook, By Product (2020-2028) ($MN)
12 North America Semiconductor Gases Market Outlook, By Electronic Bulk Gas (2020-2028) ($MN)
13 North America Semiconductor Gases Market Outlook, By Electronic Special Gas (2020-2028) ($MN)
14 North America Semiconductor Gases Market Outlook, By Other Products (2020-2028) ($MN)
15 North America Semiconductor Gases Market Outlook, By Application (2020-2028) ($MN)
16 North America Semiconductor Gases Market Outlook, By Logic (2020-2028) ($MN)
17 North America Semiconductor Gases Market Outlook, By Memory (2020-2028) ($MN)
18 North America Semiconductor Gases Market Outlook, By Other Applications (2020-2028) ($MN)
19 Europe Semiconductor Gases Market Outlook, By Country (2020-2028) ($MN)
20 Europe Semiconductor Gases Market Outlook, By Product (2020-2028) ($MN)
21 Europe Semiconductor Gases Market Outlook, By Electronic Bulk Gas (2020-2028) ($MN)
22 Europe Semiconductor Gases Market Outlook, By Electronic Special Gas (2020-2028) ($MN)
23 Europe Semiconductor Gases Market Outlook, By Other Products (2020-2028) ($MN)
24 Europe Semiconductor Gases Market Outlook, By Application (2020-2028) ($MN)
25 Europe Semiconductor Gases Market Outlook, By Logic (2020-2028) ($MN)
26 Europe Semiconductor Gases Market Outlook, By Memory (2020-2028) ($MN)
27 Europe Semiconductor Gases Market Outlook, By Other Applications (2020-2028) ($MN)
28 Asia Pacific Semiconductor Gases Market Outlook, By Country (2020-2028) ($MN)
29 Asia Pacific Semiconductor Gases Market Outlook, By Product (2020-2028) ($MN)
30 Asia Pacific Semiconductor Gases Market Outlook, By Electronic Bulk Gas (2020-2028) ($MN)
31 Asia Pacific Semiconductor Gases Market Outlook, By Electronic Special Gas (2020-2028) ($MN)
32 Asia Pacific Semiconductor Gases Market Outlook, By Other Products (2020-2028) ($MN)
33 Asia Pacific Semiconductor Gases Market Outlook, By Application (2020-2028) ($MN)
34 Asia Pacific Semiconductor Gases Market Outlook, By Logic (2020-2028) ($MN)
35 Asia Pacific Semiconductor Gases Market Outlook, By Memory (2020-2028) ($MN)
36 Asia Pacific Semiconductor Gases Market Outlook, By Other Applications (2020-2028) ($MN)
37 South America Semiconductor Gases Market Outlook, By Country (2020-2028) ($MN)
38 South America Semiconductor Gases Market Outlook, By Product (2020-2028) ($MN)
39 South America Semiconductor Gases Market Outlook, By Electronic Bulk Gas (2020-2028) ($MN)
40 South America Semiconductor Gases Market Outlook, By Electronic Special Gas (2020-2028) ($MN)
41 South America Semiconductor Gases Market Outlook, By Other Products (2020-2028) ($MN)
42 South America Semiconductor Gases Market Outlook, By Application (2020-2028) ($MN)
43 South America Semiconductor Gases Market Outlook, By Logic (2020-2028) ($MN)
44 South America Semiconductor Gases Market Outlook, By Memory (2020-2028) ($MN)
45 South America Semiconductor Gases Market Outlook, By Other Applications (2020-2028) ($MN)
46 Middle East & Africa Semiconductor Gases Market Outlook, By Country (2020-2028) ($MN)
47 Middle East & Africa Semiconductor Gases Market Outlook, By Product (2020-2028) ($MN)
48 Middle East & Africa Semiconductor Gases Market Outlook, By Electronic Bulk Gas (2020-2028) ($MN)
49 Middle East & Africa Semiconductor Gases Market Outlook, By Electronic Special Gas (2020-2028) ($MN)
50 Middle East & Africa Semiconductor Gases Market Outlook, By Other Products (2020-2028) ($MN)
51 Middle East & Africa Semiconductor Gases Market Outlook, By Application (2020-2028) ($MN)
52 Middle East & Africa Semiconductor Gases Market Outlook, By Logic (2020-2028) ($MN)
53 Middle East & Africa Semiconductor Gases Market Outlook, By Memory (2020-2028) ($MN)
54 Middle East & Africa Semiconductor Gases Market Outlook, By Other Applications (2020-2028) ($MN)
List of Figures
RESEARCH METHODOLOGY

We at ‘Stratistics’ opt for an extensive research approach which involves data mining, data validation, and data analysis. The various research sources include in-house repository, secondary research, competitor’s sources, social media research, client internal data, and primary research.
Our team of analysts prefers the most reliable and authenticated data sources in order to perform the comprehensive literature search. With access to most of the authenticated data bases our team highly considers the best mix of information through various sources to obtain extensive and accurate analysis.
Each report takes an average time of a month and a team of 4 industry analysts. The time may vary depending on the scope and data availability of the desired market report. The various parameters used in the market assessment are standardized in order to enhance the data accuracy.
Data Mining
The data is collected from several authenticated, reliable, paid and unpaid sources and is filtered depending on the scope & objective of the research. Our reports repository acts as an added advantage in this procedure. Data gathering from the raw material suppliers, distributors and the manufacturers is performed on a regular basis, this helps in the comprehensive understanding of the products value chain. Apart from the above mentioned sources the data is also collected from the industry consultants to ensure the objective of the study is in the right direction.
Market trends such as technological advancements, regulatory affairs, market dynamics (Drivers, Restraints, Opportunities and Challenges) are obtained from scientific journals, market related national & international associations and organizations.
Data Analysis
From the data that is collected depending on the scope & objective of the research the data is subjected for the analysis. The critical steps that we follow for the data analysis include:
- Product Lifecycle Analysis
- Competitor analysis
- Risk analysis
- Porters Analysis
- PESTEL Analysis
- SWOT Analysis
The data engineering is performed by the core industry experts considering both the Marketing Mix Modeling and the Demand Forecasting. The marketing mix modeling makes use of multiple-regression techniques to predict the optimal mix of marketing variables. Regression factor is based on a number of variables and how they relate to an outcome such as sales or profits.
Data Validation
The data validation is performed by the exhaustive primary research from the expert interviews. This includes telephonic interviews, focus groups, face to face interviews, and questionnaires to validate our research from all aspects. The industry experts we approach come from the leading firms, involved in the supply chain ranging from the suppliers, distributors to the manufacturers and consumers so as to ensure an unbiased analysis.
We are in touch with more than 15,000 industry experts with the right mix of consultants, CEO's, presidents, vice presidents, managers, experts from both supply side and demand side, executives and so on.
The data validation involves the primary research from the industry experts belonging to:
- Leading Companies
- Suppliers & Distributors
- Manufacturers
- Consumers
- Industry/Strategic Consultants
Apart from the data validation the primary research also helps in performing the fill gap research, i.e. providing solutions for the unmet needs of the research which helps in enhancing the reports quality.
For more details about research methodology, kindly write to us at info@strategymrc.com
Frequently Asked Questions
In case of any queries regarding this report, you can contact the customer service by filing the “Inquiry Before Buy” form available on the right hand side. You may also contact us through email: info@strategymrc.com or phone: +1-301-202-5929
Yes, the samples are available for all the published reports. You can request them by filling the “Request Sample” option available in this page.
Yes, you can request a sample with your specific requirements. All the customized samples will be provided as per the requirement with the real data masked.
All our reports are available in Digital PDF format. In case if you require them in any other formats, such as PPT, Excel etc you can submit a request through “Inquiry Before Buy” form available on the right hand side. You may also contact us through email: info@strategymrc.com or phone: +1-301-202-5929
We offer a free 15% customization with every purchase. This requirement can be fulfilled for both pre and post sale. You may send your customization requirements through email at info@strategymrc.com or call us on +1-301-202-5929.
We have 3 different licensing options available in electronic format.
- Single User Licence: Allows one person, typically the buyer, to have access to the ordered product. The ordered product cannot be distributed to anyone else.
- 2-5 User Licence: Allows the ordered product to be shared among a maximum of 5 people within your organisation.
- Corporate License: Allows the product to be shared among all employees of your organisation regardless of their geographical location.
All our reports are typically be emailed to you as an attachment.
To order any available report you need to register on our website. The payment can be made either through CCAvenue or PayPal payments gateways which accept all international cards.
We extend our support to 6 months post sale. A post sale customization is also provided to cover your unmet needs in the report.
Request Customization
We offer complimentary customization of up to 15% with every purchase. To share your customization requirements, feel free to email us at info@strategymrc.com or call us on +1-301-202-5929. .
Please Note: Customization within the 15% threshold is entirely free of charge. If your request exceeds this limit, we will conduct a feasibility assessment. Following that, a detailed quote and timeline will be provided.
WHY CHOOSE US ?

Assured Quality
Best in class reports with high standard of research integrity

24X7 Research Support
Continuous support to ensure the best customer experience.

Free Customization
Adding more values to your product of interest.

Safe & Secure Access
Providing a secured environment for all online transactions.

Trusted by 600+ Brands
Serving the most reputed brands across the world.