
Shale Gas Processing Equipment Market
Shale Gas Processing Equipment Market Forecasts to 2030 - Global Analysis By Component (Electrical Machinery, Compressors & Pumps, Internal Combustion Engines, Heat Exchangers, Measuring & Controlling Devices and Other Components), Process, Application, End User and By Geography

|
Years Covered |
2021-2030 |
|
Estimated Year Value (2023) |
US $9.7 BN |
|
Projected Year Value (2030) |
US $29.0 BN |
|
CAGR (2023 - 2030) |
16.8% |
|
Regions Covered |
North America, Europe, Asia Pacific, South America, and Middle East & Africa |
|
Countries Covered |
US, Canada, Mexico, Germany, UK, Italy, France, Spain, Japan, China, India, Australia, New Zealand, South Korea, Rest of Asia Pacific, South America, Argentina, Brazil, Chile, Middle East & Africa, Saudi Arabia, UAE, Qatar, and South Africa |
|
Largest Market |
Asia Pacific |
|
Highest Growing Market |
North America |
According to Stratistics MRC, the Global Shale Gas Processing Equipment Market is accounted for $9.7 billion in 2023 and is expected to reach $29.0 billion by 2030 growing at a CAGR of 16.8% during the forecast period. Shale gas processing equipment plays a pivotal role in extracting and refining natural gas from shale formations. Comprising components such as compressors, separators, and condensate stabilizers, this equipment facilitates the separation of valuable hydrocarbons from impurities like water and contaminants during the extraction process. Shale gas processing equipment ensures the delivery of purified natural gas to consumers while minimizing environmental impact. As the demand for cleaner energy rises, continual innovations in equipment design and processes contribute to sustainable shale gas extraction and utilization in the evolving energy landscape.
Market Dynamics:
Driver:
Increasing shale gas exploration and production activities
Increased extraction of shale gas necessitates advanced processing equipment, including compressors, separators, and pumps, to efficiently extract, treat, and transport gas. This heightened demand is further fuelled by technological innovations aimed at enhancing processing capabilities. The market experiences a positive trajectory as key players focus on developing solutions tailored to the unique requirements of shale gas processing. Additionally, as exploration activities intensify, there is a growing need for reliable and high-performance equipment to handle the unique challenges associated with shale gas processing propel the growth of the market.
Restraint:
Environmental Concerns
Heightened awareness about climate change and emissions prompts stricter regulations, impacting the market's growth. Additionally, the industry grapples with public resistance to fossil fuel-related projects, hindering investment and project approvals. The shift towards cleaner energy alternatives and renewable sources further challenges the market, impacting the demand for traditional gas processing solutions. Furthermore, shale gas processing generates air and noise pollution, raising environmental concerns and potentially leading to stricter regulations and project delays.
Opportunity:
Rising demand for natural gas
As natural gas gains prominence as a cleaner energy source, there is an escalating need for efficient processing equipment. Compressors, separators, and other processing units are essential to extract, treat, and transport natural gas effectively. Moreover, the shift towards natural gas as a primary energy source in various industries and power generation facilities creates sustained opportunities for the Gas Processing Equipment Market.
Threat:
Volatile oil and gas prices
Rapid and unpredictable price changes can lead to deferred or canceled projects, affecting demand for processing equipment. Companies may face financial challenges and reduced capital expenditure, hindering the adoption of advanced technologies. The industry's sensitivity to price volatility intensifies competition, pressuring profit margins. Conversely, high prices can incentivize increased production, but only temporarily boost the market as companies prioritize meeting current demand over long-term equipment upgrades. This creates short-term growth spurts followed by potential corrections as prices normalize.
Covid-19 Impact
Lockdowns, travel restrictions, and reduced investments in the energy sector have led to a temporary decline in demand. However, the market is gradually recovering as economies reopen and energy demand rebounds. The pandemic has accelerated the adoption of digital technologies and automation in gas processing, promoting efficiency. Stringent safety measures and a focus on resilience have become pivotal, influencing market strategies. While challenges persist, the Gas Processing Equipment Market is adapting to the evolving post-pandemic landscape with resilience and innovation.
The internal combustion engines segment is expected to be the largest during the forecast period
The internal combustion engines segment is estimated to have a lucrative growth, as these engines predominantly utilize natural gas, there is a growing need for advanced processing equipment, including compressors and separators, to extract, treat, and transport gas effectively. Moreover, the increasing adoption of natural gas as a cleaner energy source in internal combustion engines, driven by environmental concerns and regulatory initiatives, further stimulates the market.
The natural gas liquids (NGL) removal segment is expected to have the highest CAGR during the forecast period
The natural gas liquids (NGL) removal segment is anticipated to witness the highest CAGR growth during the forecast period, due to the increasing need for specialized equipment such as fractionation towers, distillation units, and dehydrators. These components play a crucial role in separating and processing NGL from raw natural gas, ensuring compliance with quality standards and enhancing the economic value of the gas stream. Thus the rising importance of NGL extraction in the energy industry propels the market, driving manufacturers to innovate and offer efficient, tailored solutions for the extraction and processing of natural gas liquids
Region with largest share:
Asia Pacific is projected to hold the largest market share during the forecast period owing to the demand for efficient processing equipment, including compressors, pumps, and separators, is rising to extract, treat, and transport shale gas effectively. Further technological advancements and government initiatives supporting the shale gas industry further contribute to market expansion. Thus, the market is poised for continuous development as the Asia Pacific region plays a pivotal role in the global shale gas processing equipment sector.
Region with highest CAGR:
North America is projected to have the highest CAGR over the forecast period, owing to increasing production of natural gas from shale reserves and the emphasis on enhancing infrastructure for gas processing drive market expansion. Key factors include rising demand for cleaner energy sources, technological advancements in processing equipment, and favorable government policies. With a focus on sustainability and efficiency, the North America Gas Processing Equipment Market is poised for continued progression, positioning the region as a key player in the global natural gas processing sector.

Key players in the market
Some of the key players in the Shale Gas Processing Equipment Market include Cameron, Cherokee Nitrogen LLC, Exterran Corporation, GasTech Engineering LLC, Halliburton Company, Honeywell International Inc., Koch Industries Inc., Linde plc, Mitsubishi Heavy Industries, Pall Corporation, Pentair plc, Schlumberger Limited, Siemens AG, Spectra Energy Corp, Sulzer Ltd, TechnipFMC plc, Trimeric Corporation and Van Air Systems
Key Developments:
In February 2024, Honeywell And Hawks Partner To Help Improve Building Sustainability Efforts At State Farm Arena. As part of this multi-year deal, Honeywell will implement a series of high-tech upgrades to State Farm Arena's building operations systems.
In January 2024, Linde announced it has expanded its existing long-term agreement for the supply of industrial gases with Steel Authority of India Limited (SAIL), one of the largest steelmaking companies in India.
In January 2022, Enerflex Ltd. and Exterran Corporation to Combine, Creating a Premier Integrated Global Provider of Energy Infrastructure, Through greater scale and efficiencies, the transaction will strengthen Enerflex’s ability to serve customers in key natural gas, water, and energy transition markets
Components Covered:
• Electrical Machinery
• Compressors & Pumps
• Internal Combustion Engines
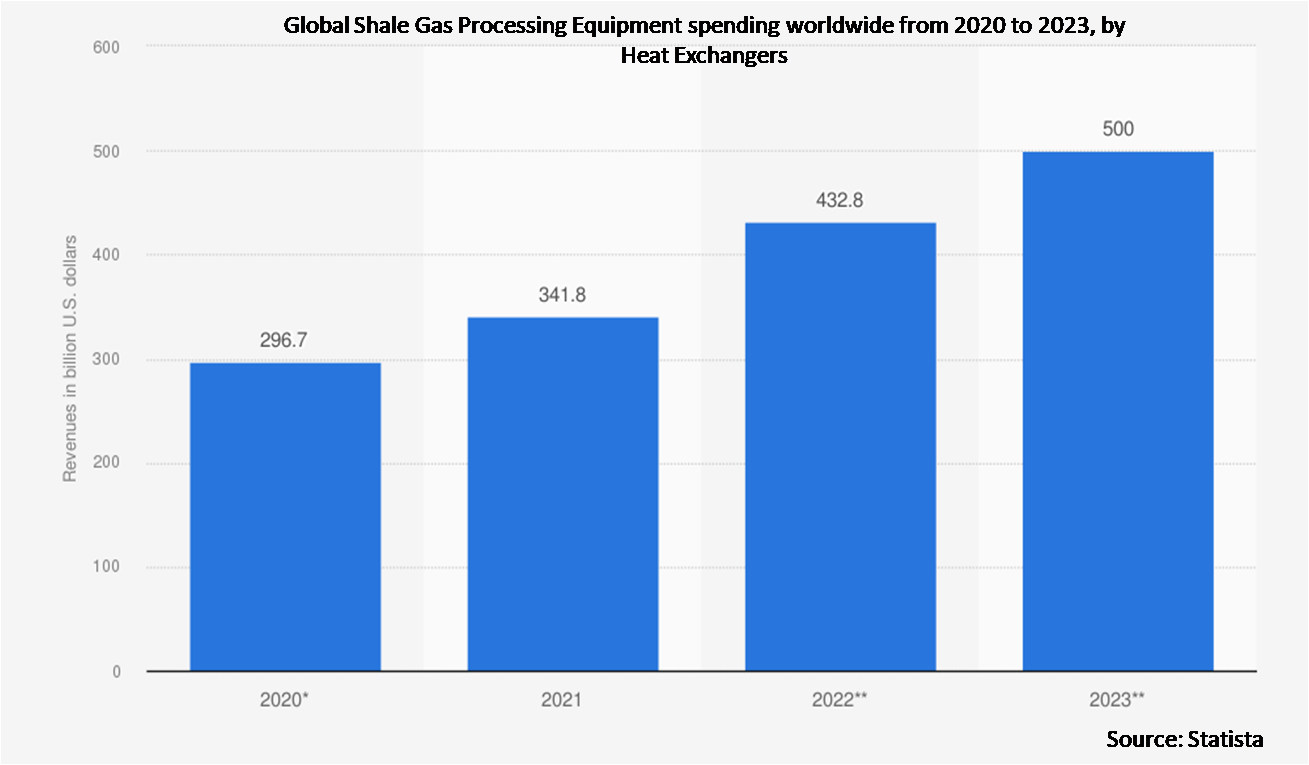
• Heat Exchangers
• Measuring & Controlling Devices
• Other Components
Processes Covered:
• Distillation
• Reheating
• Pyrolysis
• Cracking
• Chemical Treatment
• Other Processes
Applications Covered:
• Wellhead Separation
• Gas Dehydration
• Natural Gas Liquids (NGL) Removal
• Gas Sweetening
• Other Applications
End Users Covered:
• Oil & Gas
• Chemical Manufacturers
• Power Generation
• Other End Users
Regions Covered:
• North America
o US
o Canada
o Mexico
• Europe
o Germany
o UK
o Italy
o France
o Spain
o Rest of Europe
• Asia Pacific
o Japan
o China
o India
o Australia
o New Zealand
o South Korea
o Rest of Asia Pacific
• South America
o Argentina
o Brazil
o Chile
o Rest of South America
• Middle East & Africa
o Saudi Arabia
o UAE
o Qatar
o South Africa
o Rest of Middle East & Africa
What our report offers:
- Market share assessments for the regional and country-level segments
- Strategic recommendations for the new entrants
- Covers Market data for the years 2021, 2022, 2023, 2026, and 2030
- Market Trends (Drivers, Constraints, Opportunities, Threats, Challenges, Investment Opportunities, and recommendations)
- Strategic recommendations in key business segments based on the market estimations
- Competitive landscaping mapping the key common trends
- Company profiling with detailed strategies, financials, and recent developments
- Supply chain trends mapping the latest technological advancements
Free Customization Offerings:
All the customers of this report will be entitled to receive one of the following free customization options:
• Company Profiling
o Comprehensive profiling of additional market players (up to 3)
o SWOT Analysis of key players (up to 3)
• Regional Segmentation
o Market estimations, Forecasts and CAGR of any prominent country as per the client's interest (Note: Depends on feasibility check)
• Competitive Benchmarking
o Benchmarking of key players based on product portfolio, geographical presence, and strategic alliances
Table of Contents
1 Executive Summary
2 Preface
2.1 Abstract
2.2 Stake Holders
2.3 Research Scope
2.4 Research Methodology
2.4.1 Data Mining
2.4.2 Data Analysis
2.4.3 Data Validation
2.4.4 Research Approach
2.5 Research Sources
2.5.1 Primary Research Sources
2.5.2 Secondary Research Sources
2.5.3 Assumptions
3 Market Trend Analysis
3.1 Introduction
3.2 Drivers
3.3 Restraints
3.4 Opportunities
3.5 Threats
3.6 Application Analysis
3.7 End User Analysis
3.8 Emerging Markets
3.9 Impact of Covid-19
4 Porters Five Force Analysis
4.1 Bargaining power of suppliers
4.2 Bargaining power of buyers
4.3 Threat of substitutes
4.4 Threat of new entrants
4.5 Competitive rivalry
5 Global Shale Gas Processing Equipment Market, By Component
5.1 Introduction
5.2 Electrical Machinery
5.3 Compressors & Pumps
5.4 Internal Combustion Engines
5.5 Heat Exchangers
5.6 Measuring & Controlling Devices
5.7 Other Components
6 Global Shale Gas Processing Equipment Market, By Process
6.1 Introduction
6.2 Distillation
6.3 Reheating
6.4 Pyrolysis
6.5 Cracking
6.6 Chemical Treatment
6.7 Other Processes
7 Global Shale Gas Processing Equipment Market, By Application
7.1 Introduction
7.2 Wellhead Separation
7.3 Gas Dehydration
7.4 Natural Gas Liquids (NGL) Removal
7.5 Gas Sweetening
7.6 Other Applications
8 Global Shale Gas Processing Equipment Market, By End User
8.1 Introduction
8.2 Oil & Gas
8.3 Chemical Manufacturers
8.4 Power Generation
8.5 Other End Users
9 Global Shale Gas Processing Equipment Market, By Geography
9.1 Introduction
9.2 North America
9.2.1 US
9.2.2 Canada
9.2.3 Mexico
9.3 Europe
9.3.1 Germany
9.3.2 UK
9.3.3 Italy
9.3.4 France
9.3.5 Spain
9.3.6 Rest of Europe
9.4 Asia Pacific
9.4.1 Japan
9.4.2 China
9.4.3 India
9.4.4 Australia
9.4.5 New Zealand
9.4.6 South Korea
9.4.7 Rest of Asia Pacific
9.5 South America
9.5.1 Argentina
9.5.2 Brazil
9.5.3 Chile
9.5.4 Rest of South America
9.6 Middle East & Africa
9.6.1 Saudi Arabia
9.6.2 UAE
9.6.3 Qatar
9.6.4 South Africa
9.6.5 Rest of Middle East & Africa
10 Key Developments
10.1 Agreements, Partnerships, Collaborations and Joint Ventures
10.2 Acquisitions & Mergers
10.3 New Product Launch
10.4 Expansions
10.5 Other Key Strategies
11 Company Profiling
11.1 Cameron
11.2 Cherokee Nitrogen, LLC
11.3 Exterran Corporation
11.4 GasTech Engineering LLC
11.5 Halliburton Company
11.6 Honeywell International Inc.
11.7 Koch Industries, Inc.
11.8 Linde plc
11.9 Mitsubishi Heavy Industries
11.10 Pall Corporation
11.11 Pentair plc
11.12 Schlumberger Limited
11.13 Siemens AG
11.14 Spectra Energy Corp
11.15 Sulzer Ltd
11.16 TechnipFMC plc
11.17 Trimeric Corporation
11.18 Van Air Systems
List of Tables
1 Global Shale Gas Processing Equipment Market Outlook, By Region (2021-2030) ($MN)
2 Global Shale Gas Processing Equipment Market Outlook, By Component (2021-2030) ($MN)
3 Global Shale Gas Processing Equipment Market Outlook, By Electrical Machinery (2021-2030) ($MN)
4 Global Shale Gas Processing Equipment Market Outlook, By Compressors & Pumps (2021-2030) ($MN)
5 Global Shale Gas Processing Equipment Market Outlook, By Internal Combustion Engines (2021-2030) ($MN)
6 Global Shale Gas Processing Equipment Market Outlook, By Heat Exchangers (2021-2030) ($MN)
7 Global Shale Gas Processing Equipment Market Outlook, By Measuring & Controlling Devices (2021-2030) ($MN)
8 Global Shale Gas Processing Equipment Market Outlook, By Other Components (2021-2030) ($MN)
9 Global Shale Gas Processing Equipment Market Outlook, By Process (2021-2030) ($MN)
10 Global Shale Gas Processing Equipment Market Outlook, By Distillation (2021-2030) ($MN)
11 Global Shale Gas Processing Equipment Market Outlook, By Reheating (2021-2030) ($MN)
12 Global Shale Gas Processing Equipment Market Outlook, By Pyrolysis (2021-2030) ($MN)
13 Global Shale Gas Processing Equipment Market Outlook, By Cracking (2021-2030) ($MN)
14 Global Shale Gas Processing Equipment Market Outlook, By Chemical Treatment (2021-2030) ($MN)
15 Global Shale Gas Processing Equipment Market Outlook, By Other Processes (2021-2030) ($MN)
16 Global Shale Gas Processing Equipment Market Outlook, By Application (2021-2030) ($MN)
17 Global Shale Gas Processing Equipment Market Outlook, By Wellhead Separation (2021-2030) ($MN)
18 Global Shale Gas Processing Equipment Market Outlook, By Gas Dehydration (2021-2030) ($MN)
19 Global Shale Gas Processing Equipment Market Outlook, By Natural Gas Liquids (NGL) Removal (2021-2030) ($MN)
20 Global Shale Gas Processing Equipment Market Outlook, By Gas Sweetening (2021-2030) ($MN)
21 Global Shale Gas Processing Equipment Market Outlook, By Other Applications (2021-2030) ($MN)
22 Global Shale Gas Processing Equipment Market Outlook, By End User (2021-2030) ($MN)
23 Global Shale Gas Processing Equipment Market Outlook, By Oil & Gas (2021-2030) ($MN)
24 Global Shale Gas Processing Equipment Market Outlook, By Chemical Manufacturers (2021-2030) ($MN)
25 Global Shale Gas Processing Equipment Market Outlook, By Power Generation (2021-2030) ($MN)
26 Global Shale Gas Processing Equipment Market Outlook, By Other End Users (2021-2030) ($MN)
Note: Tables for North America, Europe, APAC, South America, and Middle East & Africa Regions are also represented in the same manner as above.
List of Figures
RESEARCH METHODOLOGY

We at ‘Stratistics’ opt for an extensive research approach which involves data mining, data validation, and data analysis. The various research sources include in-house repository, secondary research, competitor’s sources, social media research, client internal data, and primary research.
Our team of analysts prefers the most reliable and authenticated data sources in order to perform the comprehensive literature search. With access to most of the authenticated data bases our team highly considers the best mix of information through various sources to obtain extensive and accurate analysis.
Each report takes an average time of a month and a team of 4 industry analysts. The time may vary depending on the scope and data availability of the desired market report. The various parameters used in the market assessment are standardized in order to enhance the data accuracy.
Data Mining
The data is collected from several authenticated, reliable, paid and unpaid sources and is filtered depending on the scope & objective of the research. Our reports repository acts as an added advantage in this procedure. Data gathering from the raw material suppliers, distributors and the manufacturers is performed on a regular basis, this helps in the comprehensive understanding of the products value chain. Apart from the above mentioned sources the data is also collected from the industry consultants to ensure the objective of the study is in the right direction.
Market trends such as technological advancements, regulatory affairs, market dynamics (Drivers, Restraints, Opportunities and Challenges) are obtained from scientific journals, market related national & international associations and organizations.
Data Analysis
From the data that is collected depending on the scope & objective of the research the data is subjected for the analysis. The critical steps that we follow for the data analysis include:
- Product Lifecycle Analysis
- Competitor analysis
- Risk analysis
- Porters Analysis
- PESTEL Analysis
- SWOT Analysis
The data engineering is performed by the core industry experts considering both the Marketing Mix Modeling and the Demand Forecasting. The marketing mix modeling makes use of multiple-regression techniques to predict the optimal mix of marketing variables. Regression factor is based on a number of variables and how they relate to an outcome such as sales or profits.
Data Validation
The data validation is performed by the exhaustive primary research from the expert interviews. This includes telephonic interviews, focus groups, face to face interviews, and questionnaires to validate our research from all aspects. The industry experts we approach come from the leading firms, involved in the supply chain ranging from the suppliers, distributors to the manufacturers and consumers so as to ensure an unbiased analysis.
We are in touch with more than 15,000 industry experts with the right mix of consultants, CEO's, presidents, vice presidents, managers, experts from both supply side and demand side, executives and so on.
The data validation involves the primary research from the industry experts belonging to:
- Leading Companies
- Suppliers & Distributors
- Manufacturers
- Consumers
- Industry/Strategic Consultants
Apart from the data validation the primary research also helps in performing the fill gap research, i.e. providing solutions for the unmet needs of the research which helps in enhancing the reports quality.
For more details about research methodology, kindly write to us at info@strategymrc.com
Frequently Asked Questions
In case of any queries regarding this report, you can contact the customer service by filing the “Inquiry Before Buy” form available on the right hand side. You may also contact us through email: info@strategymrc.com or phone: +1-301-202-5929
Yes, the samples are available for all the published reports. You can request them by filling the “Request Sample” option available in this page.
Yes, you can request a sample with your specific requirements. All the customized samples will be provided as per the requirement with the real data masked.
All our reports are available in Digital PDF format. In case if you require them in any other formats, such as PPT, Excel etc you can submit a request through “Inquiry Before Buy” form available on the right hand side. You may also contact us through email: info@strategymrc.com or phone: +1-301-202-5929
We offer a free 15% customization with every purchase. This requirement can be fulfilled for both pre and post sale. You may send your customization requirements through email at info@strategymrc.com or call us on +1-301-202-5929.
We have 3 different licensing options available in electronic format.
- Single User Licence: Allows one person, typically the buyer, to have access to the ordered product. The ordered product cannot be distributed to anyone else.
- 2-5 User Licence: Allows the ordered product to be shared among a maximum of 5 people within your organisation.
- Corporate License: Allows the product to be shared among all employees of your organisation regardless of their geographical location.
All our reports are typically be emailed to you as an attachment.
To order any available report you need to register on our website. The payment can be made either through CCAvenue or PayPal payments gateways which accept all international cards.
We extend our support to 6 months post sale. A post sale customization is also provided to cover your unmet needs in the report.
Request Customization
We offer complimentary customization of up to 15% with every purchase. To share your customization requirements, feel free to email us at info@strategymrc.com or call us on +1-301-202-5929. .
Please Note: Customization within the 15% threshold is entirely free of charge. If your request exceeds this limit, we will conduct a feasibility assessment. Following that, a detailed quote and timeline will be provided.
WHY CHOOSE US ?

Assured Quality
Best in class reports with high standard of research integrity

24X7 Research Support
Continuous support to ensure the best customer experience.

Free Customization
Adding more values to your product of interest.

Safe & Secure Access
Providing a secured environment for all online transactions.

Trusted by 600+ Brands
Serving the most reputed brands across the world.