
Shared Mobility And Carpool Platforms Market
Shared Mobility and Carpool Platforms Market Forecasts to 2034 - Global Analysis By Service Type (Commuter Carpooling, On-Demand Ride-Pooling, Peer-to-Peer (P2P) Car Sharing, Enterprise Mobility Services and Subscription Access Services), Vehicle Type, Technology Attribute, Business Model, End User and By Geography

|
Years Covered |
2023-2034 |
|
Estimated Year Value (2026) |
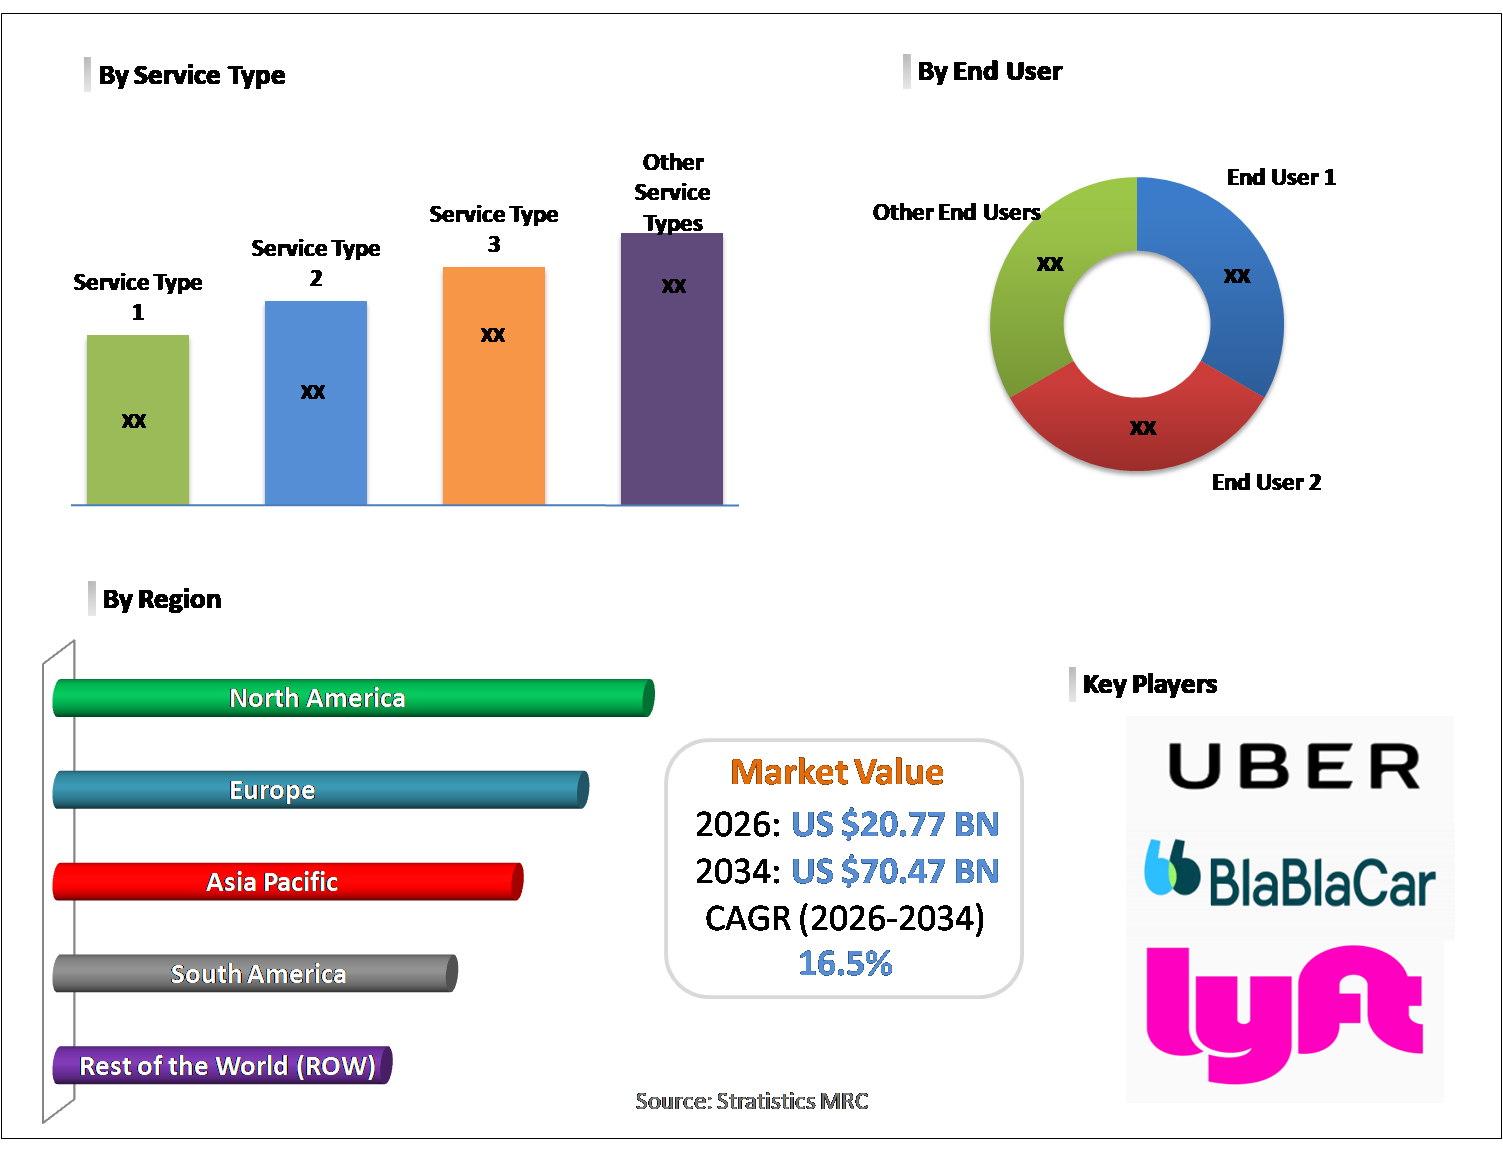
US $20.77 BN |
|
Projected Year Value (2034) |
US $70.47 BN |
|
CAGR (2026-2034) |
16.5% |
|
Regions Covered |
North America, Europe, Asia Pacific, South America, and Rest of the World (RoW) |
|
Countries Covered |
United States, Canada, Mexico, United Kingdom, Germany, France, Italy, Spain, Netherlands, Belgium, Sweden, Switzerland, Poland, Rest of Europe, China, Japan, India, South Korea, Australia, Indonesia, Thailand, Malaysia, Singapore, Vietnam, Rest of Asia Pacific, Brazil, Argentina, Colombia, Chile, Peru, Rest of South America, Saudi Arabia, United Arab Emirates, Qatar, Israel, Rest of Middle East, South Africa, Egypt, Morocco, and Rest of Africa. |
|
Largest Market |
North America |
|
Highest Growing Market |
Asia Pacific |
According to Stratistics MRC, the Global Shared Mobility and Carpool Platforms Market is accounted for $20.77 billion in 2026 and is expected to reach $70.47 billion by 2034 growing at a CAGR of 16.5% during the forecast period. Carpooling and shared mobility platforms are reshaping city transport by providing convenient, affordable, and environmentally friendly travel options. These services link passengers with similar routes, helping decrease road congestion, cut down vehicle numbers and lower greenhouse gas emissions. Using mobile apps and real-time tracking, commuters can easily book rides, coordinate schedules, and split expenses. Governments and organizations are increasingly backing these solutions to encourage sustainable travel, minimize parking pressure, and improve transportation systems. Incorporating electric and self-driving vehicles into these platforms boosts efficiency, safety, and sustainability, positioning shared mobility as a critical component of modern urban transportation strategies.
According to ITF’s broader work on shared mobility, privately owned cars are highly underutilized—used less than one hour per day and carrying fewer than 1.5 passengers on average. Improving utilization through car sharing and ride sharing can reduce total kilometers driven and congestion.
Market Dynamics:
Driver:
Rising environmental awareness
As awareness of environmental issues grows, both individuals and authorities are embracing sustainable transport options. Carpooling and shared mobility minimize the number of vehicles in use, lowering emissions and enhancing air quality. Incorporating electric vehicles amplifies these benefits. Rising ecological concern drives people to choose shared rides over private cars, blending convenience with sustainability. This shift aligns with global goals to reduce carbon emissions and support eco-conscious urban living. Shared mobility platforms offer a practical, green commuting alternative, encouraging environmentally responsible travel while addressing traffic congestion and urban transportation challenges.
Restraint:
High initial investment and operational costs
Establishing shared mobility services demands significant financial resources for technology, vehicles, and infrastructure. Developing apps, GPS, secure payments, and fleet management systems requires high initial investment. Operational costs, including insurance, maintenance, driver hiring, marketing, and customer service, further strain budgets. Companies face difficulties recovering these expenses while keeping prices competitive. Expansion is especially slow in cost-sensitive regions, and smaller startups often struggle against well-funded competitors. These financial challenges restrict market entry and slow growth despite rising demand for shared mobility. High investment requirements remain a critical restraint, limiting rapid adoption and the scalability of carpooling platforms.
Opportunity:
Integration with electric and autonomous vehicles
Incorporating electric and self-driving vehicles in shared mobility platforms creates new growth avenues. Electric vehicles cut costs and emissions, appealing to environmentally conscious commuters. Autonomous vehicles improve efficiency, safety, and service availability, reducing reliance on drivers. Integrating EVs and AVs allows platforms to attract tech-savvy and eco-aware users while gaining a competitive advantage. These innovations position shared mobility as a futuristic, sustainable alternative to traditional transport. Companies leveraging these technologies can enhance operational efficiency, expand service hours, and strengthen market presence. EV and AV integration represents a key opportunity for driving adoption, profitability, and global market expansion.
Threat:
Privacy and data security risks
User privacy and data security are critical for shared mobility platforms, which handle sensitive information such as location, payments, and personal details. Data breaches, hacking, or misuse can undermine user trust and reduce adoption. Compliance with privacy regulations, including GDPR, demands substantial resources and monitoring. Failure to protect data may lead to fines, lawsuits, and reputational harm. Growing user concerns about tracking and personal information exposure can limit usage. Strong cybersecurity protocols are essential to mitigate these risks. Privacy and data protection challenges are significant threats, impacting consumer confidence and potentially restricting growth and long-term market stability.
Covid-19 Impact:
The COVID-19 crisis heavily affected shared mobility and carpool services, as lockdowns, travel bans, and social distancing reduced ride-sharing demand. Commuters avoided shared transportation to minimize infection risk, leading to revenue losses and temporary service suspensions. Platforms responded by introducing contactless payments, sanitization protocols, and occupancy restrictions to ensure safety. Despite the initial downturn, the pandemic accelerated mobile and digital adoption, emphasizing the need for flexible transport options. Post-pandemic recovery involves maintaining health-conscious practices, improving hygiene standards, and offering diversified services. The crisis has reshaped user expectations, driving long-term changes in shared mobility operations and commuter behavior.
The commuter carpooling segment is expected to be the largest during the forecast period
The commuter carpooling segment is expected to account for the largest market share during the forecast period because it effectively serves daily travelers looking for affordable and convenient transport options. By matching riders on similar routes, it reduces private car usage, eases traffic, and lowers emissions. The segment benefits from predictable travel schedules, simple coordination via apps and strong support from employers and government initiatives promoting sustainable commuting. Its ability to address regular commuting needs efficiently, along with increasing environmental awareness, ensures its leading position in the market. Commuter carpooling remains the primary segment driving adoption and growth in shared mobility platforms.
The autonomous shuttles segment is expected to have the highest CAGR during the forecast period
Over the forecast period, the autonomous shuttles segment is predicted to witness the highest growth rate owing to advancements in driverless technology and rising interest in automated transport. They provide improved safety, reduced operational expenses, and continuous round-the-clock service, appealing to urban transport operators. AI-based fleet management and integration with smart city systems optimize routes and increase efficiency. Investments from governments and private enterprises are boosting consumer confidence and adoption. With their focus on innovation, convenience, and environmental benefits, autonomous shuttles are emerging as the most rapidly expanding segment, driving the dynamic growth of the shared mobility market.
Region with largest share:
During the forecast period, the North America region is expected to hold the largest market share because of high urban population density, developed transport networks, and extensive smartphone penetration. The region benefits from established ride-sharing services, robust technology adoption, and policies encouraging sustainable transportation. Commuters favor app-based solutions for cost savings, convenience, reduced congestion, and environmental benefits. Major platform providers operate extensively here, while growing awareness of eco-conscious commuting further fuels adoption. The combination of a mature market, advanced digital infrastructure, and supportive regulations makes North America the largest and most influential region in the shared mobility and carpool platforms market.
Region with highest CAGR:
Over the forecast period, the Asia Pacific region is anticipated to exhibit the highest CAGR because of rapid urban population growth, higher incomes, and widespread smart phone use. Increasing traffic congestion and insufficient public transport infrastructure in urban centers fuel the demand for efficient and affordable ride-sharing services. Regional governments support sustainable transportation initiatives, boosting carpool and shared mobility adoption. The proliferation of tech-enabled platforms and a large, digitally connected commuter base further accelerates expansion. These combined trends make Asia-Pacific the region with the highest growth rate, presenting significant opportunities for growth and investment in shared mobility and carpool platforms.

Key players in the market
Some of the key players in Shared Mobility and Carpool Platforms Market include Uber Technologies Inc., DiDi Global Inc., Lyft, Inc., ANI Technologies Pvt. Ltd. (Ola Cabs), Grab Holdings Inc., BlaBlaCar, Bolt Technology OÜ, Gojek Tech, Careem, Via Transportation Inc., Waze Carpool, Scoop Technologies Inc., Karos Inc., SRide Carpool Services Pvt. Ltd., Liftshare Inc., GoMore Aps, Ryde Inc. and InDriver.
Key Developments:
In February 2026, Uber Technologies Inc announced it has reached an agreement to acquire the delivery business of Turkish rapid grocery delivery company Getir, strengthening its position in the Turkish market. The acquisition will significantly expand Uber’s delivery footprint in Türkiye, where Getir first pioneered the ultrafast grocery delivery model before expanding internationally.
In February 2026, Grab has entered an exclusive partnership with Hesai Technology to distribute lidar sensors for autonomous mobility across Southeast Asia. The Hesai agreement is aimed at supporting future autonomous vehicles and robotics projects across Grab's regional network.
In April 2025, Lyft, Inc. announced it has entered into a definitive agreement to acquire FREENOW, a leading European multi-mobility app with a taxi offering at its core, from BMW Group and Mercedes-Benz Mobility for approximately €175 million or $197 million* in cash. FREENOW will continue operating as it does today, with its talented leadership team and employees in place to drive growth across 9 countries and over 150 cities across Ireland, the United Kingdom, Germany, Greece, Spain, Italy, Poland, France, and Austria.
Service Types Covered:
• Commuter Carpooling
• On-Demand Ride-Pooling
• Peer-to-Peer (P2P) Car Sharing
• Enterprise Mobility Services
• Subscription Access Services
Vehicle Types Covered:
• Passenger Cars
• Vans & Minibuses
• Autonomous Shuttles
Technology Attributes Covered:
• Electric Vehicle Integration
• Autonomous Driving Enablement
• Connected Vehicle Systems
Business Models Covered:
• Direct-to-Consumer (B2C platforms)
• Enterprise Solutions (B2B platforms)
• Hybrid Delivery Models
End Users Covered:
• Individual Commuters
• Corporate Clients
• Government & Institutional Programs
Regions Covered:
• North America
o United States
o Canada
o Mexico
• Europe
o United Kingdom
o Germany
o France
o Italy
o Spain
o Netherlands
o Belgium
o Sweden
o Switzerland
o Poland
o Rest of Europe
• Asia Pacific
o China
o Japan
o India
o South Korea
o Australia
o Indonesia
o Thailand
o Malaysia
o Singapore
o Vietnam
o Rest of Asia Pacific
• South America
o Brazil
o Argentina
o Colombia
o Chile
o Peru
o Rest of South America
• Rest of the World (RoW)
o Middle East
§ Saudi Arabia
§ United Arab Emirates
§ Qatar
§ Israel
§ Rest of Middle East
o Africa
§ South Africa
§ Egypt
§ Morocco
§ Rest of Africa
What our report offers:
- Market share assessments for the regional and country-level segments
- Strategic recommendations for the new entrants
- Covers Market data for the years 2023, 2024, 2025, 2026, 2027, 2028, 2030, 2032 and 2034
- Market Trends (Drivers, Constraints, Opportunities, Threats, Challenges, Investment Opportunities, and recommendations)
- Strategic recommendations in key business segments based on the market estimations
- Competitive landscaping mapping the key common trends
- Company profiling with detailed strategies, financials, and recent developments
- Supply chain trends mapping the latest technological advancements
Free Customization Offerings:
All the customers of this report will be entitled to receive one of the following free customization options:
• Company Profiling
o Comprehensive profiling of additional market players (up to 3)
o SWOT Analysis of key players (up to 3)
• Regional Segmentation
o Market estimations, Forecasts and CAGR of any prominent country as per the client's interest (Note: Depends on feasibility check)
• Competitive Benchmarking
o Benchmarking of key players based on product portfolio, geographical presence, and strategic alliances
Table of Contents
1 Executive Summary
1.1 Market Snapshot and Key Highlights
1.2 Growth Drivers, Challenges, and Opportunities
1.3 Competitive Landscape Overview
1.4 Strategic Insights and Recommendations
2 Research Framework
2.1 Study Objectives and Scope
2.2 Stakeholder Analysis
2.3 Research Assumptions and Limitations
2.4 Research Methodology
2.4.1 Data Collection (Primary and Secondary)
2.4.2 Data Modeling and Estimation Techniques
2.4.3 Data Validation and Triangulation
2.4.4 Analytical and Forecasting Approach
3 Market Dynamics and Trend Analysis
3.1 Market Definition and Structure
3.2 Key Market Drivers
3.3 Market Restraints and Challenges
3.4 Growth Opportunities and Investment Hotspots
3.5 Industry Threats and Risk Assessment
3.6 Technology and Innovation Landscape
3.7 Emerging and High-Growth Markets
3.8 Regulatory and Policy Environment
3.9 Impact of COVID-19 and Recovery Outlook
4 Competitive and Strategic Assessment
4.1 Porter's Five Forces Analysis
4.1.1 Supplier Bargaining Power
4.1.2 Buyer Bargaining Power
4.1.3 Threat of Substitutes
4.1.4 Threat of New Entrants
4.1.5 Competitive Rivalry
4.2 Market Share Analysis of Key Players
4.3 Product Benchmarking and Performance Comparison
5 Global Shared Mobility and Carpool Platforms Market, By Service Type
5.1 Commuter Carpooling
5.2 On-Demand Ride-Pooling
5.3 Peer-to-Peer (P2P) Car Sharing
5.4 Enterprise Mobility Services
5.5 Subscription Access Services
6 Global Shared Mobility and Carpool Platforms Market, By Vehicle Type
6.1 Passenger Cars
6.2 Vans & Minibuses
6.3 Autonomous Shuttles
7 Global Shared Mobility and Carpool Platforms Market, By Technology Attribute
7.1 Electric Vehicle Integration
7.2 Autonomous Driving Enablement
7.3 Connected Vehicle Systems
8 Global Shared Mobility and Carpool Platforms Market, By Business Model
8.1 Direct-to-Consumer (B2C platforms)
8.2 Enterprise Solutions (B2B platforms)
8.3 Hybrid Delivery Models
9 Global Shared Mobility and Carpool Platforms Market, By End User
9.1 Individual Commuters
9.2 Corporate Clients
9.3 Government & Institutional Programs
10 Global Shared Mobility and Carpool Platforms Market, By Geography
10.1 North America
10.1.1 United States
10.1.2 Canada
10.1.3 Mexico
10.2 Europe
10.2.1 United Kingdom
10.2.2 Germany
10.2.3 France
10.2.4 Italy
10.2.5 Spain
10.2.6 Netherlands
10.2.7 Belgium
10.2.8 Sweden
10.2.9 Switzerland
10.2.10 Poland
10.2.11 Rest of Europe
10.3 Asia Pacific
10.3.1 China
10.3.2 Japan
10.3.3 India
10.3.4 South Korea
10.3.5 Australia
10.3.6 Indonesia
10.3.7 Thailand
10.3.8 Malaysia
10.3.9 Singapore
10.3.10 Vietnam
10.3.11 Rest of Asia Pacific
10.4 South America
10.4.1 Brazil
10.4.2 Argentina
10.4.3 Colombia
10.4.4 Chile
10.4.5 Peru
10.4.6 Rest of South America
10.5 Rest of the World (RoW)
10.5.1 Middle East
10.5.1.1 Saudi Arabia
10.5.1.2 United Arab Emirates
10.5.1.3 Qatar
10.5.1.4 Israel
10.5.1.5 Rest of Middle East
10.5.2 Africa
10.5.2.1 South Africa
10.5.2.2 Egypt
10.5.2.3 Morocco
10.5.2.4 Rest of Africa
11 Strategic Market Intelligence
11.1 Industry Value Network and Supply Chain Assessment
11.2 White-Space and Opportunity Mapping
11.3 Product Evolution and Market Life Cycle Analysis
11.4 Channel, Distributor, and Go-to-Market Assessment
12 Industry Developments and Strategic Initiatives
12.1 Mergers and Acquisitions
12.2 Partnerships, Alliances, and Joint Ventures
12.3 New Product Launches and Certifications
12.4 Capacity Expansion and Investments
12.5 Other Strategic Initiatives
13 Company Profiles
13.1 Uber Technologies Inc.
13.2 DiDi Global Inc.
13.3 Lyft, Inc.
13.4 ANI Technologies Pvt. Ltd. (Ola Cabs)
13.5 Grab Holdings Inc.
13.6 BlaBlaCar
13.7 Bolt Technology OÜ
13.8 Gojek Tech
13.9 Careem
13.10 Via Transportation Inc.
13.11 Waze Carpool
13.12 Scoop Technologies Inc.
13.13 Karos Inc.
13.14 SRide Carpool Services Pvt. Ltd.
13.15 Liftshare Inc.
13.16 GoMore Aps
13.17 Ryde Inc.
13.18 InDriver
List of Tables
1 Global Shared Mobility and Carpool Platforms Market Outlook, By Region (2023-2034) ($MN)
2 Global Shared Mobility and Carpool Platforms Market Outlook, By Service Type (2023-2034) ($MN)
3 Global Shared Mobility and Carpool Platforms Market Outlook, By Commuter Carpooling (2023-2034) ($MN)
4 Global Shared Mobility and Carpool Platforms Market Outlook, By On-Demand Ride-Pooling (2023-2034) ($MN)
5 Global Shared Mobility and Carpool Platforms Market Outlook, By Peer-to-Peer (P2P) Car Sharing (2023-2034) ($MN)
6 Global Shared Mobility and Carpool Platforms Market Outlook, By Enterprise Mobility Services (2023-2034) ($MN)
7 Global Shared Mobility and Carpool Platforms Market Outlook, By Subscription Access Services (2023-2034) ($MN)
8 Global Shared Mobility and Carpool Platforms Market Outlook, By Vehicle Type (2023-2034) ($MN)
9 Global Shared Mobility and Carpool Platforms Market Outlook, By Passenger Cars (2023-2034) ($MN)
10 Global Shared Mobility and Carpool Platforms Market Outlook, By Vans & Minibuses (2023-2034) ($MN)
11 Global Shared Mobility and Carpool Platforms Market Outlook, By Autonomous Shuttles (2023-2034) ($MN)
12 Global Shared Mobility and Carpool Platforms Market Outlook, By Technology Attribute (2023-2034) ($MN)
13 Global Shared Mobility and Carpool Platforms Market Outlook, By Electric Vehicle Integration (2023-2034) ($MN)
14 Global Shared Mobility and Carpool Platforms Market Outlook, By Autonomous Driving Enablement (2023-2034) ($MN)
15 Global Shared Mobility and Carpool Platforms Market Outlook, By Connected Vehicle Systems (2023-2034) ($MN)
16 Global Shared Mobility and Carpool Platforms Market Outlook, By Business Model (2023-2034) ($MN)
17 Global Shared Mobility and Carpool Platforms Market Outlook, By Direct-to-Consumer (B2C platforms) (2023-2034) ($MN)
18 Global Shared Mobility and Carpool Platforms Market Outlook, By Enterprise Solutions (B2B platforms) (2023-2034) ($MN)
19 Global Shared Mobility and Carpool Platforms Market Outlook, By Hybrid Delivery Models (2023-2034) ($MN)
20 Global Shared Mobility and Carpool Platforms Market Outlook, By End User (2023-2034) ($MN)
21 Global Shared Mobility and Carpool Platforms Market Outlook, By Individual Commuters (2023-2034) ($MN)
22 Global Shared Mobility and Carpool Platforms Market Outlook, By Corporate Clients (2023-2034) ($MN)
23 Global Shared Mobility and Carpool Platforms Market Outlook, By Government & Institutional Programs (2023-2034) ($MN)
Note: Tables for North America, Europe, APAC, South America, and Rest of the World (RoW) Regions are also represented in the same manner as above.
List of Figures
RESEARCH METHODOLOGY

We at ‘Stratistics’ opt for an extensive research approach which involves data mining, data validation, and data analysis. The various research sources include in-house repository, secondary research, competitor’s sources, social media research, client internal data, and primary research.
Our team of analysts prefers the most reliable and authenticated data sources in order to perform the comprehensive literature search. With access to most of the authenticated data bases our team highly considers the best mix of information through various sources to obtain extensive and accurate analysis.
Each report takes an average time of a month and a team of 4 industry analysts. The time may vary depending on the scope and data availability of the desired market report. The various parameters used in the market assessment are standardized in order to enhance the data accuracy.
Data Mining
The data is collected from several authenticated, reliable, paid and unpaid sources and is filtered depending on the scope & objective of the research. Our reports repository acts as an added advantage in this procedure. Data gathering from the raw material suppliers, distributors and the manufacturers is performed on a regular basis, this helps in the comprehensive understanding of the products value chain. Apart from the above mentioned sources the data is also collected from the industry consultants to ensure the objective of the study is in the right direction.
Market trends such as technological advancements, regulatory affairs, market dynamics (Drivers, Restraints, Opportunities and Challenges) are obtained from scientific journals, market related national & international associations and organizations.
Data Analysis
From the data that is collected depending on the scope & objective of the research the data is subjected for the analysis. The critical steps that we follow for the data analysis include:
- Product Lifecycle Analysis
- Competitor analysis
- Risk analysis
- Porters Analysis
- PESTEL Analysis
- SWOT Analysis
The data engineering is performed by the core industry experts considering both the Marketing Mix Modeling and the Demand Forecasting. The marketing mix modeling makes use of multiple-regression techniques to predict the optimal mix of marketing variables. Regression factor is based on a number of variables and how they relate to an outcome such as sales or profits.
Data Validation
The data validation is performed by the exhaustive primary research from the expert interviews. This includes telephonic interviews, focus groups, face to face interviews, and questionnaires to validate our research from all aspects. The industry experts we approach come from the leading firms, involved in the supply chain ranging from the suppliers, distributors to the manufacturers and consumers so as to ensure an unbiased analysis.
We are in touch with more than 15,000 industry experts with the right mix of consultants, CEO's, presidents, vice presidents, managers, experts from both supply side and demand side, executives and so on.
The data validation involves the primary research from the industry experts belonging to:
- Leading Companies
- Suppliers & Distributors
- Manufacturers
- Consumers
- Industry/Strategic Consultants
Apart from the data validation the primary research also helps in performing the fill gap research, i.e. providing solutions for the unmet needs of the research which helps in enhancing the reports quality.
For more details about research methodology, kindly write to us at info@strategymrc.com
Frequently Asked Questions
In case of any queries regarding this report, you can contact the customer service by filing the “Inquiry Before Buy” form available on the right hand side. You may also contact us through email: info@strategymrc.com or phone: +1-301-202-5929
Yes, the samples are available for all the published reports. You can request them by filling the “Request Sample” option available in this page.
Yes, you can request a sample with your specific requirements. All the customized samples will be provided as per the requirement with the real data masked.
All our reports are available in Digital PDF format. In case if you require them in any other formats, such as PPT, Excel etc you can submit a request through “Inquiry Before Buy” form available on the right hand side. You may also contact us through email: info@strategymrc.com or phone: +1-301-202-5929
We offer a free 15% customization with every purchase. This requirement can be fulfilled for both pre and post sale. You may send your customization requirements through email at info@strategymrc.com or call us on +1-301-202-5929.
We have 3 different licensing options available in electronic format.
- Single User Licence: Allows one person, typically the buyer, to have access to the ordered product. The ordered product cannot be distributed to anyone else.
- 2-5 User Licence: Allows the ordered product to be shared among a maximum of 5 people within your organisation.
- Corporate License: Allows the product to be shared among all employees of your organisation regardless of their geographical location.
All our reports are typically be emailed to you as an attachment.
To order any available report you need to register on our website. The payment can be made either through CCAvenue or PayPal payments gateways which accept all international cards.
We extend our support to 6 months post sale. A post sale customization is also provided to cover your unmet needs in the report.
Request Customization
We offer complimentary customization of up to 15% with every purchase. To share your customization requirements, feel free to email us at info@strategymrc.com or call us on +1-301-202-5929. .
Please Note: Customization within the 15% threshold is entirely free of charge. If your request exceeds this limit, we will conduct a feasibility assessment. Following that, a detailed quote and timeline will be provided.
WHY CHOOSE US ?

Assured Quality
Best in class reports with high standard of research integrity

24X7 Research Support
Continuous support to ensure the best customer experience.

Free Customization
Adding more values to your product of interest.

Safe & Secure Access
Providing a secured environment for all online transactions.

Trusted by 600+ Brands
Serving the most reputed brands across the world.