
Small Wind Power Market
Small Wind Power Market Forecasts to 2028 - Global Analysis By Axis (Vertical Axis Wind Turbines, Horizontal Axis Wind Turbines and Other), Application (Utility, Commercial, Residential and Other Applications), Installation and By Geography

|
Years Covered |
2020-2028 |
|
Estimated Year Value (2022) |
US $1.22 BN |
|
Projected Year Value (2028) |
US $2.31 BN |
|
CAGR (2022 - 2028) |
11.22% |
|
Regions Covered |
North America, Europe, Asia Pacific, South America, and Middle East & Africa |
|
Countries Covered |
US, Canada, Mexico, Germany, UK, Italy, France, Spain, Japan, China, India, Australia, New Zealand, South Korea, Rest of Asia Pacific, South America, Argentina, Brazil, Chile, Middle East & Africa, Saudi Arabia, UAE, Qatar, and South Africa |
|
Largest Market |
Asia Pacific |
|
Fastest Growing Market |
Europe |
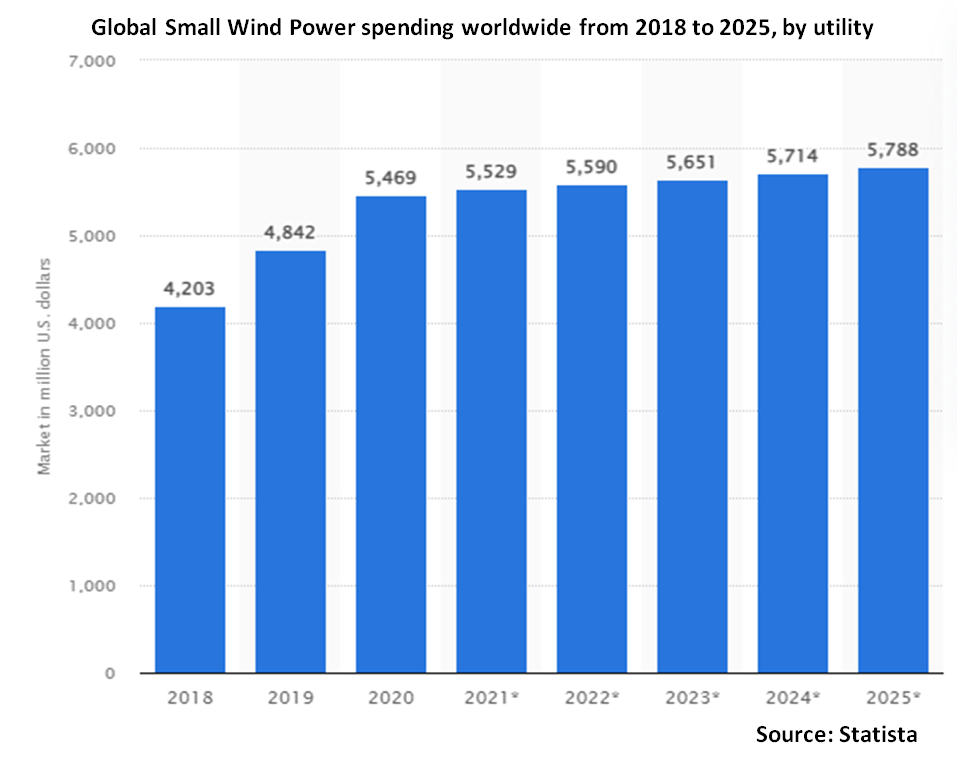
According to Stratistics MRC, the Global Small Wind Power Market is accounted for $1.22 billion in 2022 and is expected to reach $2.31 billion by 2028 growing at a CAGR of 11.22% during the forecast period. A small wind system is the power system which is connected to the electric grid through power provider or it can stand alone (off-grid). It is a good choice for rural areas that are not already connected to the electric grid. It is made up of a wind turbine mounted on a tower to provide better access to stronger winds. In addition to the turbine and tower, they also require balance-of-system components. It is one of the most cost-effective home-based renewable energy systems with zero emissions and pollution.
According to the Energy Information Administration report on Wind Energy, 9.2% of total utility-scale electricity energy is generated by wind energy through worldwide in the forecast period.
Market Dynamics:
Driver:
Adoption of small wind energy in rural households
Small wind energy is an adaptive and flexible option for generating sustainable electricity. They are popular in farmhouses, remote and rural areas, telecommunication towers, houses, and tall buildings, operating as standalone or grid-connected units. They are located close to areas where there is a requirement for energy and operates at larger counterparts with easy installation which is anticipating the market growth.
Restraint:
High capital cost
The installation costs vary greatly depending on local zoning, permitting, utility interconnection costs, high experimental costs, and time requirements. Difficulties in maintenance, lack of skilled technicians, unavailability of a comprehensive resource mapping, and lack of policy frameworks in certain countries hinder the growing capacity of the small wind power market size.
Opportunity:
Favourable government initiatives and policies
Many countries have adopted comprehensive policy frameworks to support renewable energy, leading to a rapid scale-up of these technologies. The federal government currently offers several tax incentives for wind projects. The government even decreased the electricity rate which is anticipating to witness the market growth at a rapid pace.
Threat:
Adoption and implementation of alternative renewable resources
The adoption and implementation of alternative renewable resources for energy consumption can be a bigger constrain in the small wind power market growth. Solar energy remains the powerhouse of growth in the renewable sector. The easy availability of other options such as rooftop solar systems, bio-energy facilities, and many others can challenge the growing capacity of the market.
Covid-19 Impact
The covid 19 pandemics have affected the global offshore wind market by increasing the delays in the projects. The disruption in the global trading has restricted the construction of the projects further leads towards increasing CAPEX for the projects. The government of these markets is willing to increase the volume and target of the offshore market which will ultimately lead towards the maximum offshore installation. The global market is predicted to witness a higher growth rate after post-pandemic.
The on-grid segment is expected to be the largest during the forecast period
The on-grid is estimated to have a lucrative growth, due to the government initiatives towards enhancing grid connectivity in the small wind sector. Various financial and economic benefits are offered by regulators including Production Tax Credits, Investment Tax Credits, and Feed-in Tariffs which will augment the market of small wind growth during the forecast period.
The vertical axis wind turbines segment is expected to have the highest CAGR during the forecast period
The vertical axis wind turbines segment is anticipated to witness the fastest CAGR growth during the forecast period, due to affordable pricing coupled with numerous environmental benefits offered by the design. It is ease in installation coupled with easy availability of components. It leads a large margin owing to the design being traditionally available which is exponentially growing the market.
Region with highest share:
Asia Pacific is projected to hold the largest market share during the forecast period owing to various government initiatives, such as incentives and energy-saving certificates by the governments in this region and they are also encouraging commercial units to adapt to power generation from small wind turbines during the forecast period which is expanding the market share.
Region with highest CAGR:
Europe is projected to have the highest CAGR over the forecast period, owing to increasing reliance on a renewable energy source that is cheap to harness and carbon-emission which has gained huge significance in the European markets. Due to the low feed-in tariff and high electricity prices the scheme of feed-in tariffs is designed to promote the take-up of domestic-scale generation in this region.

Key players in the market
Some of the key players profiled in the Small Wind Power Market include Kliux Energies, Bergey Windpower Co, GE Renewable Energy, Envergate Energy AG, Shanghai Zhiyuan Green Energy Co., Ltd, superwind GmbH, EOCYCLE Technologies, Northern Power Systems, Kingspan Group, XZERES Corporation, SD Wind Energy, City Windmills Ltd, Ennera Energy, Aeolos Wind Energy Ltd, HY Energy Co Ltd, ZK Energy Science & Technology CO Ltd, Unitron Energy Systems Pvt Ltd, RYSE Energy
Key Developments:
In May 2021, GE Renewable Energy and Toshiba announced their strategic partnership agreement on an offshore wind project in Japan.
In August 2018, four key players which include Vermont Electric Cooperative (VEC), Viridity Energy Solutions, Inc., Northern Power Systems, Inc., and WEG Electric Corp collaborated to design new solutions to match the intensifying consumer demand.
Axis Covered:
• Vertical Axis Wind Turbines
• Horizontal Axis Wind Turbines
• Other Axis
Installations Covered:
• On Grid
• Off Grid
• Other Installations
Applications Covered:
• Utility
• Commercial
• Residential
• Other Applications
Regions Covered:
• North America
o US
o Canada
o Mexico
• Europe
o Germany
o UK
o Italy
o France
o Spain
o Rest of Europe
• Asia Pacific
o Japan
o China
o India
o Australia
o New Zealand
o South Korea
o Rest of Asia Pacific
• South America
o Argentina
o Brazil
o Chile
o Rest of South America
• Middle East & Africa
o Saudi Arabia
o UAE
o Qatar
o South Africa
o Rest of Middle East & Africa
What our report offers:
- Market share assessments for the regional and country-level segments
- Strategic recommendations for the new entrants
- Covers Market data for the years 2020, 2021, 2022, 2025, and 2028
- Market Trends (Drivers, Constraints, Opportunities, Threats, Challenges, Investment Opportunities, and recommendations)
- Strategic recommendations in key business segments based on the market estimations
- Competitive landscaping mapping the key common trends
- Company profiling with detailed strategies, financials, and recent developments
- Supply chain trends mapping the latest technological advancements
Free Customization Offerings:
All the customers of this report will be entitled to receive one of the following free customization options:
• Company Profiling
o Comprehensive profiling of additional market players (up to 3)
o SWOT Analysis of key players (up to 3)
• Regional Segmentation
o Market estimations, Forecasts and CAGR of any prominent country as per the client's interest (Note: Depends on feasibility check)
• Competitive Benchmarking
o Benchmarking of key players based on product portfolio, geographical presence, and strategic alliances
Table of Contents
1 Executive Summary
2 Preface
2.1 Abstract
2.2 Stake Holders
2.3 Research Scope
2.4 Research Methodology
2.4.1 Data Mining
2.4.2 Data Analysis
2.4.3 Data Validation
2.4.4 Research Approach
2.5 Research Sources
2.5.1 Primary Research Sources
2.5.2 Secondary Research Sources
2.5.3 Assumptions
3 Market Trend Analysis
3.1 Introduction
3.2 Drivers
3.3 Restraints
3.4 Opportunities
3.5 Threats
3.6 Application Analysis
3.7 Emerging Markets
3.8 Impact of Covid-19
4 Porters Five Force Analysis
4.1 Bargaining power of suppliers
4.2 Bargaining power of buyers
4.3 Threat of substitutes
4.4 Threat of new entrants
4.5 Competitive rivalry
5 Global Small Wind Power Market, By Axis
5.1 Introduction
5.2 Vertical Axis Wind Turbines
5.3 Horizontal Axis Wind Turbines
5.4 Other Axis
6 Global Small Wind Power Market, By Installation
6.1 Introduction
6.2 On Grid
6.3 Off Grid
6.4 Other Installations
7 Global Small Wind Power Market, By Application
7.1 Introduction
7.2 Utility
7.3 Commercial
7.4 Residential
7.5 Other Applications
8 Global Small Wind Power Market, By Geography
8.1 Introduction
8.2 North America
8.2.1 US
8.2.2 Canada
8.2.3 Mexico
8.3 Europe
8.3.1 Germany
8.3.2 UK
8.3.3 Italy
8.3.4 France
8.3.5 Spain
8.3.6 Rest of Europe
8.4 Asia Pacific
8.4.1 Japan
8.4.2 China
8.4.3 India
8.4.4 Australia
8.4.5 New Zealand
8.4.6 South Korea
8.4.7 Rest of Asia Pacific
8.5 South America
8.5.1 Argentina
8.5.2 Brazil
8.5.3 Chile
8.5.4 Rest of South America
8.6 Middle East & Africa
8.6.1 Saudi Arabia
8.6.2 UAE
8.6.3 Qatar
8.6.4 South Africa
8.6.5 Rest of Middle East & Africa
9 Key Developments
9.1 Agreements, Partnerships, Collaborations and Joint Ventures
9.2 Acquisitions & Mergers
9.3 New Product Launch
9.4 Expansions
9.5 Other Key Strategies
10 Company Profiling
10.1 Kliux Energies
10.2 Bergey Windpower Co
10.3 GE Renewable Energy
10.4 Envergate Energy AG
10.5 Shanghai Zhiyuan Green Energy Co., Ltd
10.6 superwind GmbH
10.7 EOCYCLE Technologies
10.8 Northern Power Systems
10.9 Kingspan Group
10.10 XZERES Corporation
10.11 SD Wind Energy
10.12 City Windmills Ltd
10.13 Ennera Energy
10.14 Aeolos Wind Energy Ltd
10.15 HY Energy Co Ltd
10.16 ZK Energy Science & Technology CO Ltd
10.17 Unitron Energy Systems Pvt Ltd
10.18 RYSE Energy
List of Tables
1 Global Small Wind Power Market Outlook, By Region (2020-2028) ($MN)
2 Global Small Wind Power Market Outlook, By Axis (2020-2028) ($MN)
3 Global Small Wind Power Market Outlook, By Vertical Axis Wind Turbines (2020-2028) ($MN)
4 Global Small Wind Power Market Outlook, By Horizontal Axis Wind Turbines (2020-2028) ($MN)
5 Global Small Wind Power Market Outlook, By Other Axis (2020-2028) ($MN)
6 Global Small Wind Power Market Outlook, By Installation (2020-2028) ($MN)
7 Global Small Wind Power Market Outlook, By On Grid (2020-2028) ($MN)
8 Global Small Wind Power Market Outlook, By Off Grid (2020-2028) ($MN)
9 Global Small Wind Power Market Outlook, By Other Installations (2020-2028) ($MN)
10 Global Small Wind Power Market Outlook, By Application (2020-2028) ($MN)
11 Global Small Wind Power Market Outlook, By Utility (2020-2028) ($MN)
12 Global Small Wind Power Market Outlook, By Commercial (2020-2028) ($MN)
13 Global Small Wind Power Market Outlook, By Residential (2020-2028) ($MN)
14 Global Small Wind Power Market Outlook, By Other Applications (2020-2028) ($MN)
15 North America Small Wind Power Market Outlook, By Country (2020-2028) ($MN)
16 North America Small Wind Power Market Outlook, By Axis (2020-2028) ($MN)
17 North America Small Wind Power Market Outlook, By Vertical Axis Wind Turbines (2020-2028) ($MN)
18 North America Small Wind Power Market Outlook, By Horizontal Axis Wind Turbines (2020-2028) ($MN)
19 North America Small Wind Power Market Outlook, By Other Axis (2020-2028) ($MN)
20 North America Small Wind Power Market Outlook, By Installation (2020-2028) ($MN)
21 North America Small Wind Power Market Outlook, By On Grid (2020-2028) ($MN)
22 North America Small Wind Power Market Outlook, By Off Grid (2020-2028) ($MN)
23 North America Small Wind Power Market Outlook, By Other Installations (2020-2028) ($MN)
24 North America Small Wind Power Market Outlook, By Application (2020-2028) ($MN)
25 North America Small Wind Power Market Outlook, By Utility (2020-2028) ($MN)
26 North America Small Wind Power Market Outlook, By Commercial (2020-2028) ($MN)
27 North America Small Wind Power Market Outlook, By Residential (2020-2028) ($MN)
28 North America Small Wind Power Market Outlook, By Other Applications (2020-2028) ($MN)
29 Europe Small Wind Power Market Outlook, By Country (2020-2028) ($MN)
30 Europe Small Wind Power Market Outlook, By Axis (2020-2028) ($MN)
31 Europe Small Wind Power Market Outlook, By Vertical Axis Wind Turbines (2020-2028) ($MN)
32 Europe Small Wind Power Market Outlook, By Horizontal Axis Wind Turbines (2020-2028) ($MN)
33 Europe Small Wind Power Market Outlook, By Other Axis (2020-2028) ($MN)
34 Europe Small Wind Power Market Outlook, By Installation (2020-2028) ($MN)
35 Europe Small Wind Power Market Outlook, By On Grid (2020-2028) ($MN)
36 Europe Small Wind Power Market Outlook, By Off Grid (2020-2028) ($MN)
37 Europe Small Wind Power Market Outlook, By Other Installations (2020-2028) ($MN)
38 Europe Small Wind Power Market Outlook, By Application (2020-2028) ($MN)
39 Europe Small Wind Power Market Outlook, By Utility (2020-2028) ($MN)
40 Europe Small Wind Power Market Outlook, By Commercial (2020-2028) ($MN)
41 Europe Small Wind Power Market Outlook, By Residential (2020-2028) ($MN)
42 Europe Small Wind Power Market Outlook, By Other Applications (2020-2028) ($MN)
43 Asia Pacific Small Wind Power Market Outlook, By Country (2020-2028) ($MN)
44 Asia Pacific Small Wind Power Market Outlook, By Axis (2020-2028) ($MN)
45 Asia Pacific Small Wind Power Market Outlook, By Vertical Axis Wind Turbines (2020-2028) ($MN)
46 Asia Pacific Small Wind Power Market Outlook, By Horizontal Axis Wind Turbines (2020-2028) ($MN)
47 Asia Pacific Small Wind Power Market Outlook, By Other Axis (2020-2028) ($MN)
48 Asia Pacific Small Wind Power Market Outlook, By Installation (2020-2028) ($MN)
49 Asia Pacific Small Wind Power Market Outlook, By On Grid (2020-2028) ($MN)
50 Asia Pacific Small Wind Power Market Outlook, By Off Grid (2020-2028) ($MN)
51 Asia Pacific Small Wind Power Market Outlook, By Other Installations (2020-2028) ($MN)
52 Asia Pacific Small Wind Power Market Outlook, By Application (2020-2028) ($MN)
53 Asia Pacific Small Wind Power Market Outlook, By Utility (2020-2028) ($MN)
54 Asia Pacific Small Wind Power Market Outlook, By Commercial (2020-2028) ($MN)
55 Asia Pacific Small Wind Power Market Outlook, By Residential (2020-2028) ($MN)
56 Asia Pacific Small Wind Power Market Outlook, By Other Applications (2020-2028) ($MN)
57 South America Small Wind Power Market Outlook, By Country (2020-2028) ($MN)
58 South America Small Wind Power Market Outlook, By Axis (2020-2028) ($MN)
59 South America Small Wind Power Market Outlook, By Vertical Axis Wind Turbines (2020-2028) ($MN)
60 South America Small Wind Power Market Outlook, By Horizontal Axis Wind Turbines (2020-2028) ($MN)
61 South America Small Wind Power Market Outlook, By Other Axis (2020-2028) ($MN)
62 South America Small Wind Power Market Outlook, By Installation (2020-2028) ($MN)
63 South America Small Wind Power Market Outlook, By On Grid (2020-2028) ($MN)
64 South America Small Wind Power Market Outlook, By Off Grid (2020-2028) ($MN)
65 South America Small Wind Power Market Outlook, By Other Installations (2020-2028) ($MN)
66 South America Small Wind Power Market Outlook, By Application (2020-2028) ($MN)
67 South America Small Wind Power Market Outlook, By Utility (2020-2028) ($MN)
68 South America Small Wind Power Market Outlook, By Commercial (2020-2028) ($MN)
69 South America Small Wind Power Market Outlook, By Residential (2020-2028) ($MN)
70 South America Small Wind Power Market Outlook, By Other Applications (2020-2028) ($MN)
71 Middle East & Africa Small Wind Power Market Outlook, By Country (2020-2028) ($MN)
72 Middle East & Africa Small Wind Power Market Outlook, By Axis (2020-2028) ($MN)
73 Middle East & Africa Small Wind Power Market Outlook, By Vertical Axis Wind Turbines (2020-2028) ($MN)
74 Middle East & Africa Small Wind Power Market Outlook, By Horizontal Axis Wind Turbines (2020-2028) ($MN)
75 Middle East & Africa Small Wind Power Market Outlook, By Other Axis (2020-2028) ($MN)
76 Middle East & Africa Small Wind Power Market Outlook, By Installation (2020-2028) ($MN)
77 Middle East & Africa Small Wind Power Market Outlook, By On Grid (2020-2028) ($MN)
78 Middle East & Africa Small Wind Power Market Outlook, By Off Grid (2020-2028) ($MN)
79 Middle East & Africa Small Wind Power Market Outlook, By Other Installations (2020-2028) ($MN)
80 Middle East & Africa Small Wind Power Market Outlook, By Application (2020-2028) ($MN)
81 Middle East & Africa Small Wind Power Market Outlook, By Utility (2020-2028) ($MN)
82 Middle East & Africa Small Wind Power Market Outlook, By Commercial (2020-2028) ($MN)
83 Middle East & Africa Small Wind Power Market Outlook, By Residential (2020-2028) ($MN)
84 Middle East & Africa Small Wind Power Market Outlook, By Other Applications (2020-2028) ($MN)
List of Figures
RESEARCH METHODOLOGY

We at ‘Stratistics’ opt for an extensive research approach which involves data mining, data validation, and data analysis. The various research sources include in-house repository, secondary research, competitor’s sources, social media research, client internal data, and primary research.
Our team of analysts prefers the most reliable and authenticated data sources in order to perform the comprehensive literature search. With access to most of the authenticated data bases our team highly considers the best mix of information through various sources to obtain extensive and accurate analysis.
Each report takes an average time of a month and a team of 4 industry analysts. The time may vary depending on the scope and data availability of the desired market report. The various parameters used in the market assessment are standardized in order to enhance the data accuracy.
Data Mining
The data is collected from several authenticated, reliable, paid and unpaid sources and is filtered depending on the scope & objective of the research. Our reports repository acts as an added advantage in this procedure. Data gathering from the raw material suppliers, distributors and the manufacturers is performed on a regular basis, this helps in the comprehensive understanding of the products value chain. Apart from the above mentioned sources the data is also collected from the industry consultants to ensure the objective of the study is in the right direction.
Market trends such as technological advancements, regulatory affairs, market dynamics (Drivers, Restraints, Opportunities and Challenges) are obtained from scientific journals, market related national & international associations and organizations.
Data Analysis
From the data that is collected depending on the scope & objective of the research the data is subjected for the analysis. The critical steps that we follow for the data analysis include:
- Product Lifecycle Analysis
- Competitor analysis
- Risk analysis
- Porters Analysis
- PESTEL Analysis
- SWOT Analysis
The data engineering is performed by the core industry experts considering both the Marketing Mix Modeling and the Demand Forecasting. The marketing mix modeling makes use of multiple-regression techniques to predict the optimal mix of marketing variables. Regression factor is based on a number of variables and how they relate to an outcome such as sales or profits.
Data Validation
The data validation is performed by the exhaustive primary research from the expert interviews. This includes telephonic interviews, focus groups, face to face interviews, and questionnaires to validate our research from all aspects. The industry experts we approach come from the leading firms, involved in the supply chain ranging from the suppliers, distributors to the manufacturers and consumers so as to ensure an unbiased analysis.
We are in touch with more than 15,000 industry experts with the right mix of consultants, CEO's, presidents, vice presidents, managers, experts from both supply side and demand side, executives and so on.
The data validation involves the primary research from the industry experts belonging to:
- Leading Companies
- Suppliers & Distributors
- Manufacturers
- Consumers
- Industry/Strategic Consultants
Apart from the data validation the primary research also helps in performing the fill gap research, i.e. providing solutions for the unmet needs of the research which helps in enhancing the reports quality.
For more details about research methodology, kindly write to us at info@strategymrc.com
Frequently Asked Questions
In case of any queries regarding this report, you can contact the customer service by filing the “Inquiry Before Buy” form available on the right hand side. You may also contact us through email: info@strategymrc.com or phone: +1-301-202-5929
Yes, the samples are available for all the published reports. You can request them by filling the “Request Sample” option available in this page.
Yes, you can request a sample with your specific requirements. All the customized samples will be provided as per the requirement with the real data masked.
All our reports are available in Digital PDF format. In case if you require them in any other formats, such as PPT, Excel etc you can submit a request through “Inquiry Before Buy” form available on the right hand side. You may also contact us through email: info@strategymrc.com or phone: +1-301-202-5929
We offer a free 15% customization with every purchase. This requirement can be fulfilled for both pre and post sale. You may send your customization requirements through email at info@strategymrc.com or call us on +1-301-202-5929.
We have 3 different licensing options available in electronic format.
- Single User Licence: Allows one person, typically the buyer, to have access to the ordered product. The ordered product cannot be distributed to anyone else.
- 2-5 User Licence: Allows the ordered product to be shared among a maximum of 5 people within your organisation.
- Corporate License: Allows the product to be shared among all employees of your organisation regardless of their geographical location.
All our reports are typically be emailed to you as an attachment.
To order any available report you need to register on our website. The payment can be made either through CCAvenue or PayPal payments gateways which accept all international cards.
We extend our support to 6 months post sale. A post sale customization is also provided to cover your unmet needs in the report.
Request Customization
We offer complimentary customization of up to 15% with every purchase. To share your customization requirements, feel free to email us at info@strategymrc.com or call us on +1-301-202-5929. .
Please Note: Customization within the 15% threshold is entirely free of charge. If your request exceeds this limit, we will conduct a feasibility assessment. Following that, a detailed quote and timeline will be provided.
WHY CHOOSE US ?

Assured Quality
Best in class reports with high standard of research integrity

24X7 Research Support
Continuous support to ensure the best customer experience.

Free Customization
Adding more values to your product of interest.

Safe & Secure Access
Providing a secured environment for all online transactions.

Trusted by 600+ Brands
Serving the most reputed brands across the world.