
Smart Learning Market
Smart Learning Market Forecasts to 2032 - Global Analysis By Component (Hardware, Software and Services), Learning Type, Deployment Mode, Technology, End User and By Geography

|
Years Covered |
2022-2030 |
|
Estimated Year Value (2024) |
US $101.2 BN |
|
Projected Year Value (2030) |
US $456.5 BN |
|
CAGR (2024 - 2030) |
24% |
|
Regions Covered |
North America, Europe, Asia Pacific, South America, and Middle East & Africa |
|
Countries Covered |
US, Canada, Mexico, Germany, UK, Italy, France, Spain, Japan, China, India, Australia, New Zealand, South Korea, Rest of Asia Pacific, South America, Argentina, Brazil, Chile, Middle East & Africa, Saudi Arabia, UAE, Qatar, and South Africa |
|
Largest Market |
Asia Pacific |
|
Highest Growing Market |
North America |
According to Stratistics MRC, the Global Smart Learning Market is accounted for $101.2 billion in 2025 and is expected to reach $456.5 billion by 2032 growing at a CAGR of 24% during the forecast period. The term ""smart learning"" is a cutting-edge, technologically orientated teaching strategy that incorporates digital tools, resources, and platforms to improve student learning. It uses data analytics, interactive material, and artificial intelligence to give students individualised, flexible learning routes. Real-time feedback, teamwork, and access to a variety of resources are made possible by smart learning, which promotes a more dynamic and interesting learning environment. This approach makes education more effective, efficient, and customised to each student's requirements and preferences by enabling them to learn at their own pace, fostering critical thinking, and guaranteeing better accessibility.
Market Dynamics:
Driver:
Hybrid learning models
Hybrid learning models are transforming the smart learning market by combining traditional in-person education with digital tools, offering a flexible, personalized experience. These models enable real-time interaction, enhance engagement, and boost efficiency through AI and data analytics. The growing demand for lifelong learning and upskilling drives market growth, and hybrid learning is being adopted by educational institutions and corporate sectors for its cost-effectiveness and wide-reaching capabilities.
Restraint:
Resistance to AI integration
A lack of faith in technology and concerns about job displacement are the main reasons why many educational institutions and educators are reluctant to embrace AI. The adoption of individualised learning strategies that improve student engagement and results is slowed down by this resistance. Institutions lose out on data-driven insights that could enhance curriculum design and learning effectiveness in the absence of AI. The opposition is further fuelled by high upfront expenses and worries about data privacy. Because of this, in many educational contexts, the full potential of smart learning technology is yet unrealised.
Opportunity:
Rural education expansion
Smart classrooms and e-learning technologies become more widely available as internet connectivity improves in rural regions. The use of educational technology is fuelled by government programs and funding for rural education. For edtech companies that target underserved locations, this results in an expanding consumer base. Using AI-powered content and virtual instruction, smart learning also aids in addressing the teacher shortage in rural areas. All things considered, expanding education in rural areas creates new markets and speeds up the digital transformation of education.
Threat:
Technological dependence
Students in isolated or undeveloped regions with little access to devices or the internet may be excluded if they rely too heavily on technology. Regular hardware or software malfunctions might interfere with learning and lower its quality and consistency. Furthermore, ongoing training is necessary due to platforms' frequent changes and evolution, which can be expensive and time-consuming. Some consumers are discouraged from utilising smart learning products to their full potential due to concerns about cybersecurity and data protection. Finally, too much screen time and little in-person engagement can affect students' social and cognitive development.
Covid-19 Impact
The COVID-19 pandemic significantly accelerated the growth of the smart learning market. With schools and universities shifting to online and hybrid learning, demand for digital education tools, platforms, and technologies surged. The need for virtual classrooms, e-learning solutions, and interactive educational content increased globally. This shift highlighted the importance of smart learning solutions, boosting investments in technologies like AI, AR/VR, and cloud-based platforms. The market is expected to continue growing as remote learning becomes more integrated into traditional education systems.
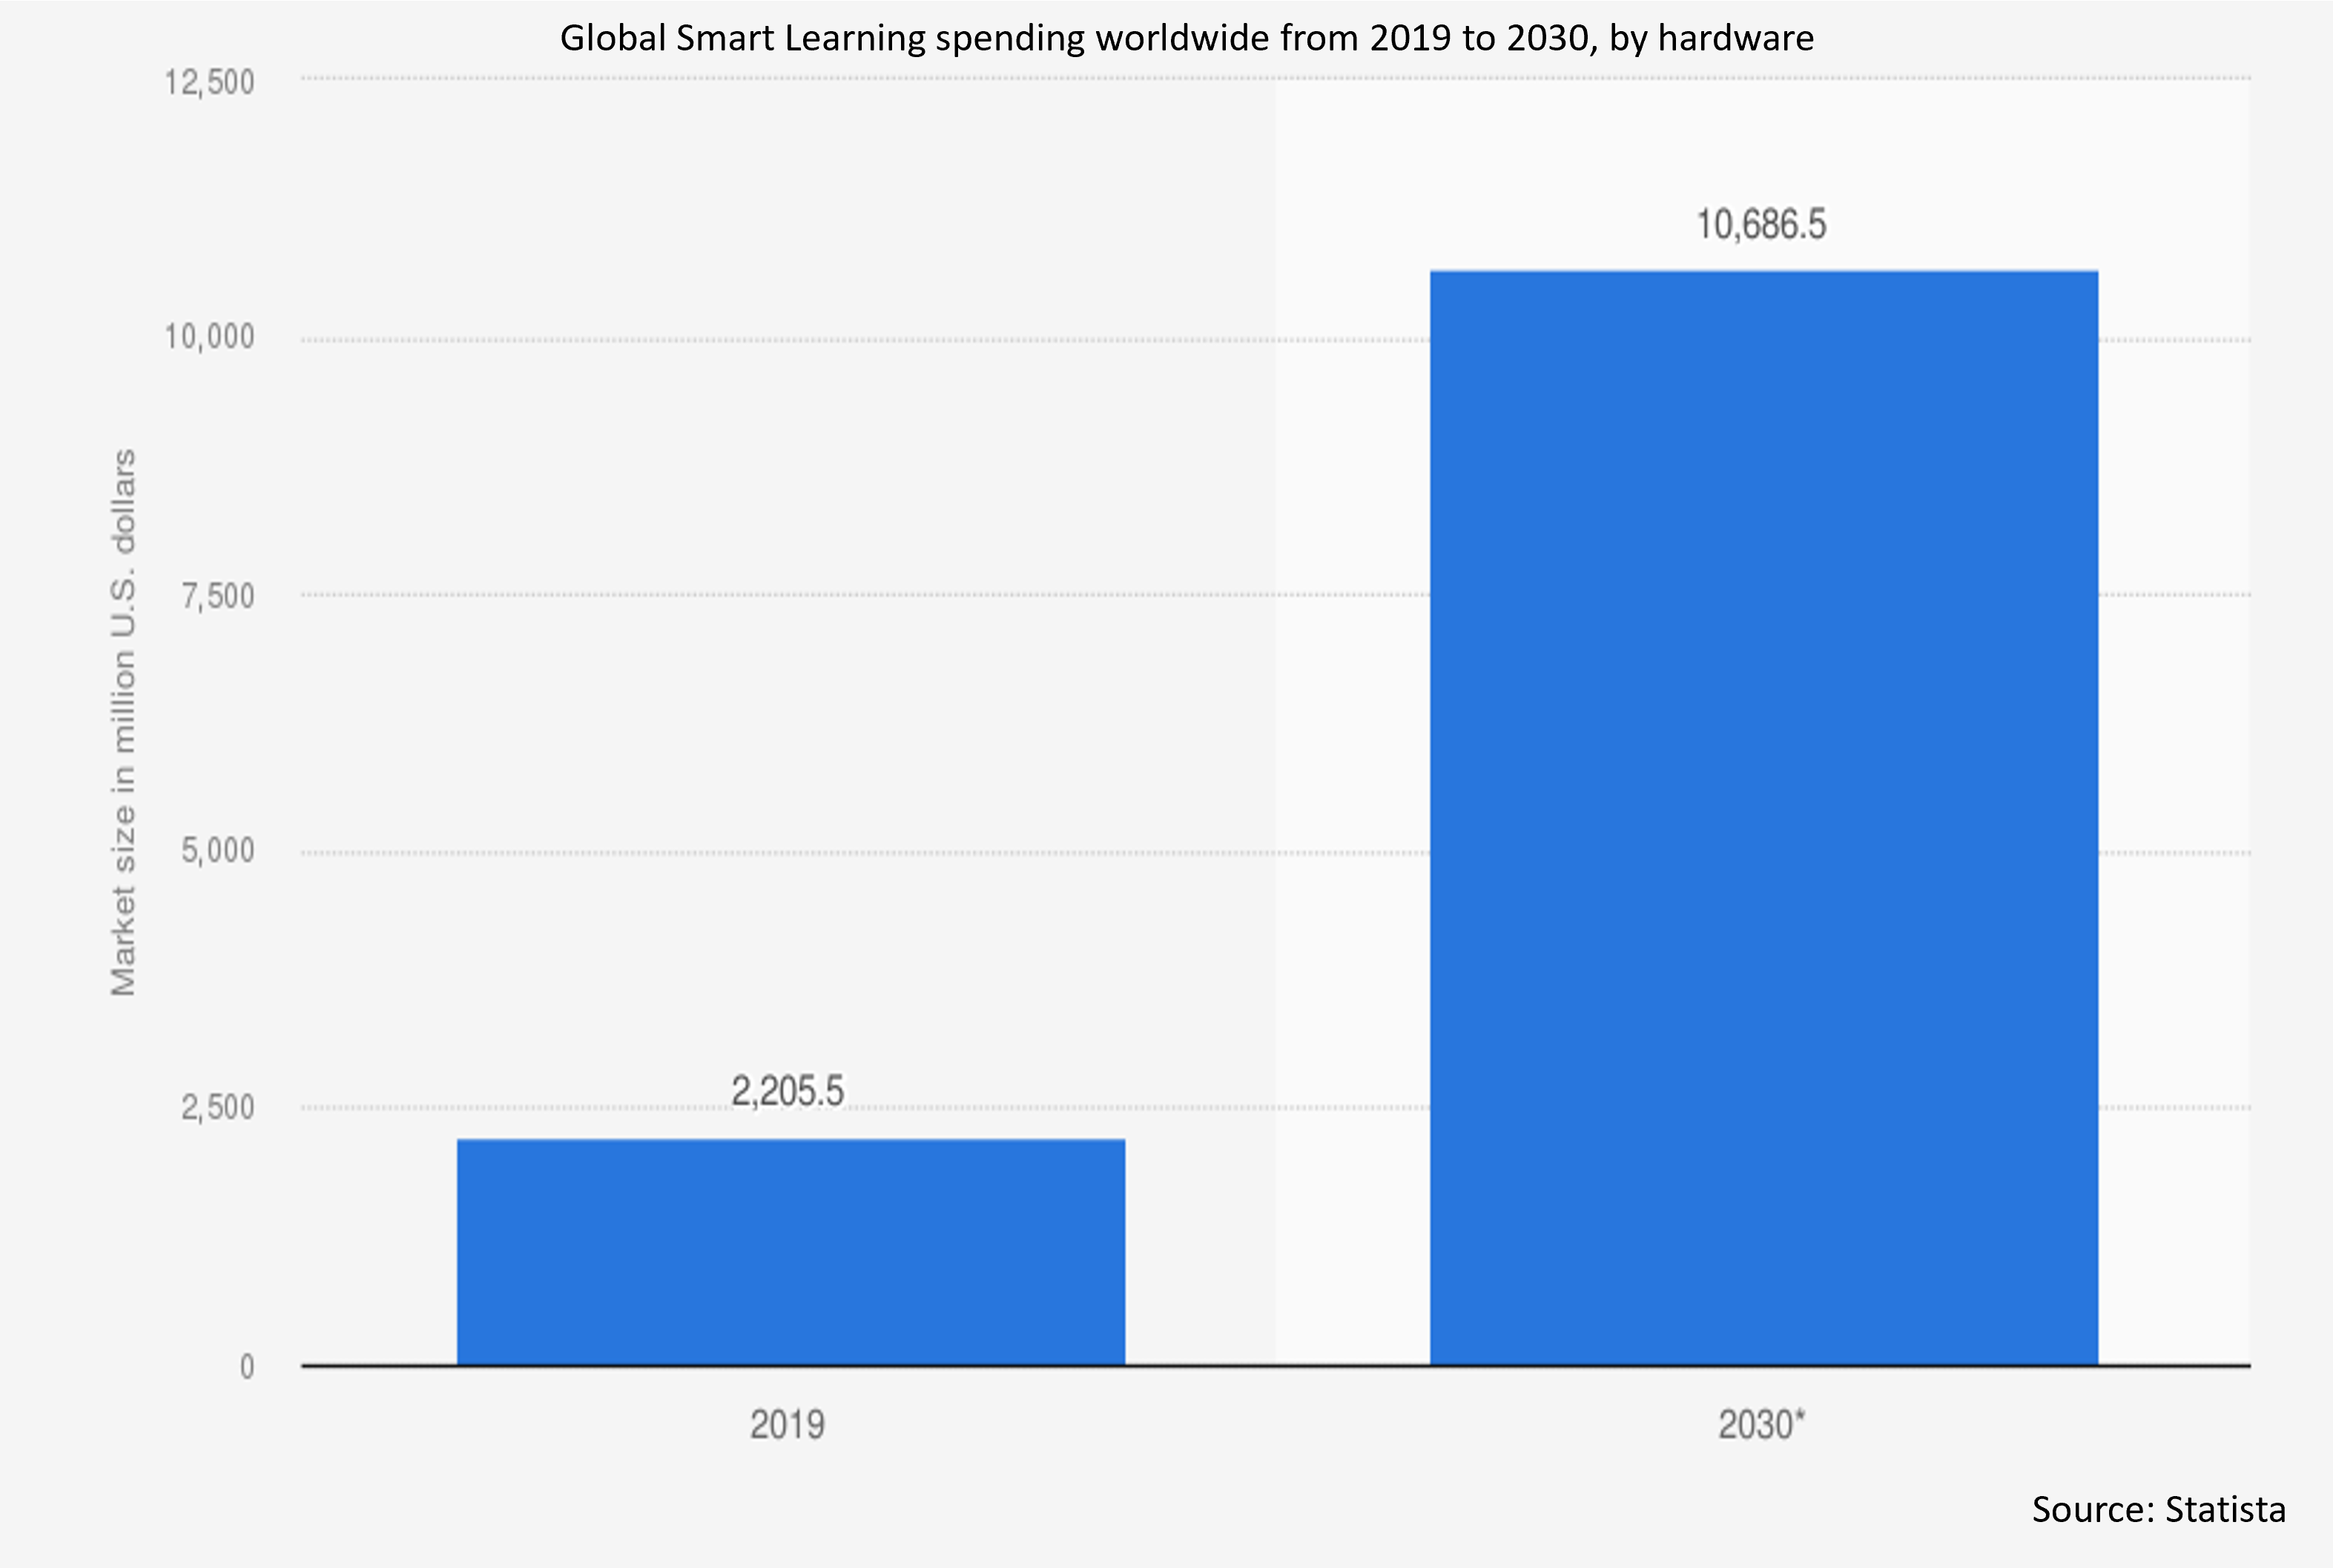
The hardware segment is expected to be the largest during the forecast period
The hardware segment is expected to account for the largest market share during the forecast period by providing the essential infrastructure for digital education. Smart projectors, iPads, AR/VR headsets, and interactive whiteboards are some of the gadgets that improve student participation and interaction in the classroom. Remote and customised learning experiences are made possible by the increasing use of portable devices. The need for cutting-edge hardware solutions is increased by rising investments in educational institutions to upgrade their digital infrastructure. Furthermore, learning gadgets' incorporation of AI and IoT is propelling the market's hardware segment's expansion.
The corporate segment is expected to have the highest CAGR during the forecast period
Over the forecast period, the corporate segment is predicted to witness the highest growth rate, due to the demand for upskilling and continuous employee training. Smart learning tools are being used by businesses more and more to increase worker productivity and flexibility. AI-powered material and cloud-based learning platforms facilitate the simplification of corporate training initiatives. Trends towards remote work have increased need for adaptable, technologically advanced learning solutions. As a result, business expenditures on intelligent learning technologies keep rising, influencing market growth.
Region with largest share:
During the forecast period, the Asia Pacific region is expected to hold the largest market share due to rising internet penetration, growing smartphone adoption, and increasing government investments in digital education. Countries like China, India, Japan, and South Korea are at the forefront, embracing AI-driven learning platforms, virtual classrooms, and personalized education tools. The demand for flexible, interactive, and accessible learning solutions is surging among students and professionals alike. This dynamic growth reflects the region's commitment to transforming traditional education through advanced technologies.
Region with highest CAGR:
Over the forecast period, the North America region is anticipated to exhibit the highest CAGR, driven by advancements in technology, widespread internet penetration, and increasing demand for personalized education. With the integration of AI, AR/VR, and cloud-based platforms, educational institutions and corporate training centers are transforming traditional learning into dynamic, interactive experiences. The region’s strong digital infrastructure, coupled with government initiatives and investments in e-learning, is further accelerating adoption. Key players are focusing on innovation to enhance accessibility, engagement, and outcomes across diverse learner segments.

Key players in the market
Some of the key players profiled in the Smart Learning Market include IBM Corporation, Microsoft Corporation, Google, Apple Inc., Pearson Education, Samsung Electronics, NVIDIA Corporation, Lenovo Group Limited, Cisco Systems, Inc., Blackboard Inc., D2L, McGraw-Hill Education, Knewton, Houghton Mifflin Harcourt, Coursera, Udemy, Vernier Software & Technology and Quizlet.
Key Developments:
In February 2025, IBM completed the acquisition of HashiCorp, a move aimed at bolstering its capabilities in managing hybrid cloud environments and enhancing its generative AI portfolio, especially the watsonx suite. This acquisition is expected to contribute to IBM's revenue growth and expand its market footprint.
In February 2024, IBM and Wipro expanded their partnership to launch the Wipro Enterprise AI-Ready Platform, leveraging IBM's watsonx AI and data platform. This platform aims to accelerate enterprise adoption of generative AI by providing customized AI environments, integrating tools, large language models, streamlined processes, and robust governance.
Components Covered:
• Hardware
• Software
• Services
Learning Types Covered:
• Synchronous Learning
• Asynchronous Learning
• Blended Learning
• Collaborative Learning
• Other Learning Types
Deployment Modes Covered:
• On-Premise
• Cloud-Based
Technologies Covered:
• Artificial Intelligence (AI)
• Augmented Reality (AR) / Virtual Reality (VR)
• Machine Learning (ML)
• Internet of Things (IoT)
• Blockchain
• Big Data Analytics
• Other Technologies
End Users Covered:
• Academic
• Corporate
• Government
• Other End Users
Regions Covered:
• North America
o US
o Canada
o Mexico
• Europe
o Germany
o UK
o Italy
o France
o Spain
o Rest of Europe
• Asia Pacific
o Japan
o China
o India
o Australia
o New Zealand
o South Korea
o Rest of Asia Pacific
• South America
o Argentina
o Brazil
o Chile
o Rest of South America
• Middle East & Africa
o Saudi Arabia
o UAE
o Qatar
o South Africa
o Rest of Middle East & Africa
What our report offers:
- Market share assessments for the regional and country-level segments
- Strategic recommendations for the new entrants
- Covers Market data for the years 2024, 2025, 2026, 2028, and 2032
- Market Trends (Drivers, Constraints, Opportunities, Threats, Challenges, Investment Opportunities, and recommendations)
- Strategic recommendations in key business segments based on the market estimations
- Competitive landscaping mapping the key common trends
- Company profiling with detailed strategies, financials, and recent developments
- Supply chain trends mapping the latest technological advancements
Free Customization Offerings:
All the customers of this report will be entitled to receive one of the following free customization options:
• Company Profiling
o Comprehensive profiling of additional market players (up to 3)
o SWOT Analysis of key players (up to 3)
• Regional Segmentation
o Market estimations, Forecasts and CAGR of any prominent country as per the client's interest (Note: Depends on feasibility check)
• Competitive Benchmarking
o Benchmarking of key players based on product portfolio, geographical presence, and strategic alliances
Table of Contents
1 Executive Summary
2 Preface
2.1 Abstract
2.2 Stake Holders
2.3 Research Scope
2.4 Research Methodology
2.4.1 Data Mining
2.4.2 Data Analysis
2.4.3 Data Validation
2.4.4 Research Approach
2.5 Research Sources
2.5.1 Primary Research Sources
2.5.2 Secondary Research Sources
2.5.3 Assumptions
3 Market Trend Analysis
3.1 Introduction
3.2 Drivers
3.3 Restraints
3.4 Opportunities
3.5 Threats
3.6 End User Analysis
3.7 Emerging Markets
3.8 Impact of Covid-19
4 Porters Five Force Analysis
4.1 Bargaining power of suppliers
4.2 Bargaining power of buyers
4.3 Threat of substitutes
4.4 Threat of new entrants
4.5 Competitive rivalry
5 Global Smart Learning Market, By Component
5.1 Introduction
5.2 Hardware
5.2.1 Interactive Whiteboards
5.2.2 Tablets & Mobile Devices
5.2.3 Smartboards
5.2.4 VR Headsets
5.2.5 Projectors
5.3 Software
5.3.1 Learning Management Systems (LMS)
5.3.2 Enterprise Resource Planning (ERP)
5.3.3 Adaptive Learning Platforms
5.3.4 Assessment Systems
5.4 Services
5.4.1 Managed Services
5.4.2 Professional Services
6 Global Smart Learning Market, By Learning Type
6.1 Introduction
6.2 Synchronous Learning
6.3 Asynchronous Learning
6.4 Blended Learning
6.5 Collaborative Learning
6.6 Other Learning Types
7 Global Smart Learning Market, By Deployment Mode
7.1 Introduction
7.2 On-Premise
7.3 Cloud-Based
8 Global Smart Learning Market, By Technology
8.1 Introduction
8.2 Artificial Intelligence (AI)
8.3 Augmented Reality (AR) / Virtual Reality (VR)
8.4 Machine Learning (ML)
8.5 Internet of Things (IoT)
8.6 Blockchain
8.7 Big Data Analytics
8.8 Other Technologies
9 Global Smart Learning Market, By End User
9.1 Introduction
9.2 Academic
9.3 Corporate
9.4 Government
9.5 Other End Users
10 Global Smart Learning Market, By Geography
10.1 Introduction
10.2 North America
10.2.1 US
10.2.2 Canada
10.2.3 Mexico
10.3 Europe
10.3.1 Germany
10.3.2 UK
10.3.3 Italy
10.3.4 France
10.3.5 Spain
10.3.6 Rest of Europe
10.4 Asia Pacific
10.4.1 Japan
10.4.2 China
10.4.3 India
10.4.4 Australia
10.4.5 New Zealand
10.4.6 South Korea
10.4.7 Rest of Asia Pacific
10.5 South America
10.5.1 Argentina
10.5.2 Brazil
10.5.3 Chile
10.5.4 Rest of South America
10.6 Middle East & Africa
10.6.1 Saudi Arabia
10.6.2 UAE
10.6.3 Qatar
10.6.4 South Africa
10.6.5 Rest of Middle East & Africa
11 Key Developments
11.1 Agreements, Partnerships, Collaborations and Joint Ventures
11.2 Acquisitions & Mergers
11.3 New Product Launch
11.4 Expansions
11.5 Other Key Strategies
12 Company Profiling
12.1 IBM Corporation
12.2 Microsoft Corporation
12.3 Google
12.4 Apple Inc.
12.5 Pearson Education
12.6 Samsung Electronics
12.7 NVIDIA Corporation
12.8 Lenovo Group Limited
12.9 Cisco Systems, Inc.
12.10 Blackboard Inc.
12.11 D2L
12.12 McGraw-Hill Education
12.13 Knewton
12.14 Houghton Mifflin Harcourt
12.15 Coursera
12.16 Udemy
12.17 Quizlet
12.18 Vernier Software & Technology
List of Tables
1 Global Smart Learning Market Outlook, By Region (2024-2032) ($MN)
2 Global Smart Learning Market Outlook, By Component (2024-2032) ($MN)
3 Global Smart Learning Market Outlook, By Hardware (2024-2032) ($MN)
4 Global Smart Learning Market Outlook, By Interactive Whiteboards (2024-2032) ($MN)
5 Global Smart Learning Market Outlook, By Tablets & Mobile Devices (2024-2032) ($MN)
6 Global Smart Learning Market Outlook, By Smartboards (2024-2032) ($MN)
7 Global Smart Learning Market Outlook, By VR Headsets (2024-2032) ($MN)
8 Global Smart Learning Market Outlook, By Projectors (2024-2032) ($MN)
9 Global Smart Learning Market Outlook, By Software (2024-2032) ($MN)
10 Global Smart Learning Market Outlook, By Learning Management Systems (LMS) (2024-2032) ($MN)
11 Global Smart Learning Market Outlook, By Enterprise Resource Planning (ERP) (2024-2032) ($MN)
12 Global Smart Learning Market Outlook, By Adaptive Learning Platforms (2024-2032) ($MN)
13 Global Smart Learning Market Outlook, By Assessment Systems (2024-2032) ($MN)
14 Global Smart Learning Market Outlook, By Services (2024-2032) ($MN)
15 Global Smart Learning Market Outlook, By Managed Services (2024-2032) ($MN)
16 Global Smart Learning Market Outlook, By Professional Services (2024-2032) ($MN)
17 Global Smart Learning Market Outlook, By Learning Type (2024-2032) ($MN)
18 Global Smart Learning Market Outlook, By Synchronous Learning (2024-2032) ($MN)
19 Global Smart Learning Market Outlook, By Asynchronous Learning (2024-2032) ($MN)
20 Global Smart Learning Market Outlook, By Blended Learning (2024-2032) ($MN)
21 Global Smart Learning Market Outlook, By Collaborative Learning (2024-2032) ($MN)
22 Global Smart Learning Market Outlook, By Other Learning Types (2024-2032) ($MN)
23 Global Smart Learning Market Outlook, By Deployment Mode (2024-2032) ($MN)
24 Global Smart Learning Market Outlook, By On-Premise (2024-2032) ($MN)
25 Global Smart Learning Market Outlook, By Cloud-Based (2024-2032) ($MN)
26 Global Smart Learning Market Outlook, By Technology (2024-2032) ($MN)
27 Global Smart Learning Market Outlook, By Artificial Intelligence (AI) (2024-2032) ($MN)
28 Global Smart Learning Market Outlook, By Augmented Reality (AR) / Virtual Reality (VR) (2024-2032) ($MN)
29 Global Smart Learning Market Outlook, By Machine Learning (ML) (2024-2032) ($MN)
30 Global Smart Learning Market Outlook, By Internet of Things (IoT) (2024-2032) ($MN)
31 Global Smart Learning Market Outlook, By Blockchain (2024-2032) ($MN)
32 Global Smart Learning Market Outlook, By Big Data Analytics (2024-2032) ($MN)
33 Global Smart Learning Market Outlook, By Other Technologies (2024-2032) ($MN)
34 Global Smart Learning Market Outlook, By End User (2024-2032) ($MN)
35 Global Smart Learning Market Outlook, By Academic (2024-2032) ($MN)
36 Global Smart Learning Market Outlook, By Corporate (2024-2032) ($MN)
37 Global Smart Learning Market Outlook, By Government (2024-2032) ($MN)
38 Global Smart Learning Market Outlook, By Other End Users (2024-2032) ($MN)
Note: Tables for North America, Europe, APAC, South America, and Middle East & Africa Regions are also represented in the same manner as above.
List of Figures
RESEARCH METHODOLOGY

We at ‘Stratistics’ opt for an extensive research approach which involves data mining, data validation, and data analysis. The various research sources include in-house repository, secondary research, competitor’s sources, social media research, client internal data, and primary research.
Our team of analysts prefers the most reliable and authenticated data sources in order to perform the comprehensive literature search. With access to most of the authenticated data bases our team highly considers the best mix of information through various sources to obtain extensive and accurate analysis.
Each report takes an average time of a month and a team of 4 industry analysts. The time may vary depending on the scope and data availability of the desired market report. The various parameters used in the market assessment are standardized in order to enhance the data accuracy.
Data Mining
The data is collected from several authenticated, reliable, paid and unpaid sources and is filtered depending on the scope & objective of the research. Our reports repository acts as an added advantage in this procedure. Data gathering from the raw material suppliers, distributors and the manufacturers is performed on a regular basis, this helps in the comprehensive understanding of the products value chain. Apart from the above mentioned sources the data is also collected from the industry consultants to ensure the objective of the study is in the right direction.
Market trends such as technological advancements, regulatory affairs, market dynamics (Drivers, Restraints, Opportunities and Challenges) are obtained from scientific journals, market related national & international associations and organizations.
Data Analysis
From the data that is collected depending on the scope & objective of the research the data is subjected for the analysis. The critical steps that we follow for the data analysis include:
- Product Lifecycle Analysis
- Competitor analysis
- Risk analysis
- Porters Analysis
- PESTEL Analysis
- SWOT Analysis
The data engineering is performed by the core industry experts considering both the Marketing Mix Modeling and the Demand Forecasting. The marketing mix modeling makes use of multiple-regression techniques to predict the optimal mix of marketing variables. Regression factor is based on a number of variables and how they relate to an outcome such as sales or profits.
Data Validation
The data validation is performed by the exhaustive primary research from the expert interviews. This includes telephonic interviews, focus groups, face to face interviews, and questionnaires to validate our research from all aspects. The industry experts we approach come from the leading firms, involved in the supply chain ranging from the suppliers, distributors to the manufacturers and consumers so as to ensure an unbiased analysis.
We are in touch with more than 15,000 industry experts with the right mix of consultants, CEO's, presidents, vice presidents, managers, experts from both supply side and demand side, executives and so on.
The data validation involves the primary research from the industry experts belonging to:
- Leading Companies
- Suppliers & Distributors
- Manufacturers
- Consumers
- Industry/Strategic Consultants
Apart from the data validation the primary research also helps in performing the fill gap research, i.e. providing solutions for the unmet needs of the research which helps in enhancing the reports quality.
For more details about research methodology, kindly write to us at info@strategymrc.com
Frequently Asked Questions
In case of any queries regarding this report, you can contact the customer service by filing the “Inquiry Before Buy” form available on the right hand side. You may also contact us through email: info@strategymrc.com or phone: +1-301-202-5929
Yes, the samples are available for all the published reports. You can request them by filling the “Request Sample” option available in this page.
Yes, you can request a sample with your specific requirements. All the customized samples will be provided as per the requirement with the real data masked.
All our reports are available in Digital PDF format. In case if you require them in any other formats, such as PPT, Excel etc you can submit a request through “Inquiry Before Buy” form available on the right hand side. You may also contact us through email: info@strategymrc.com or phone: +1-301-202-5929
We offer a free 15% customization with every purchase. This requirement can be fulfilled for both pre and post sale. You may send your customization requirements through email at info@strategymrc.com or call us on +1-301-202-5929.
We have 3 different licensing options available in electronic format.
- Single User Licence: Allows one person, typically the buyer, to have access to the ordered product. The ordered product cannot be distributed to anyone else.
- 2-5 User Licence: Allows the ordered product to be shared among a maximum of 5 people within your organisation.
- Corporate License: Allows the product to be shared among all employees of your organisation regardless of their geographical location.
All our reports are typically be emailed to you as an attachment.
To order any available report you need to register on our website. The payment can be made either through CCAvenue or PayPal payments gateways which accept all international cards.
We extend our support to 6 months post sale. A post sale customization is also provided to cover your unmet needs in the report.
Request Customization
We offer complimentary customization of up to 15% with every purchase. To share your customization requirements, feel free to email us at info@strategymrc.com or call us on +1-301-202-5929. .
Please Note: Customization within the 15% threshold is entirely free of charge. If your request exceeds this limit, we will conduct a feasibility assessment. Following that, a detailed quote and timeline will be provided.
WHY CHOOSE US ?

Assured Quality
Best in class reports with high standard of research integrity

24X7 Research Support
Continuous support to ensure the best customer experience.

Free Customization
Adding more values to your product of interest.

Safe & Secure Access
Providing a secured environment for all online transactions.

Trusted by 600+ Brands
Serving the most reputed brands across the world.