
Smart Packaging Market
Smart Packaging Market Forecasts to 2032 - Global Analysis By Type (Modified Atmosphere Packaging (MAP), Active Packaging and Intelligent Packaging), Material, Application and By Geography

|
Years Covered |
2022-2032 |
|
Estimated Year Value (2025) |
US $26.1 BN |
|
Projected Year Value (2032) |
US $40.0 BN |
|
CAGR (2025 - 2032) |
6.3% |
|
Regions Covered |
North America, Europe, Asia Pacific, South America, and Middle East & Africa |
|
Countries Covered |
US, Canada, Mexico, Germany, UK, Italy, France, Spain, Japan, China, India, Australia, New Zealand, South Korea, Rest of Asia Pacific, South America, Argentina, Brazil, Chile, Middle East & Africa, Saudi Arabia, UAE, Qatar, and South Africa |
|
Largest Market |
Asia Pacific |
|
Highest Growing Market |
North America |
According to Stratistics MRC, the Global Smart Packaging Market is accounted for $26.1 billion in 2025 and is expected to reach $40.0 billion by 2032 growing at a CAGR of 6.3% during the forecast period. Smart Packaging integrates innovative technologies directly into product packaging to enhance functionality beyond traditional containment and protection. This can include QR codes, NFC tags, RFID, sensors, and indicators that monitor product freshness, authenticity, or environmental conditions. Benefits range from improved supply chain visibility, enhanced consumer engagement through interactive content, and anti-counterfeiting measures, to real-time product tracking and waste reduction by signaling spoilage.
According to recent industry research by Zebra Technologies, investment in smart packaging technologies, including RFID packaging, sensors, and augmented reality, is expected to increase significantly, reaching 35% adoption by 2024, up from 29% in 2019.
Market Dynamics:
Driver:
Technological advancements in IoT and NFC
The smart packaging market is driven by rapid advancements in IoT and NFC technologies, enabling real-time tracking and product authentication. These technologies enhance supply chain transparency, reducing losses from counterfeiting and spoilage. The integration of smart sensors in packaging monitors product freshness, particularly in food and pharmaceuticals. Growing consumer demand for interactive packaging, such as QR codes and NFC tags, boosts market adoption. Retailers leverage IoT-enabled packaging to optimize inventory and improve customer engagement. The rise of e-commerce further fuels the need for smart packaging solutions to ensure product integrity.
Restraint:
Integration challenges with existing supply chains
Integrating smart packaging technologies with legacy supply chain systems poses significant technical challenges. The high cost of upgrading infrastructure to support IoT and NFC limits adoption among smaller firms. Compatibility issues between smart packaging solutions and existing logistics platforms create inefficiencies. The need for specialized training to manage smart packaging systems increases operational costs. Many supply chain stakeholders lack the expertise to implement these technologies effectively. These integration hurdles slow the widespread adoption of smart packaging solutions.
Opportunity:
Development of novel sensor technologies
The development of advanced sensor technologies, such as biosensors and temperature sensors, presents significant growth opportunities for smart packaging. These sensors enable real-time monitoring of product conditions, enhancing safety in food and pharmaceutical industries. Innovations in low-cost, eco-friendly sensors make smart packaging accessible to smaller businesses. Partnerships between packaging firms and tech providers drive the creation of customized sensor solutions. The growing demand for sustainable packaging solutions encourages investment in biodegradable smart sensors. These advancements are expected to expand the market by addressing diverse industry needs.
Threat:
Consumer awareness and adoption challenges
Limited consumer awareness of smart packaging benefits, such as product tracking and authentication, hinders market growth. The complexity of interacting with smart packaging features, like NFC tags, may deter non-tech-savvy consumers. High costs associated with smart packaging can lead to higher product prices, reducing consumer adoption. Concerns over data privacy related to IoT-enabled packaging may discourage usage. The lack of standardized protocols for smart packaging technologies creates confusion among consumers. These challenges threaten the market’s ability to achieve widespread acceptance.
Covid-19 Impact:
The COVID-19 pandemic accelerated the adoption of smart packaging as e-commerce surged and supply chain transparency became critical. The need for contactless delivery systems drove demand for NFC-enabled packaging for secure transactions. Disruptions in global supply chains highlighted the importance of IoT for real-time tracking and inventory management. However, initial supply chain constraints delayed the production of smart packaging components. Post-pandemic, the focus on supply chain resilience continues to drive market growth.
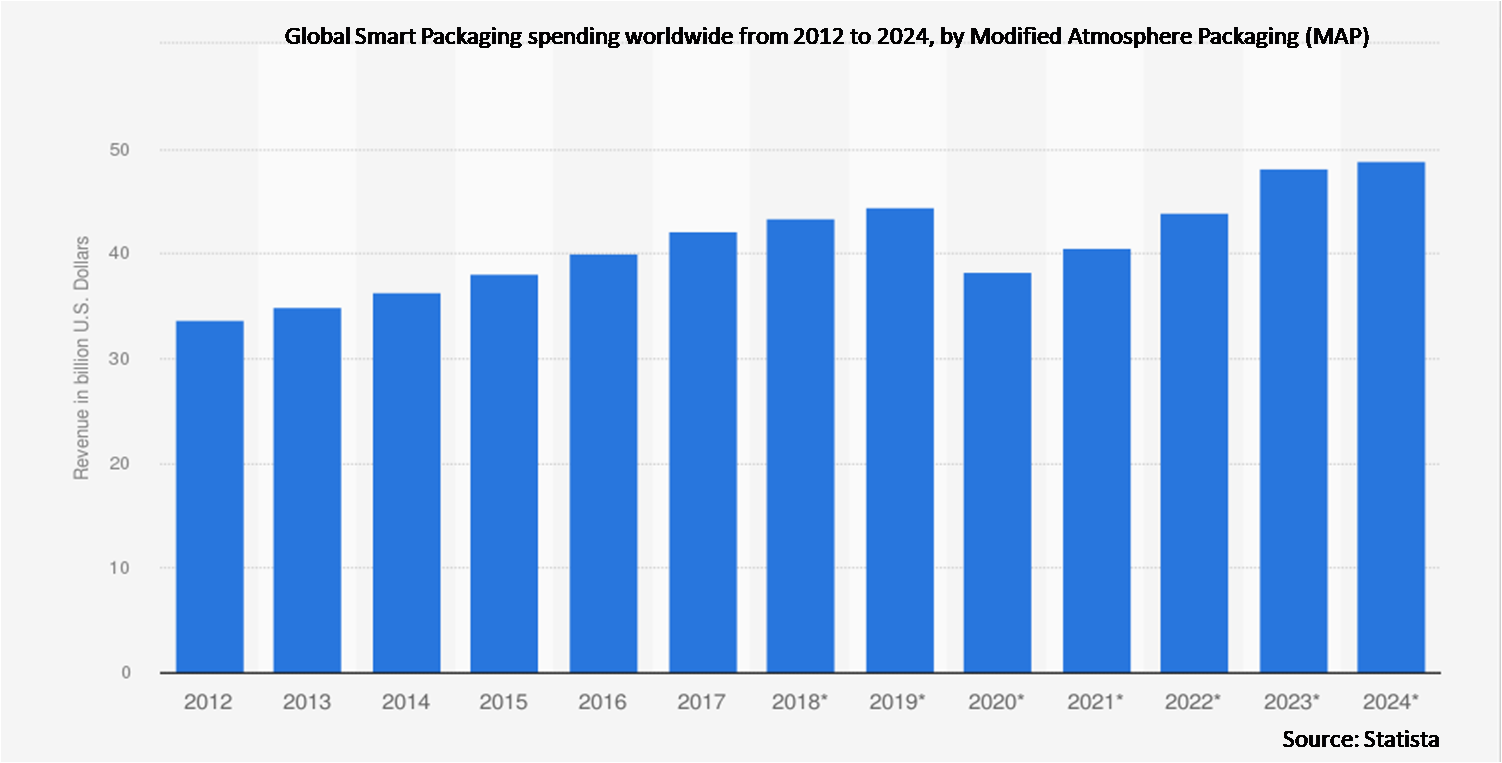
The modified atmosphere packaging (MAP) segment is expected to be the largest during the forecast period
The modified atmosphere packaging (MAP) segment is expected to account for the largest market share during the forecast period owing to its widespread use in extending the shelf life of perishable goods. MAP technologies, integrated with smart sensors, monitor gas levels to ensure product freshness. The growing demand for packaged food and beverages drives adoption in the retail sector. Advances in IoT enable real-time monitoring of MAP conditions, enhancing supply chain efficiency. The segment benefits from its applicability across food, pharmaceutical, and healthcare industries. Consumer preference for sustainable and safe packaging further supports MAP’s dominance.
The plastics segment is expected to have the highest CAGR during the forecast period
Over the forecast period, the plastics segment is predicted to witness the highest growth rate impelled by, the increasing adoption of IoT and NFC for real-time product tracking. Innovations in smart labels and sensors enhance product authentication and consumer engagement. The segment’s growth is driven by demand for transparency in food and pharmaceutical supply chains. Integration with mobile apps allows consumers to access product information via QR codes and NFC tags. Investments in eco-friendly intelligent packaging solutions attract environmentally conscious consumers. The rise of e-commerce and need for secure logistics further accelerate segment growth.
Region with largest share:
During the forecast period, the Asia Pacific region is expected to hold the largest market share, driven by rapid industrialization and e-commerce growth in countries like China and India. The region’s large consumer base and increasing demand for packaged goods fuel market expansion. Government initiatives promoting smart manufacturing and digitalization support the adoption of smart packaging. High smartphone penetration enables widespread use of NFC-enabled packaging. The growing food and pharmaceutical industries in the region drive demand for smart sensors. Investments in supply chain modernization further boost market growth.
Region with highest CAGR:
Over the forecast period, the North America region is anticipated to exhibit the highest CAGR attributed to its advanced technological infrastructure and early adoption of smart packaging solutions. The presence of major players like Avery Dennison and 3M drives innovation in IoT and NFC technologies. High consumer demand for traceable and sustainable packaging fuels market growth. The region’s strong e-commerce sector supports the adoption of intelligent packaging for logistics. Investments in R&D for eco-friendly smart packaging solutions enhance market competitiveness. The focus on supply chain transparency and regulatory compliance accelerates market expansion.

Key players in the market
Some of the key players in Smart Packaging Market include Sealed Air Corporation, Multisorb Technologies, Amcor PLC, Ball Corporation, Huhtamaki OYJ, Stora Enso, Avery Dennison Corporation, Zebra Technologies Corporation, 3M Company, International Paper Company, Timestrip PLC, Sysco Corporation, Paksense Incorporated, M & G USA Corporation, and BASF SE
Key Developments:
In May 2025, Sealed Air Corporation unveiled a line of smart food packaging that integrates time-temperature indicators and QR-based freshness tracking for perishable goods.
In March 2025, Amcor PLC collaborated with a European dairy brand to integrate interactive QR codes on packaging for improved consumer engagement and supply chain transparency.
In February 2025, Stora Enso introduced an NFC-tagged eco-packaging solution that enables direct brand-to-consumer communication and smart recycling instructions.
Types Covered:
• Modified Atmosphere Packaging (MAP)
• Active Packaging
• Intelligent Packaging
Materials Covered:
• Plastics
• Paper & Paperboard
• Metal
• Glass
Applications Covered:
• Food & Beverages
• Personal Care & Cosmetics
• Pharmaceuticals
• Electronics
• E-commerce
• Other Applications
Regions Covered:
• North America
o US
o Canada
o Mexico
• Europe
o Germany
o UK
o Italy
o France
o Spain
o Rest of Europe
• Asia Pacific
o Japan
o China
o India
o Australia
o New Zealand
o South Korea
o Rest of Asia Pacific
• South America
o Argentina
o Brazil
o Chile
o Rest of South America
• Middle East & Africa
o Saudi Arabia
o UAE
o Qatar
o South Africa
o Rest of Middle East & Africa
What our report offers:
- Market share assessments for the regional and country-level segments
- Strategic recommendations for the new entrants
- Covers Market data for the years 2024, 2025, 2026, 2028, and 2032
- Market Trends (Drivers, Constraints, Opportunities, Threats, Challenges, Investment Opportunities, and recommendations)
- Strategic recommendations in key business segments based on the market estimations
- Competitive landscaping mapping the key common trends
- Company profiling with detailed strategies, financials, and recent developments
- Supply chain trends mapping the latest technological advancements
Free Customization Offerings:
All the customers of this report will be entitled to receive one of the following free customization options:
• Company Profiling
o Comprehensive profiling of additional market players (up to 3)
o SWOT Analysis of key players (up to 3)
• Regional Segmentation
o Market estimations, Forecasts and CAGR of any prominent country as per the client's interest (Note: Depends on feasibility check)
• Competitive Benchmarking
o Benchmarking of key players based on product portfolio, geographical presence, and strategic alliances
Table of Contents
1 Executive Summary
2 Preface
2.1 Abstract
2.2 Stake Holders
2.3 Research Scope
2.4 Research Methodology
2.4.1 Data Mining
2.4.2 Data Analysis
2.4.3 Data Validation
2.4.4 Research Approach
2.5 Research Sources
2.5.1 Primary Research Sources
2.5.2 Secondary Research Sources
2.5.3 Assumptions
3 Market Trend Analysis
3.1 Introduction
3.2 Drivers
3.3 Restraints
3.4 Opportunities
3.5 Threats
3.6 Application Analysis
3.7 Emerging Markets
3.8 Impact of Covid-19
4 Porters Five Force Analysis
4.1 Bargaining power of suppliers
4.2 Bargaining power of buyers
4.3 Threat of substitutes
4.4 Threat of new entrants
4.5 Competitive rivalry
5 Global Smart Packaging Market, By Type
5.1 Introduction
5.2 Modified Atmosphere Packaging (MAP)
5.3 Active Packaging
5.3.1 Gas Scavengers
5.3.2 Corrosion Control Packaging
5.3.3 Moisture Control Packaging
5.4 Intelligent Packaging
5.4.1 Time Temperature Indicator
5.4.2 Gas Indicator
5.4.3 Thermochromic Ink
6 Global Smart Packaging Market, By Material
6.1 Introduction
6.2 Plastics
6.3 Paper & Paperboard
6.4 Metal
6.5 Glass
7 Global Smart Packaging Market, By Application
7.1 Introduction
7.2 Food & Beverages
7.3 Personal Care & Cosmetics
7.4 Pharmaceuticals
7.5 Electronics
7.6 E-commerce
7.7 Other Applications
8 Global Smart Packaging Market, By Geography
8.1 Introduction
8.2 North America
8.2.1 US
8.2.2 Canada
8.2.3 Mexico
8.3 Europe
8.3.1 Germany
8.3.2 UK
8.3.3 Italy
8.3.4 France
8.3.5 Spain
8.3.6 Rest of Europe
8.4 Asia Pacific
8.4.1 Japan
8.4.2 China
8.4.3 India
8.4.4 Australia
8.4.5 New Zealand
8.4.6 South Korea
8.4.7 Rest of Asia Pacific
8.5 South America
8.5.1 Argentina
8.5.2 Brazil
8.5.3 Chile
8.5.4 Rest of South America
8.6 Middle East & Africa
8.6.1 Saudi Arabia
8.6.2 UAE
8.6.3 Qatar
8.6.4 South Africa
8.6.5 Rest of Middle East & Africa
9 Key Developments
9.1 Agreements, Partnerships, Collaborations and Joint Ventures
9.2 Acquisitions & Mergers
9.3 New Product Launch
9.4 Expansions
9.5 Other Key Strategies
10 Company Profiling
10.1 Sealed Air Corporation
10.2 Multisorb Technologies
10.3 Amcor PLC
10.4 Ball corporation
10.5 Huhtamaki OYJ
10.6 Stora Enso
10.7 Avery Dennison Corporation
10.8 Zebra Technologies Corporation
10.9 3M Company
10.10 International Paper Company
10.11 Timestrip PLC
10.12 Sysco Corporation
10.13 Paksense Incorporated
10.14 M & G USA Corporation
10.15 BASF SE
List of Tables
1 Global Smart Packaging Market Outlook, By Region (2024-2032) ($MN)
2 Global Smart Packaging Market Outlook, By Type (2024-2032) ($MN)
3 Global Smart Packaging Market Outlook, By Modified Atmosphere Packaging (MAP) (2024-2032) ($MN)
4 Global Smart Packaging Market Outlook, By Active Packaging (2024-2032) ($MN)
5 Global Smart Packaging Market Outlook, By Gas Scavengers (2024-2032) ($MN)
6 Global Smart Packaging Market Outlook, By Corrosion Control Packaging (2024-2032) ($MN)
7 Global Smart Packaging Market Outlook, By Moisture Control Packaging (2024-2032) ($MN)
8 Global Smart Packaging Market Outlook, By Intelligent Packaging (2024-2032) ($MN)
9 Global Smart Packaging Market Outlook, By Time Temperature Indicator (2024-2032) ($MN)
10 Global Smart Packaging Market Outlook, By Gas Indicator (2024-2032) ($MN)
11 Global Smart Packaging Market Outlook, By Thermochromic Ink (2024-2032) ($MN)
12 Global Smart Packaging Market Outlook, By Material (2024-2032) ($MN)
13 Global Smart Packaging Market Outlook, By Plastics (2024-2032) ($MN)
14 Global Smart Packaging Market Outlook, By Paper & Paperboard (2024-2032) ($MN)
15 Global Smart Packaging Market Outlook, By Metal (2024-2032) ($MN)
16 Global Smart Packaging Market Outlook, By Glass (2024-2032) ($MN)
17 Global Smart Packaging Market Outlook, By Application (2024-2032) ($MN)
18 Global Smart Packaging Market Outlook, By Food & Beverages (2024-2032) ($MN)
19 Global Smart Packaging Market Outlook, By Personal Care & Cosmetics (2024-2032) ($MN)
20 Global Smart Packaging Market Outlook, By Pharmaceuticals (2024-2032) ($MN)
21 Global Smart Packaging Market Outlook, By Electronics (2024-2032) ($MN)
22 Global Smart Packaging Market Outlook, By E-commerce (2024-2032) ($MN)
23 Global Smart Packaging Market Outlook, By Other Applications (2024-2032) ($MN)
Note: Tables for North America, Europe, APAC, South America, and Middle East & Africa Regions are also represented in the same manner as above.
List of Figures
RESEARCH METHODOLOGY

We at ‘Stratistics’ opt for an extensive research approach which involves data mining, data validation, and data analysis. The various research sources include in-house repository, secondary research, competitor’s sources, social media research, client internal data, and primary research.
Our team of analysts prefers the most reliable and authenticated data sources in order to perform the comprehensive literature search. With access to most of the authenticated data bases our team highly considers the best mix of information through various sources to obtain extensive and accurate analysis.
Each report takes an average time of a month and a team of 4 industry analysts. The time may vary depending on the scope and data availability of the desired market report. The various parameters used in the market assessment are standardized in order to enhance the data accuracy.
Data Mining
The data is collected from several authenticated, reliable, paid and unpaid sources and is filtered depending on the scope & objective of the research. Our reports repository acts as an added advantage in this procedure. Data gathering from the raw material suppliers, distributors and the manufacturers is performed on a regular basis, this helps in the comprehensive understanding of the products value chain. Apart from the above mentioned sources the data is also collected from the industry consultants to ensure the objective of the study is in the right direction.
Market trends such as technological advancements, regulatory affairs, market dynamics (Drivers, Restraints, Opportunities and Challenges) are obtained from scientific journals, market related national & international associations and organizations.
Data Analysis
From the data that is collected depending on the scope & objective of the research the data is subjected for the analysis. The critical steps that we follow for the data analysis include:
- Product Lifecycle Analysis
- Competitor analysis
- Risk analysis
- Porters Analysis
- PESTEL Analysis
- SWOT Analysis
The data engineering is performed by the core industry experts considering both the Marketing Mix Modeling and the Demand Forecasting. The marketing mix modeling makes use of multiple-regression techniques to predict the optimal mix of marketing variables. Regression factor is based on a number of variables and how they relate to an outcome such as sales or profits.
Data Validation
The data validation is performed by the exhaustive primary research from the expert interviews. This includes telephonic interviews, focus groups, face to face interviews, and questionnaires to validate our research from all aspects. The industry experts we approach come from the leading firms, involved in the supply chain ranging from the suppliers, distributors to the manufacturers and consumers so as to ensure an unbiased analysis.
We are in touch with more than 15,000 industry experts with the right mix of consultants, CEO's, presidents, vice presidents, managers, experts from both supply side and demand side, executives and so on.
The data validation involves the primary research from the industry experts belonging to:
- Leading Companies
- Suppliers & Distributors
- Manufacturers
- Consumers
- Industry/Strategic Consultants
Apart from the data validation the primary research also helps in performing the fill gap research, i.e. providing solutions for the unmet needs of the research which helps in enhancing the reports quality.
For more details about research methodology, kindly write to us at info@strategymrc.com
Frequently Asked Questions
In case of any queries regarding this report, you can contact the customer service by filing the “Inquiry Before Buy” form available on the right hand side. You may also contact us through email: info@strategymrc.com or phone: +1-301-202-5929
Yes, the samples are available for all the published reports. You can request them by filling the “Request Sample” option available in this page.
Yes, you can request a sample with your specific requirements. All the customized samples will be provided as per the requirement with the real data masked.
All our reports are available in Digital PDF format. In case if you require them in any other formats, such as PPT, Excel etc you can submit a request through “Inquiry Before Buy” form available on the right hand side. You may also contact us through email: info@strategymrc.com or phone: +1-301-202-5929
We offer a free 15% customization with every purchase. This requirement can be fulfilled for both pre and post sale. You may send your customization requirements through email at info@strategymrc.com or call us on +1-301-202-5929.
We have 3 different licensing options available in electronic format.
- Single User Licence: Allows one person, typically the buyer, to have access to the ordered product. The ordered product cannot be distributed to anyone else.
- 2-5 User Licence: Allows the ordered product to be shared among a maximum of 5 people within your organisation.
- Corporate License: Allows the product to be shared among all employees of your organisation regardless of their geographical location.
All our reports are typically be emailed to you as an attachment.
To order any available report you need to register on our website. The payment can be made either through CCAvenue or PayPal payments gateways which accept all international cards.
We extend our support to 6 months post sale. A post sale customization is also provided to cover your unmet needs in the report.
Request Customization
We offer complimentary customization of up to 15% with every purchase. To share your customization requirements, feel free to email us at info@strategymrc.com or call us on +1-301-202-5929. .
Please Note: Customization within the 15% threshold is entirely free of charge. If your request exceeds this limit, we will conduct a feasibility assessment. Following that, a detailed quote and timeline will be provided.
WHY CHOOSE US ?

Assured Quality
Best in class reports with high standard of research integrity

24X7 Research Support
Continuous support to ensure the best customer experience.

Free Customization
Adding more values to your product of interest.

Safe & Secure Access
Providing a secured environment for all online transactions.

Trusted by 600+ Brands
Serving the most reputed brands across the world.