
Solar Inverters Market
Solar Inverters Market Forecasts to 2028 - Global Analysis By Product Type (String Inverter, Micro Inverter, Central Inverter and Other Product Types), Connection (Off-Grid and On-Grid), Phase (Single Phase and Three Phase), Power Output (- 0.5 kW, 0.5 - 3 kW and Other Power Outputs), Power Voltage (- 230 V, 230 - 400 V and Other Power Voltages), End User and Geography

|
Years Covered |
2020-2028 |
|
Estimated Year Value (2022) |
US $8.97 BN |
|
Projected Year Value (2028) |
US $16.33 BN |
|
CAGR (2022 - 2028) |
10.5% |
|
Regions Covered |
North America, Europe, Asia Pacific, South America, and Middle East & Africa |
|
Countries Covered |
US, Canada, Mexico, Germany, UK, Italy, France, Spain, Japan, China, India, Australia, New Zealand, South Korea, Rest of Asia Pacific, South America, Argentina, Brazil, Chile, Middle East & Africa, Saudi Arabia, UAE, Qatar, and South Africa |
|
Largest Market |
Asia Pacific |
|
Highest Growing Market |
Europe |
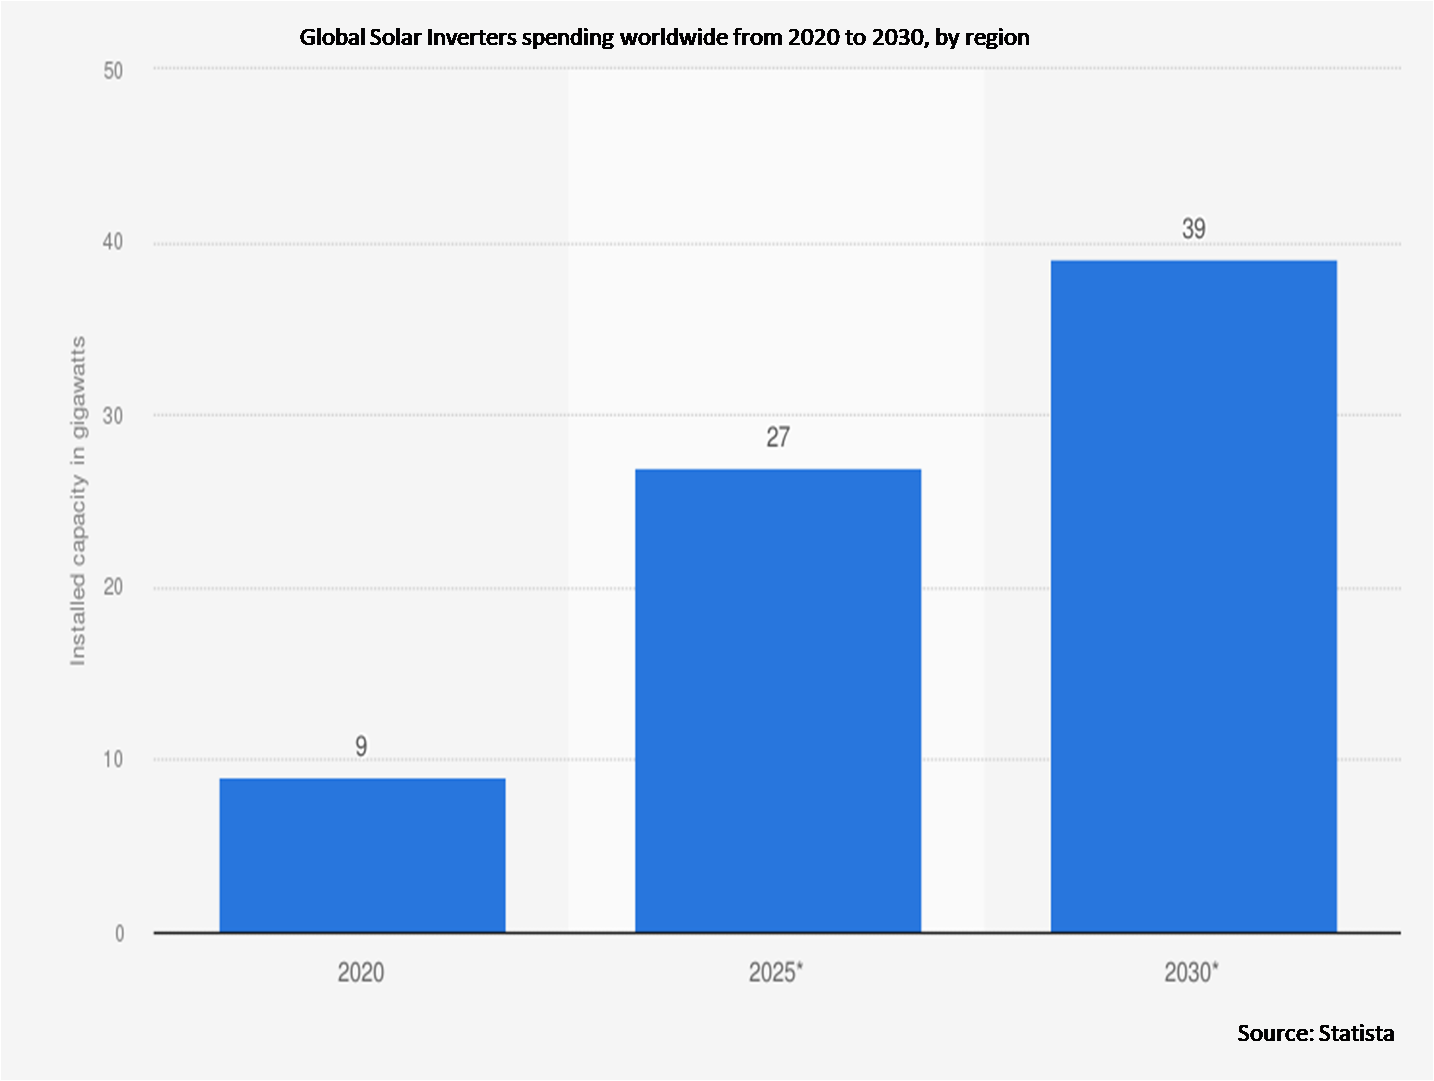
According to Stratistics MRC, the Global Solar Inverters Market is accounted for $8.97 billion in 2022 and is expected to reach $16.33 billion by 2028 growing at a CAGR of 10.5% during the forecast period. Solar inverters transform the DC electricity generated by solar panels into AC power. In addition to converting power, solar inverters track voltage, permit communication with the grid, and shut down in emergency situations. As a result, greater usage of on-grid solar inverters protects the security and effectiveness of household appliances. On-grid solar inverters create pure sine wave of AC energy as opposed to off-grid inverters. Electricity is provided by the solar inverter in places like commercial, industrial, and residential ones. And, solar inverters are being employed in more and more commercial and industrial applications worldwide nowadays.
According to the Paris Agreement commitments, the Government of India set an ambitious target of achieving 175 GW of renewable energy capacity by 2022. Out of the 175 GW, 100 GW was earmarked for solar capacity with 40 GW (40%), which was expected to be achieved through decentralized and rooftop-scale solar projects.
Market Dynamics:
Driver:
Growing consumer awareness
The relevance of the solar inverter is increasing internationally due to rising environmental concerns and rising consumer awareness of solar inverters. The solar inverter is regarded as a crucial component in the production of power. Solar energy is both free and plentiful in nature. Key market participants find the manufacture and manufacturing of solar inverters to be rather simple. Because there are just two costs, installation and operation costs, it is also advantageous for end users. This is highly sought for worldwide and is extremely financially possible.
Restraint:
High cost
High costs, high heat loss in large-scale solar inverters, and the lack of panel-level monitoring are the primary problems limiting industry growth in the upcoming years. Rising prices caused by demand and supply chain disruption, as well as access to next-generation auxiliary technologies, are some of the constraints restraining the solar inverter market's growth.
Opportunity:
Technological advancements
The global market for solar inverters is expected to expand and flourish as a result of technical innovation and improvements. The solar inverters are being equipped with the most recent and cutting-edge characteristics. This aids consumers in meeting the rising demand for power. The installation of a solar inverter is seen to be necessary and lucrative in hot climates. As a result, during the anticipated period, this will fuel the expansion and development of the worldwide solar inverter market.
Threat:
Availability of substitute technologies for power generation
An expansion in the use of natural gas for power generation has been brought on by the abundance of the fuel and comparatively low cost, particularly in North America, China, and Thailand. The global energy mix is predicted to include more gas-fired power generation as a result of growing attention on producing electricity from cleaner sources and the depletion of coal reserves, which will constrain the expansion of the solar inverter market.
Covid-19 Impact
Due to the worldwide COVID-19 pandemic breakout and government-imposed lock down measures, there has been a fall in demand for solar panels. This has had a detrimental effect on the worldwide solar inverter market. Residential and commercial end-user demand for the solar inverter has decreased as a result of limited new building activities and the utilisation of available finances by residential and commercial end-users to survive during the COVID-19 epidemic.
The central inverter segment is expected to be the largest during the forecast period
The central inverter segment is estimated to have a lucrative growth, due an increase in demand for central inverters from significant industrial and utility applications worldwide. It is also anticipated that fast industrialization and the development of renewable energy infrastructure in developing nations like China, India, Japan, and others would increase demand for central inverters. When properly maintained and installed, these inverters are very dependable and are kept in a secure position. The inverters take the DC electricity from all the PV panels and convert it into AC power, forming a single point for power distribution. The inverters are integrated with big arrays put on field sites, industrial facilities, and buildings.
The utilities segment is expected to have the highest CAGR during the forecast period
The utilities segment is anticipated to witness the fastest CAGR growth during the forecast period, due to the increased investment in utility-scale solar power plants, solar parks, and other solar structures. The central & string inverter is the solar inverter that is most frequently utilised in the utility industry. The utility industry is expanding for several reasons, chief among them the rising demand for renewable energy, the falling cost of solar energy and equipment, and the emergence of government subsidies. The category is growing as a result of the presence of major companies who provide customers market-leading utility-scale solutions through their pre-integrated power plants to increase efficiency and lower balance-of-system costs.
Region with highest share:
Asia Pacific is projected to hold the largest market share during the forecast period due to factors including escalating governmental activities and the existence of significant market participants in the area. The solar market in this region is expanding quickly, and China is both a key worldwide competitor and its greatest provider. The expansion of the industry in the area has also been greatly aided by the rising number of solar installations in emerging countries.
Region with highest CAGR:
Europe is projected to have the highest CAGR over the forecast period, owing to the existence of pro-renewable-energy government policies and the availability of incentives like residential feed-in tariffs (FITs) that motivate consumers to make such investments. Due to the high-tech nature of the inverters, Germany is a global leader in the production of solar inverters. As a result, German solar businesses have an edge over other players.

Key players in the market
Some of the key players profiled in the Solar Inverters Market include Power Electronics S.L, Fimer Group, SunPower, ABB Ltd, Hitachi Hi-Rel Power Electronics Pvt Ltd., Sineng Electric, Mitsubishi Electric Corporation, Siemens AG, Delta Electronics, Inc., Schneider Electric SE, SMA Solar Technology AG, Omron Corporation, Solaredge Technologies Inc., Powerone Micro Systems Pvt.Ltd, Enertechups
Key Developments:
In March 2020,the Fimer group acquired ABB’s solar inverter business making the company the 4th largest solar inverter manufacturer globally. This acquisition strategy will help the company to boost its presence globally.
In November 2019, Power Electronics received an international award from Camara Valencia. The award was presented due to its effort to make itself a strong leader in marketing solar inverters and making its strong foothold across America, Spain, and United Kingdom.
In July 2019, SUNGROW announced that the company became the largest supplier of Central and string inverters across the American region. This progress will help the company provide non-stop post-sale and service support to its clients across the region.
Product Types Covered:
• String Inverter
• Micro Inverter
• Central Inverter
• Other Product Types
Connections Covered:
• Off-Grid
• On-Grid
Phases Covered:
• Single Phase
• Three Phase
Power Outputs Covered:
• ? 0.5 kW
• 0.5 - 3 kW
• 3 - 33 kW
• 33 - 110 kW
• 110 kW
Output Voltages Covered:
• ? 230 V
• 230 - 400 V
• 400 - 600 V
• 600 V
End Users Covered:
•Commercial
•Industrial
•Utilities
•Residential
Regions Covered:
• North America
o US
o Canada
o Mexico
• Europe
o Germany
o UK
o Italy
o France
o Spain
o Rest of Europe
• Asia Pacific
o Japan
o China
o India
o Australia
o New Zealand
o South Korea
o Rest of Asia Pacific
• South America
o Argentina
o Brazil
o Chile
o Rest of South America
• Middle East & Africa
o Saudi Arabia
o UAE
o Qatar
o South Africa
o Rest of Middle East & Africa
What our report offers:
- Market share assessments for the regional and country-level segments
- Strategic recommendations for the new entrants
- Covers Market data for the years 2020, 2021, 2022, 2025, and 2028
- Market Trends (Drivers, Constraints, Opportunities, Threats, Challenges, Investment Opportunities, and recommendations)
- Strategic recommendations in key business segments based on the market estimations
- Competitive landscaping mapping the key common trends
- Company profiling with detailed strategies, financials, and recent developments
- Supply chain trends mapping the latest technological advancements
Free Customization Offerings:
All the customers of this report will be entitled to receive one of the following free customization options:
• Company Profiling
o Comprehensive profiling of additional market players (up to 3)
o SWOT Analysis of key players (up to 3)
• Regional Segmentation
o Market estimations, Forecasts and CAGR of any prominent country as per the client's interest (Note: Depends on feasibility check)
• Competitive Benchmarking
o Benchmarking of key players based on product portfolio, geographical presence, and strategic alliances
Table of Contents
1 Executive Summary
2 Preface
2.1 Abstract
2.2 Stake Holders
2.3 Research Scope
2.4 Research Methodology
2.4.1 Data Mining
2.4.2 Data Analysis
2.4.3 Data Validation
2.4.4 Research Approach
2.5 Research Sources
2.5.1 Primary Research Sources
2.5.2 Secondary Research Sources
2.5.3 Assumptions
3 Market Trend Analysis
3.1 Introduction
3.2 Drivers
3.3 Restraints
3.4 Opportunities
3.5 Threats
3.6 Product Analysis
3.7 End User Analysis
3.8 Emerging Markets
3.9 Impact of Covid-19
4 Porters Five Force Analysis
4.1 Bargaining power of suppliers
4.2 Bargaining power of buyers
4.3 Threat of substitutes
4.4 Threat of new entrants
4.5 Competitive rivalry
5 Global Solar Inverters Market, By Product Type
5.1 Introduction
5.2 String Inverter
5.3 Micro Inverter
5.4 Central Inverter
5.5 Other Product Types
6 Global Solar Inverters Market, By Connection
6.1 Introduction
6.2 Off-Grid
6.3 On-Grid
7 Global Solar Inverters Market, By Phase
7.1 Introduction
7.2 Single Phase
7.3 Three Phase
8 Global Solar Inverters Market, By Power Output
8.1 Introduction
8.2 0.5 kW
8.3 0.5 - 3 kW
8.4 3 - 33 kW
8.5 33 - 110 kW
8.6 110 kW
9 Global Solar Inverters Market, By Output Voltage
9.1 Introduction
9.2 230 V
9.3 230 - 400 V
9.4 400 - 600 V
9.5 600 V
10 Global Solar Inverters Market, By End User
10.1 Introduction
10.2 Commercial
10.3 Industrial
10.4 Utilities
10.5 Residential
11 Global Solar Inverters Market, By Geography
11.1 Introduction
11.2 North America
11.2.1 US
11.2.2 Canada
11.2.3 Mexico
11.3 Europe
11.3.1 Germany
11.3.2 UK
11.3.3 Italy
11.3.4 France
11.3.5 Spain
11.3.6 Rest of Europe
11.4 Asia Pacific
11.4.1 Japan
11.4.2 China
11.4.3 India
11.4.4 Australia
11.4.5 New Zealand
11.4.6 South Korea
11.4.7 Rest of Asia Pacific
11.5 South America
11.5.1 Argentina
11.5.2 Brazil
11.5.3 Chile
11.5.4 Rest of South America
11.6 Middle East & Africa
11.6.1 Saudi Arabia
11.6.2 UAE
11.6.3 Qatar
11.6.4 South Africa
11.6.5 Rest of Middle East & Africa
12 Key Developments
12.1 Agreements, Partnerships, Collaborations and Joint Ventures
12.2 Acquisitions & Mergers
12.3 New Product Launch
12.4 Expansions
12.5 Other Key Strategies
13 Company Profiling
13.1 Power Electronics S.L
13.2 Fimer Group
13.3 SunPower
13.4 ABB Ltd
13.5 Hitachi Hi-Rel Power Electronics Pvt Ltd.
13.6 Sineng Electric
13.7 Mitsubishi Electric Corporation
13.8 Siemens AG
13.9 Delta Electronics, Inc.
13.10 Schneider Electric SE
13.11 SMA Solar Technology AG
13.12 Omron Corporation
13.13 Solaredge Technologies Inc.
13.14 Powerone Micro Systems Pvt.Ltd
13.15 Enertechups
List of Tables
1 Global Solar Inverters Market Outlook, By Region (2020-2028) ($MN)
2 Global Solar Inverters Market Outlook, By Product Type (2020-2028) ($MN)
3 Global Solar Inverters Market Outlook, By String Inverter (2020-2028) ($MN)
4 Global Solar Inverters Market Outlook, By Micro Inverter (2020-2028) ($MN)
5 Global Solar Inverters Market Outlook, By Central Inverter (2020-2028) ($MN)
6 Global Solar Inverters Market Outlook, By Other Product Types (2020-2028) ($MN)
7 Global Solar Inverters Market Outlook, By Connection (2020-2028) ($MN)
8 Global Solar Inverters Market Outlook, By Off-Grid (2020-2028) ($MN)
9 Global Solar Inverters Market Outlook, By On-Grid (2020-2028) ($MN)
10 Global Solar Inverters Market Outlook, By Phase (2020-2028) ($MN)
11 Global Solar Inverters Market Outlook, By Single Phase (2020-2028) ($MN)
12 Global Solar Inverters Market Outlook, By Three Phase (2020-2028) ($MN)
13 Global Solar Inverters Market Outlook, By Power Output (2020-2028) ($MN)
14 Global Solar Inverters Market Outlook, By ? 0.5 kW (2020-2028) ($MN)
15 Global Solar Inverters Market Outlook, By 0.5 - 3 kW (2020-2028) ($MN)
16 Global Solar Inverters Market Outlook, By 3 - 33 kW (2020-2028) ($MN)
17 Global Solar Inverters Market Outlook, By 33 - 110 kW (2020-2028) ($MN)
18 Global Solar Inverters Market Outlook, By 110 kW (2020-2028) ($MN)
19 Global Solar Inverters Market Outlook, By Output Voltage (2020-2028) ($MN)
20 Global Solar Inverters Market Outlook, By ? 230 V (2020-2028) ($MN)
21 Global Solar Inverters Market Outlook, By 230 - 400 V (2020-2028) ($MN)
22 Global Solar Inverters Market Outlook, By 400 - 600 V (2020-2028) ($MN)
23 Global Solar Inverters Market Outlook, By 600 V (2020-2028) ($MN)
24 Global Solar Inverters Market Outlook, By End User (2020-2028) ($MN)
25 Global Solar Inverters Market Outlook, By Commercial (2020-2028) ($MN)
26 Global Solar Inverters Market Outlook, By Industrial (2020-2028) ($MN)
27 Global Solar Inverters Market Outlook, By Utilities (2020-2028) ($MN)
28 Global Solar Inverters Market Outlook, By Residential (2020-2028) ($MN)
29 North America Solar Inverters Market Outlook, By Country (2020-2028) ($MN)
30 North America Solar Inverters Market Outlook, By Product Type (2020-2028) ($MN)
31 North America Solar Inverters Market Outlook, By String Inverter (2020-2028) ($MN)
32 North America Solar Inverters Market Outlook, By Micro Inverter (2020-2028) ($MN)
33 North America Solar Inverters Market Outlook, By Central Inverter (2020-2028) ($MN)
34 North America Solar Inverters Market Outlook, By Other Product Types (2020-2028) ($MN)
35 North America Solar Inverters Market Outlook, By Connection (2020-2028) ($MN)
36 North America Solar Inverters Market Outlook, By Off-Grid (2020-2028) ($MN)
37 North America Solar Inverters Market Outlook, By On-Grid (2020-2028) ($MN)
38 North America Solar Inverters Market Outlook, By Phase (2020-2028) ($MN)
39 North America Solar Inverters Market Outlook, By Single Phase (2020-2028) ($MN)
40 North America Solar Inverters Market Outlook, By Three Phase (2020-2028) ($MN)
41 North America Solar Inverters Market Outlook, By Power Output (2020-2028) ($MN)
42 North America Solar Inverters Market Outlook, By ? 0.5 kW (2020-2028) ($MN)
43 North America Solar Inverters Market Outlook, By 0.5 - 3 kW (2020-2028) ($MN)
44 North America Solar Inverters Market Outlook, By 3 - 33 kW (2020-2028) ($MN)
45 North America Solar Inverters Market Outlook, By 33 - 110 kW (2020-2028) ($MN)
46 North America Solar Inverters Market Outlook, By 110 kW (2020-2028) ($MN)
47 North America Solar Inverters Market Outlook, By Output Voltage (2020-2028) ($MN)
48 North America Solar Inverters Market Outlook, By ? 230 V (2020-2028) ($MN)
49 North America Solar Inverters Market Outlook, By 230 - 400 V (2020-2028) ($MN)
50 North America Solar Inverters Market Outlook, By 400 - 600 V (2020-2028) ($MN)
51 North America Solar Inverters Market Outlook, By 600 V (2020-2028) ($MN)
52 North America Solar Inverters Market Outlook, By End User (2020-2028) ($MN)
53 North America Solar Inverters Market Outlook, By Commercial (2020-2028) ($MN)
54 North America Solar Inverters Market Outlook, By Industrial (2020-2028) ($MN)
55 North America Solar Inverters Market Outlook, By Utilities (2020-2028) ($MN)
56 North America Solar Inverters Market Outlook, By Residential (2020-2028) ($MN)
57 Europe Solar Inverters Market Outlook, By Country (2020-2028) ($MN)
58 Europe Solar Inverters Market Outlook, By Product Type (2020-2028) ($MN)
59 Europe Solar Inverters Market Outlook, By String Inverter (2020-2028) ($MN)
60 Europe Solar Inverters Market Outlook, By Micro Inverter (2020-2028) ($MN)
61 Europe Solar Inverters Market Outlook, By Central Inverter (2020-2028) ($MN)
62 Europe Solar Inverters Market Outlook, By Other Product Types (2020-2028) ($MN)
63 Europe Solar Inverters Market Outlook, By Connection (2020-2028) ($MN)
64 Europe Solar Inverters Market Outlook, By Off-Grid (2020-2028) ($MN)
65 Europe Solar Inverters Market Outlook, By On-Grid (2020-2028) ($MN)
66 Europe Solar Inverters Market Outlook, By Phase (2020-2028) ($MN)
67 Europe Solar Inverters Market Outlook, By Single Phase (2020-2028) ($MN)
68 Europe Solar Inverters Market Outlook, By Three Phase (2020-2028) ($MN)
69 Europe Solar Inverters Market Outlook, By Power Output (2020-2028) ($MN)
70 Europe Solar Inverters Market Outlook, By ? 0.5 kW (2020-2028) ($MN)
71 Europe Solar Inverters Market Outlook, By 0.5 - 3 kW (2020-2028) ($MN)
72 Europe Solar Inverters Market Outlook, By 3 - 33 kW (2020-2028) ($MN)
73 Europe Solar Inverters Market Outlook, By 33 - 110 kW (2020-2028) ($MN)
74 Europe Solar Inverters Market Outlook, By 110 kW (2020-2028) ($MN)
75 Europe Solar Inverters Market Outlook, By Output Voltage (2020-2028) ($MN)
76 Europe Solar Inverters Market Outlook, By ? 230 V (2020-2028) ($MN)
77 Europe Solar Inverters Market Outlook, By 230 - 400 V (2020-2028) ($MN)
78 Europe Solar Inverters Market Outlook, By 400 - 600 V (2020-2028) ($MN)
79 Europe Solar Inverters Market Outlook, By 600 V (2020-2028) ($MN)
80 Europe Solar Inverters Market Outlook, By End User (2020-2028) ($MN)
81 Europe Solar Inverters Market Outlook, By Commercial (2020-2028) ($MN)
82 Europe Solar Inverters Market Outlook, By Industrial (2020-2028) ($MN)
83 Europe Solar Inverters Market Outlook, By Utilities (2020-2028) ($MN)
84 Europe Solar Inverters Market Outlook, By Residential (2020-2028) ($MN)
85 Asia Pacific Solar Inverters Market Outlook, By Country (2020-2028) ($MN)
86 Asia Pacific Solar Inverters Market Outlook, By Product Type (2020-2028) ($MN)
87 Asia Pacific Solar Inverters Market Outlook, By String Inverter (2020-2028) ($MN)
88 Asia Pacific Solar Inverters Market Outlook, By Micro Inverter (2020-2028) ($MN)
89 Asia Pacific Solar Inverters Market Outlook, By Central Inverter (2020-2028) ($MN)
90 Asia Pacific Solar Inverters Market Outlook, By Other Product Types (2020-2028) ($MN)
91 Asia Pacific Solar Inverters Market Outlook, By Connection (2020-2028) ($MN)
92 Asia Pacific Solar Inverters Market Outlook, By Off-Grid (2020-2028) ($MN)
93 Asia Pacific Solar Inverters Market Outlook, By On-Grid (2020-2028) ($MN)
94 Asia Pacific Solar Inverters Market Outlook, By Phase (2020-2028) ($MN)
95 Asia Pacific Solar Inverters Market Outlook, By Single Phase (2020-2028) ($MN)
96 Asia Pacific Solar Inverters Market Outlook, By Three Phase (2020-2028) ($MN)
97 Asia Pacific Solar Inverters Market Outlook, By Power Output (2020-2028) ($MN)
98 Asia Pacific Solar Inverters Market Outlook, By ? 0.5 kW (2020-2028) ($MN)
99 Asia Pacific Solar Inverters Market Outlook, By 0.5 - 3 kW (2020-2028) ($MN)
100 Asia Pacific Solar Inverters Market Outlook, By 3 - 33 kW (2020-2028) ($MN)
101 Asia Pacific Solar Inverters Market Outlook, By 33 - 110 kW (2020-2028) ($MN)
102 Asia Pacific Solar Inverters Market Outlook, By 110 kW (2020-2028) ($MN)
103 Asia Pacific Solar Inverters Market Outlook, By Output Voltage (2020-2028) ($MN)
104 Asia Pacific Solar Inverters Market Outlook, By ? 230 V (2020-2028) ($MN)
105 Asia Pacific Solar Inverters Market Outlook, By 230 - 400 V (2020-2028) ($MN)
106 Asia Pacific Solar Inverters Market Outlook, By 400 - 600 V (2020-2028) ($MN)
107 Asia Pacific Solar Inverters Market Outlook, By 600 V (2020-2028) ($MN)
108 Asia Pacific Solar Inverters Market Outlook, By End User (2020-2028) ($MN)
109 Asia Pacific Solar Inverters Market Outlook, By Commercial (2020-2028) ($MN)
110 Asia Pacific Solar Inverters Market Outlook, By Industrial (2020-2028) ($MN)
111 Asia Pacific Solar Inverters Market Outlook, By Utilities (2020-2028) ($MN)
112 Asia Pacific Solar Inverters Market Outlook, By Residential (2020-2028) ($MN)
113 South America Solar Inverters Market Outlook, By Country (2020-2028) ($MN)
114 South America Solar Inverters Market Outlook, By Product Type (2020-2028) ($MN)
115 South America Solar Inverters Market Outlook, By String Inverter (2020-2028) ($MN)
116 South America Solar Inverters Market Outlook, By Micro Inverter (2020-2028) ($MN)
117 South America Solar Inverters Market Outlook, By Central Inverter (2020-2028) ($MN)
118 South America Solar Inverters Market Outlook, By Other Product Types (2020-2028) ($MN)
119 South America Solar Inverters Market Outlook, By Connection (2020-2028) ($MN)
120 South America Solar Inverters Market Outlook, By Off-Grid (2020-2028) ($MN)
121 South America Solar Inverters Market Outlook, By On-Grid (2020-2028) ($MN)
122 South America Solar Inverters Market Outlook, By Phase (2020-2028) ($MN)
123 South America Solar Inverters Market Outlook, By Single Phase (2020-2028) ($MN)
124 South America Solar Inverters Market Outlook, By Three Phase (2020-2028) ($MN)
125 South America Solar Inverters Market Outlook, By Power Output (2020-2028) ($MN)
126 South America Solar Inverters Market Outlook, By ? 0.5 kW (2020-2028) ($MN)
127 South America Solar Inverters Market Outlook, By 0.5 - 3 kW (2020-2028) ($MN)
128 South America Solar Inverters Market Outlook, By 3 - 33 kW (2020-2028) ($MN)
129 South America Solar Inverters Market Outlook, By 33 - 110 kW (2020-2028) ($MN)
130 South America Solar Inverters Market Outlook, By 110 kW (2020-2028) ($MN)
131 South America Solar Inverters Market Outlook, By Output Voltage (2020-2028) ($MN)
132 South America Solar Inverters Market Outlook, By ? 230 V (2020-2028) ($MN)
133 South America Solar Inverters Market Outlook, By 230 - 400 V (2020-2028) ($MN)
134 South America Solar Inverters Market Outlook, By 400 - 600 V (2020-2028) ($MN)
135 South America Solar Inverters Market Outlook, By 600 V (2020-2028) ($MN)
136 South America Solar Inverters Market Outlook, By End User (2020-2028) ($MN)
137 South America Solar Inverters Market Outlook, By Commercial (2020-2028) ($MN)
138 South America Solar Inverters Market Outlook, By Industrial (2020-2028) ($MN)
139 South America Solar Inverters Market Outlook, By Utilities (2020-2028) ($MN)
140 South America Solar Inverters Market Outlook, By Residential (2020-2028) ($MN)
141 Middle East & Africa Solar Inverters Market Outlook, By Country (2020-2028) ($MN)
142 Middle East & Africa Solar Inverters Market Outlook, By Product Type (2020-2028) ($MN)
143 Middle East & Africa Solar Inverters Market Outlook, By String Inverter (2020-2028) ($MN)
144 Middle East & Africa Solar Inverters Market Outlook, By Micro Inverter (2020-2028) ($MN)
145 Middle East & Africa Solar Inverters Market Outlook, By Central Inverter (2020-2028) ($MN)
146 Middle East & Africa Solar Inverters Market Outlook, By Other Product Types (2020-2028) ($MN)
147 Middle East & Africa Solar Inverters Market Outlook, By Connection (2020-2028) ($MN)
148 Middle East & Africa Solar Inverters Market Outlook, By Off-Grid (2020-2028) ($MN)
149 Middle East & Africa Solar Inverters Market Outlook, By On-Grid (2020-2028) ($MN)
150 Middle East & Africa Solar Inverters Market Outlook, By Phase (2020-2028) ($MN)
151 Middle East & Africa Solar Inverters Market Outlook, By Single Phase (2020-2028) ($MN)
152 Middle East & Africa Solar Inverters Market Outlook, By Three Phase (2020-2028) ($MN)
153 Middle East & Africa Solar Inverters Market Outlook, By Power Output (2020-2028) ($MN)
154 Middle East & Africa Solar Inverters Market Outlook, By ? 0.5 kW (2020-2028) ($MN)
155 Middle East & Africa Solar Inverters Market Outlook, By 0.5 - 3 kW (2020-2028) ($MN)
156 Middle East & Africa Solar Inverters Market Outlook, By 3 - 33 kW (2020-2028) ($MN)
157 Middle East & Africa Solar Inverters Market Outlook, By 33 - 110 kW (2020-2028) ($MN)
158 Middle East & Africa Solar Inverters Market Outlook, By 110 kW (2020-2028) ($MN)
159 Middle East & Africa Solar Inverters Market Outlook, By Output Voltage (2020-2028) ($MN)
160 Middle East & Africa Solar Inverters Market Outlook, By ? 230 V (2020-2028) ($MN)
161 Middle East & Africa Solar Inverters Market Outlook, By 230 - 400 V (2020-2028) ($MN)
162 Middle East & Africa Solar Inverters Market Outlook, By 400 - 600 V (2020-2028) ($MN)
163 Middle East & Africa Solar Inverters Market Outlook, By 600 V (2020-2028) ($MN)
164 Middle East & Africa Solar Inverters Market Outlook, By End User (2020-2028) ($MN)
165 Middle East & Africa Solar Inverters Market Outlook, By Commercial (2020-2028) ($MN)
166 Middle East & Africa Solar Inverters Market Outlook, By Industrial (2020-2028) ($MN)
167 Middle East & Africa Solar Inverters Market Outlook, By Utilities (2020-2028) ($MN)
168 Middle East & Africa Solar Inverters Market Outlook, By Residential (2020-2028) ($MN)
List of Figures
RESEARCH METHODOLOGY

We at ‘Stratistics’ opt for an extensive research approach which involves data mining, data validation, and data analysis. The various research sources include in-house repository, secondary research, competitor’s sources, social media research, client internal data, and primary research.
Our team of analysts prefers the most reliable and authenticated data sources in order to perform the comprehensive literature search. With access to most of the authenticated data bases our team highly considers the best mix of information through various sources to obtain extensive and accurate analysis.
Each report takes an average time of a month and a team of 4 industry analysts. The time may vary depending on the scope and data availability of the desired market report. The various parameters used in the market assessment are standardized in order to enhance the data accuracy.
Data Mining
The data is collected from several authenticated, reliable, paid and unpaid sources and is filtered depending on the scope & objective of the research. Our reports repository acts as an added advantage in this procedure. Data gathering from the raw material suppliers, distributors and the manufacturers is performed on a regular basis, this helps in the comprehensive understanding of the products value chain. Apart from the above mentioned sources the data is also collected from the industry consultants to ensure the objective of the study is in the right direction.
Market trends such as technological advancements, regulatory affairs, market dynamics (Drivers, Restraints, Opportunities and Challenges) are obtained from scientific journals, market related national & international associations and organizations.
Data Analysis
From the data that is collected depending on the scope & objective of the research the data is subjected for the analysis. The critical steps that we follow for the data analysis include:
- Product Lifecycle Analysis
- Competitor analysis
- Risk analysis
- Porters Analysis
- PESTEL Analysis
- SWOT Analysis
The data engineering is performed by the core industry experts considering both the Marketing Mix Modeling and the Demand Forecasting. The marketing mix modeling makes use of multiple-regression techniques to predict the optimal mix of marketing variables. Regression factor is based on a number of variables and how they relate to an outcome such as sales or profits.
Data Validation
The data validation is performed by the exhaustive primary research from the expert interviews. This includes telephonic interviews, focus groups, face to face interviews, and questionnaires to validate our research from all aspects. The industry experts we approach come from the leading firms, involved in the supply chain ranging from the suppliers, distributors to the manufacturers and consumers so as to ensure an unbiased analysis.
We are in touch with more than 15,000 industry experts with the right mix of consultants, CEO's, presidents, vice presidents, managers, experts from both supply side and demand side, executives and so on.
The data validation involves the primary research from the industry experts belonging to:
- Leading Companies
- Suppliers & Distributors
- Manufacturers
- Consumers
- Industry/Strategic Consultants
Apart from the data validation the primary research also helps in performing the fill gap research, i.e. providing solutions for the unmet needs of the research which helps in enhancing the reports quality.
For more details about research methodology, kindly write to us at info@strategymrc.com
Frequently Asked Questions
In case of any queries regarding this report, you can contact the customer service by filing the “Inquiry Before Buy” form available on the right hand side. You may also contact us through email: info@strategymrc.com or phone: +1-301-202-5929
Yes, the samples are available for all the published reports. You can request them by filling the “Request Sample” option available in this page.
Yes, you can request a sample with your specific requirements. All the customized samples will be provided as per the requirement with the real data masked.
All our reports are available in Digital PDF format. In case if you require them in any other formats, such as PPT, Excel etc you can submit a request through “Inquiry Before Buy” form available on the right hand side. You may also contact us through email: info@strategymrc.com or phone: +1-301-202-5929
We offer a free 15% customization with every purchase. This requirement can be fulfilled for both pre and post sale. You may send your customization requirements through email at info@strategymrc.com or call us on +1-301-202-5929.
We have 3 different licensing options available in electronic format.
- Single User Licence: Allows one person, typically the buyer, to have access to the ordered product. The ordered product cannot be distributed to anyone else.
- 2-5 User Licence: Allows the ordered product to be shared among a maximum of 5 people within your organisation.
- Corporate License: Allows the product to be shared among all employees of your organisation regardless of their geographical location.
All our reports are typically be emailed to you as an attachment.
To order any available report you need to register on our website. The payment can be made either through CCAvenue or PayPal payments gateways which accept all international cards.
We extend our support to 6 months post sale. A post sale customization is also provided to cover your unmet needs in the report.
Request Customization
We offer complimentary customization of up to 15% with every purchase. To share your customization requirements, feel free to email us at info@strategymrc.com or call us on +1-301-202-5929. .
Please Note: Customization within the 15% threshold is entirely free of charge. If your request exceeds this limit, we will conduct a feasibility assessment. Following that, a detailed quote and timeline will be provided.
WHY CHOOSE US ?

Assured Quality
Best in class reports with high standard of research integrity

24X7 Research Support
Continuous support to ensure the best customer experience.

Free Customization
Adding more values to your product of interest.

Safe & Secure Access
Providing a secured environment for all online transactions.

Trusted by 600+ Brands
Serving the most reputed brands across the world.