
Space Sensors Market
Space Sensors Market Forecasts to 2030 - Global Analysis By Type (Temperature Sensors, Pressure Sensors, Magnetic Sensors, Radiation Sensors, Flow Sensors, Gravity Sensors, Proximity Sensors, Vibration Sensors and Other Types), Platform, Application, End User and By Geography

|
Years Covered |
2022-2030 |
|
Estimated Year Value (2024) |
US $7.4 BN |
|
Projected Year Value (2030) |
US $12.5 BN |
|
CAGR (2024 - 2030) |
9.2% |
|
Regions Covered |
North America, Europe, Asia Pacific, South America, and Middle East & Africa |
|
Countries Covered |
US, Canada, Mexico, Germany, UK, Italy, France, Spain, Japan, China, India, Australia, New Zealand, South Korea, Rest of Asia Pacific, South America, Argentina, Brazil, Chile, Middle East & Africa, Saudi Arabia, UAE, Qatar, and South Africa |
|
Largest Market |
North America |
|
Highest Growing Market |
Asia Pacific |
According to Stratistics MRC, the Global Space Sensors Market is accounted for $7.4 billion in 2024 and is expected to reach $12.5 billion by 2030 growing at a CAGR of 9.2% during the forecast period. Space sensors are specialized devices designed to detect, measure, and monitor various physical and environmental parameters in space. These sensors can track radiation, temperature, pressure, gravitational forces, and electromagnetic fields, providing valuable data for scientific research, satellite navigation, and communication systems. Often integrated into spacecraft, space telescopes, or satellites, they help in studying celestial bodies, Earth’s atmosphere, and outer space conditions. Space sensors play a crucial role in advancing space exploration, environmental monitoring, and space-based technologies.
According to the U.S. Government Accountability Office (U.S. GAO), a U.S.-based independent, nonpartisan government agency that provides various services for the U.S. Congress, the number of active satellites steadily grew in the past few years and then skyrocketed from 1,400 in 2015 to 5,500 by the spring of 2022.

Market Dynamics:
Driver:
Increased investment in space exploration
Increased investment in space exploration has significantly boosted the demand for advanced space sensors. As missions become more complex, there's a growing need for high-performance sensors to monitor spacecraft health, collect data, and enable precise navigation. Innovations in sensor technology are essential for supporting deep space exploration, satellite communication, and planetary science, driving the development of more sophisticated, reliable, and cost-effective solutions to meet the challenges of modern space missions.
Restraint:
Launch failures and budget constraints
Launch failures and budget constraints in space exploration can negatively impact the market by delaying or limiting the development and deployment of critical sensor technologies. Failed missions can lead to costly setbacks, reducing funding available for research and innovation. Budget constraints may also force manufacturers to prioritize cost-cutting measures over performance, potentially compromising sensor quality and reliability, which in turn hinders advancements in space exploration and satellite applications.
Opportunity:
Growing demand for satellite applications
The growing demand for satellite applications in space exploration is driving significant advancements in the market. Satellites require highly specialized sensors for tasks such as Earth observation, communication, and navigation. As global space missions expand, including deep space exploration and satellite constellations, the need for accurate, reliable, and durable sensors increases. This demand is fueling innovations in sensor technologies that can withstand harsh space environments and deliver precise data for mission success.
Threat:
Reliability concerns
Reliability concerns in space exploration pose a significant challenge for the space sensors market. Sensors must withstand harsh space environments, including extreme temperatures, radiation, and micrometeoroid impacts. If sensors fail to deliver consistent, accurate data, it can jeopardize mission success and lead to costly rework or mission delays. These reliability issues can hinder innovation, reduce investor confidence, and slow the adoption of advanced sensor technologies necessary for complex space exploration endeavors.
Covid-19 Impact:
The COVID-19 pandemic had a disruptive impact on the market, causing delays in research, manufacturing, and supply chain disruptions. Lockdowns and travel restrictions slowed the development of new sensor technologies and delayed satellite launches. Furthermore, reduced budgets and shifting priorities among space agencies and companies led to postponements of space exploration missions. Despite these challenges, the market has gradually rebounded, with renewed interest in space exploration driving demand for advanced sensors.
The magnetic sensors segment is projected to be the largest during the forecast period
The magnetic sensors segment is projected to account for the largest market share during the projection period. These sensors detect magnetic fields, enabling spacecraft to determine their orientation and position in space. Magnetic sensors are also used to monitor geomagnetic activity and detect anomalies in space environments. Their high accuracy, durability, and ability to function in extreme conditions make them essential for the success of space missions and satellite operations.
The navigation and positioning segment is expected to have the highest CAGR during the forecast period
The navigation and positioning segment is expected to have the highest CAGR during the extrapolated period. Advanced sensors, including star trackers, gyroscopes, and magnetometers, work together to ensure accurate navigation even in deep space, where GPS signals are unavailable. These sensors are essential for satellite deployment, interplanetary exploration, and spacecraft maneuvering, ensuring mission success by providing real-time positioning data and maintaining operational accuracy in challenging environments.
Region with largest share:
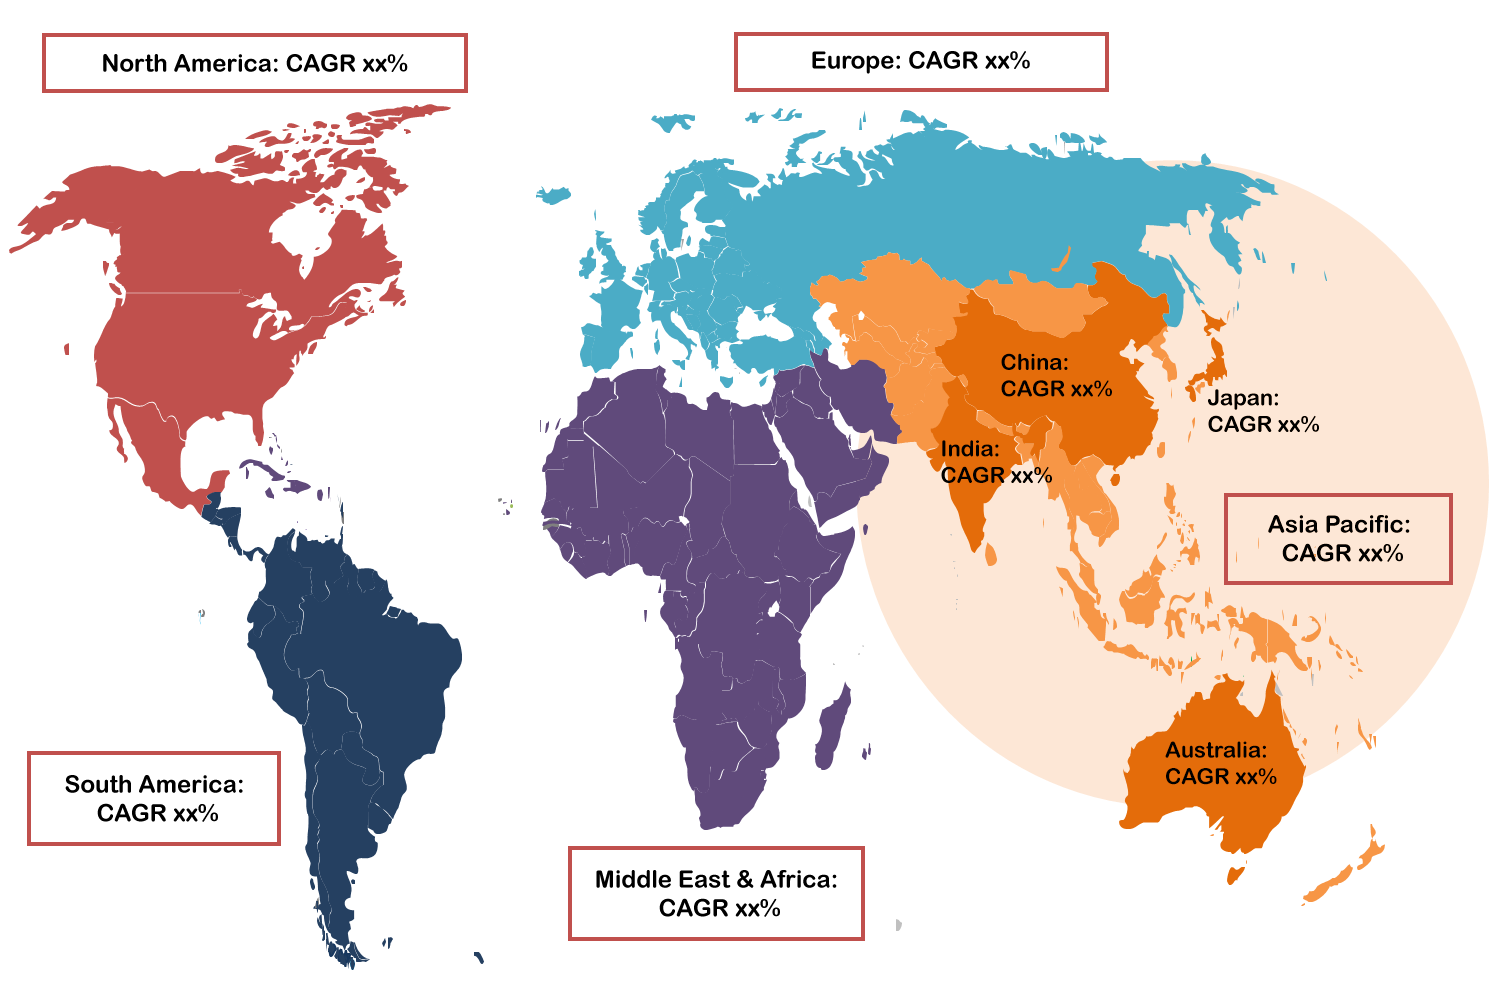
North America region is projected to account for the largest market share during the forecast period driven by significant investments from government. The region leads in the development and deployment of advanced space sensors for satellite communications, Earth observation, and deep space exploration. The region benefits from strong technological infrastructure, innovation in sensor technologies, and a growing demand for space-based applications, further accelerating market expansion.
Region with highest CAGR:
Asia Pacific is expected to register the highest growth rate over the forecast period. Innovations such as the development of multi-sensor satellites and improved sensor technologies are enhancing the analytical capabilities of space missions. The rise of private companies in the space sector is contributing to market growth. These companies are increasingly involved in satellite operations, space exploration, and related technologies, which boosts demand for advanced sensors.
Key players in the market
Some of the key players in Space Sensors market include Honeywell International Inc., Thermo Fisher Scientific Inc., STMicroelectronics, Lockheed Martin Corporation, Northrop Grumman Corporation, SENSITRON Semiconductor, Robert Bosch GmbH, Oculus Innovative Sciences, TT Electronics, L3Harris Technologies, Aerospace Corp., Boeing, NASA (National Aeronautics and Space Administration), Rutherford Appleton Laboratory, Bae Systems, SpaceX, Raytheon Technologies and Magneto-Inductive Sensor Technologies (MIST).
Key Developments:
In January 2024, Lockheed Martin has won a contract to build 18 space vehicles as part of the Tranche 2 Tracking Layer constellation by the Space Development Agency, Inc. (SDA).
In August 2023, Raytheon announced that its Geostationary Littoral Imaging and Monitoring Radiometer (GLIMR) sensor successfully completed its Critical Design Review. The instrument will provide detailed measurements of coastal and ocean ecosystems in the Gulf of Mexico, parts of the southeastern U.S. coast, and the Amazon River plume.
Types Covered:
• Temperature Sensors
• Pressure Sensors
• Magnetic Sensors
• Radiation Sensors
• Flow Sensors
• Gravity Sensors
• Proximity Sensors
• Vibration Sensors
• Other Types
Platforms Covered:
• Satellites
• Cargo Modules
• Interplanetary Spacecraft & Probes
• Rovers
• Spacecraft Landers
• Launch Vehicles
Applications Covered:
• Satellite Monitoring
• Space Exploration
• Military and Defense
• Earth Observation
• Navigation and Positioning
• Scientific Research
• Other Applications
End Users Covered:
• Government
• Research Institutions
• Defense
• Commercial Companies
• Academic Institutions
• Other End Users
Regions Covered:
• North America
o US
o Canada
o Mexico
• Europe
o Germany
o UK
o Italy
o France
o Spain
o Rest of Europe
• Asia Pacific
o Japan
o China
o India
o Australia
o New Zealand
o South Korea
o Rest of Asia Pacific
• South America
o Argentina
o Brazil
o Chile
o Rest of South America
• Middle East & Africa
o Saudi Arabia
o UAE
o Qatar
o South Africa
o Rest of Middle East & Africa
What our report offers:
- Market share assessments for the regional and country-level segments
- Strategic recommendations for the new entrants
- Covers Market data for the years 2022, 2023, 2024, 2026, and 2030
- Market Trends (Drivers, Constraints, Opportunities, Threats, Challenges, Investment Opportunities, and recommendations)
- Strategic recommendations in key business segments based on the market estimations
- Competitive landscaping mapping the key common trends
- Company profiling with detailed strategies, financials, and recent developments
- Supply chain trends mapping the latest technological advancements
Free Customization Offerings:
All the customers of this report will be entitled to receive one of the following free customization options:
• Company Profiling
o Comprehensive profiling of additional market players (up to 3)
o SWOT Analysis of key players (up to 3)
• Regional Segmentation
o Market estimations, Forecasts and CAGR of any prominent country as per the client's interest (Note: Depends on feasibility check)
• Competitive Benchmarking
o Benchmarking of key players based on product portfolio, geographical presence, and strategic alliances
Table of Contents
1 Executive Summary
2 Preface
2.1 Abstract
2.2 Stake Holders
2.3 Research Scope
2.4 Research Methodology
2.4.1 Data Mining
2.4.2 Data Analysis
2.4.3 Data Validation
2.4.4 Research Approach
2.5 Research Sources
2.5.1 Primary Research Sources
2.5.2 Secondary Research Sources
2.5.3 Assumptions
3 Market Trend Analysis
3.1 Introduction
3.2 Drivers
3.3 Restraints
3.4 Opportunities
3.5 Threats
3.6 Application Analysis
3.7 End User Analysis
3.8 Emerging Markets
3.9 Impact of Covid-19
4 Porters Five Force Analysis
4.1 Bargaining power of suppliers
4.2 Bargaining power of buyers
4.3 Threat of substitutes
4.4 Threat of new entrants
4.5 Competitive rivalry
5 Global Space Sensors Market, By Type
5.1 Introduction
5.2 Temperature Sensors
5.3 Pressure Sensors
5.4 Magnetic Sensors
5.5 Radiation Sensors
5.6 Flow Sensors
5.7 Gravity Sensors
5.8 Proximity Sensors
5.9 Vibration Sensors
5.10 Other Types
6 Global Space Sensors Market, By Platform
6.1 Introduction
6.2 Satellites
6.3 Cargo Modules
6.4 Interplanetary Spacecraft & Probes
6.5 Rovers
6.6 Spacecraft Landers
6.7 Launch Vehicles
7 Global Space Sensors Market, By Application
7.1 Introduction
7.2 Satellite Monitoring
7.3 Space Exploration
7.4 Military and Defense
7.5 Earth Observation
7.6 Navigation and Positioning
7.7 Scientific Research
7.8 Other Applications
8 Global Space Sensors Market, By End User
8.1 Introduction
8.2 Government
8.3 Research Institutions
8.4 Defense
8.5 Commercial Companies
8.6 Academic Institutions
8.7 Other End Users
9 Global Space Sensors Market, By Geography
9.1 Introduction
9.2 North America
9.2.1 US
9.2.2 Canada
9.2.3 Mexico
9.3 Europe
9.3.1 Germany
9.3.2 UK
9.3.3 Italy
9.3.4 France
9.3.5 Spain
9.3.6 Rest of Europe
9.4 Asia Pacific
9.4.1 Japan
9.4.2 China
9.4.3 India
9.4.4 Australia
9.4.5 New Zealand
9.4.6 South Korea
9.4.7 Rest of Asia Pacific
9.5 South America
9.5.1 Argentina
9.5.2 Brazil
9.5.3 Chile
9.5.4 Rest of South America
9.6 Middle East & Africa
9.6.1 Saudi Arabia
9.6.2 UAE
9.6.3 Qatar
9.6.4 South Africa
9.6.5 Rest of Middle East & Africa
10 Key Developments
10.1 Agreements, Partnerships, Collaborations and Joint Ventures
10.2 Acquisitions & Mergers
10.3 New Product Launch
10.4 Expansions
10.5 Other Key Strategies
11 Company Profiling
11.1 Honeywell International Inc.
11.2 Thermo Fisher Scientific Inc.
11.3 STMicroelectronics
11.4 Lockheed Martin Corporation
11.5 Northrop Grumman Corporation
11.6 SENSITRON Semiconductor
11.7 Robert Bosch GmbH
11.8 Oculus Innovative Sciences
11.9 TT Electronics
11.10 L3Harris Technologies
11.11 Aerospace Corp.
11.12 Boeing
11.13 NASA (National Aeronautics and Space Administration)
11.14 Rutherford Appleton Laboratory
11.15 Bae Systems
11.16 SpaceX
11.17 Raytheon Technologies
11.18 Magneto-Inductive Sensor Technologies (MIST)
List of Tables
1 Global Space Sensors Market Outlook, By Region (2022-2030) ($MN)
2 Global Space Sensors Market Outlook, By Type (2022-2030) ($MN)
3 Global Space Sensors Market Outlook, By Temperature Sensors (2022-2030) ($MN)
4 Global Space Sensors Market Outlook, By Pressure Sensors (2022-2030) ($MN)
5 Global Space Sensors Market Outlook, By Magnetic Sensors (2022-2030) ($MN)
6 Global Space Sensors Market Outlook, By Radiation Sensors (2022-2030) ($MN)
7 Global Space Sensors Market Outlook, By Flow Sensors (2022-2030) ($MN)
8 Global Space Sensors Market Outlook, By Gravity Sensors (2022-2030) ($MN)
9 Global Space Sensors Market Outlook, By Proximity Sensors (2022-2030) ($MN)
10 Global Space Sensors Market Outlook, By Vibration Sensors (2022-2030) ($MN)
11 Global Space Sensors Market Outlook, By Other Types (2022-2030) ($MN)
12 Global Space Sensors Market Outlook, By Platform (2022-2030) ($MN)
13 Global Space Sensors Market Outlook, By Satellites (2022-2030) ($MN)
14 Global Space Sensors Market Outlook, By Cargo Modules (2022-2030) ($MN)
15 Global Space Sensors Market Outlook, By Interplanetary Spacecraft & Probes (2022-2030) ($MN)
16 Global Space Sensors Market Outlook, By Rovers (2022-2030) ($MN)
17 Global Space Sensors Market Outlook, By Spacecraft Landers (2022-2030) ($MN)
18 Global Space Sensors Market Outlook, By Launch Vehicles (2022-2030) ($MN)
19 Global Space Sensors Market Outlook, By Application (2022-2030) ($MN)
20 Global Space Sensors Market Outlook, By Satellite Monitoring (2022-2030) ($MN)
21 Global Space Sensors Market Outlook, By Space Exploration (2022-2030) ($MN)
22 Global Space Sensors Market Outlook, By Military and Defense (2022-2030) ($MN)
23 Global Space Sensors Market Outlook, By Earth Observation (2022-2030) ($MN)
24 Global Space Sensors Market Outlook, By Navigation and Positioning (2022-2030) ($MN)
25 Global Space Sensors Market Outlook, By Scientific Research (2022-2030) ($MN)
26 Global Space Sensors Market Outlook, By Other Applications (2022-2030) ($MN)
27 Global Space Sensors Market Outlook, By End User (2022-2030) ($MN)
28 Global Space Sensors Market Outlook, By Government (2022-2030) ($MN)
29 Global Space Sensors Market Outlook, By Research Institutions (2022-2030) ($MN)
30 Global Space Sensors Market Outlook, By Defense (2022-2030) ($MN)
31 Global Space Sensors Market Outlook, By Commercial Companies (2022-2030) ($MN)
32 Global Space Sensors Market Outlook, By Academic Institutions (2022-2030) ($MN)
33 Global Space Sensors Market Outlook, By Other End Users (2022-2030) ($MN)
Note: Tables for North America, Europe, APAC, South America, and Middle East & Africa Regions are also represented in the same manner as above.
List of Figures
RESEARCH METHODOLOGY

We at ‘Stratistics’ opt for an extensive research approach which involves data mining, data validation, and data analysis. The various research sources include in-house repository, secondary research, competitor’s sources, social media research, client internal data, and primary research.
Our team of analysts prefers the most reliable and authenticated data sources in order to perform the comprehensive literature search. With access to most of the authenticated data bases our team highly considers the best mix of information through various sources to obtain extensive and accurate analysis.
Each report takes an average time of a month and a team of 4 industry analysts. The time may vary depending on the scope and data availability of the desired market report. The various parameters used in the market assessment are standardized in order to enhance the data accuracy.
Data Mining
The data is collected from several authenticated, reliable, paid and unpaid sources and is filtered depending on the scope & objective of the research. Our reports repository acts as an added advantage in this procedure. Data gathering from the raw material suppliers, distributors and the manufacturers is performed on a regular basis, this helps in the comprehensive understanding of the products value chain. Apart from the above mentioned sources the data is also collected from the industry consultants to ensure the objective of the study is in the right direction.
Market trends such as technological advancements, regulatory affairs, market dynamics (Drivers, Restraints, Opportunities and Challenges) are obtained from scientific journals, market related national & international associations and organizations.
Data Analysis
From the data that is collected depending on the scope & objective of the research the data is subjected for the analysis. The critical steps that we follow for the data analysis include:
- Product Lifecycle Analysis
- Competitor analysis
- Risk analysis
- Porters Analysis
- PESTEL Analysis
- SWOT Analysis
The data engineering is performed by the core industry experts considering both the Marketing Mix Modeling and the Demand Forecasting. The marketing mix modeling makes use of multiple-regression techniques to predict the optimal mix of marketing variables. Regression factor is based on a number of variables and how they relate to an outcome such as sales or profits.
Data Validation
The data validation is performed by the exhaustive primary research from the expert interviews. This includes telephonic interviews, focus groups, face to face interviews, and questionnaires to validate our research from all aspects. The industry experts we approach come from the leading firms, involved in the supply chain ranging from the suppliers, distributors to the manufacturers and consumers so as to ensure an unbiased analysis.
We are in touch with more than 15,000 industry experts with the right mix of consultants, CEO's, presidents, vice presidents, managers, experts from both supply side and demand side, executives and so on.
The data validation involves the primary research from the industry experts belonging to:
- Leading Companies
- Suppliers & Distributors
- Manufacturers
- Consumers
- Industry/Strategic Consultants
Apart from the data validation the primary research also helps in performing the fill gap research, i.e. providing solutions for the unmet needs of the research which helps in enhancing the reports quality.
For more details about research methodology, kindly write to us at info@strategymrc.com
Frequently Asked Questions
In case of any queries regarding this report, you can contact the customer service by filing the “Inquiry Before Buy” form available on the right hand side. You may also contact us through email: info@strategymrc.com or phone: +1-301-202-5929
Yes, the samples are available for all the published reports. You can request them by filling the “Request Sample” option available in this page.
Yes, you can request a sample with your specific requirements. All the customized samples will be provided as per the requirement with the real data masked.
All our reports are available in Digital PDF format. In case if you require them in any other formats, such as PPT, Excel etc you can submit a request through “Inquiry Before Buy” form available on the right hand side. You may also contact us through email: info@strategymrc.com or phone: +1-301-202-5929
We offer a free 15% customization with every purchase. This requirement can be fulfilled for both pre and post sale. You may send your customization requirements through email at info@strategymrc.com or call us on +1-301-202-5929.
We have 3 different licensing options available in electronic format.
- Single User Licence: Allows one person, typically the buyer, to have access to the ordered product. The ordered product cannot be distributed to anyone else.
- 2-5 User Licence: Allows the ordered product to be shared among a maximum of 5 people within your organisation.
- Corporate License: Allows the product to be shared among all employees of your organisation regardless of their geographical location.
All our reports are typically be emailed to you as an attachment.
To order any available report you need to register on our website. The payment can be made either through CCAvenue or PayPal payments gateways which accept all international cards.
We extend our support to 6 months post sale. A post sale customization is also provided to cover your unmet needs in the report.
Request Customization
We offer complimentary customization of up to 15% with every purchase. To share your customization requirements, feel free to email us at info@strategymrc.com or call us on +1-301-202-5929. .
Please Note: Customization within the 15% threshold is entirely free of charge. If your request exceeds this limit, we will conduct a feasibility assessment. Following that, a detailed quote and timeline will be provided.
WHY CHOOSE US ?

Assured Quality
Best in class reports with high standard of research integrity

24X7 Research Support
Continuous support to ensure the best customer experience.

Free Customization
Adding more values to your product of interest.

Safe & Secure Access
Providing a secured environment for all online transactions.

Trusted by 600+ Brands
Serving the most reputed brands across the world.
