
Specialty Fibers Market
Specialty Fibers Market Forecasts to 2028 - Global Analysis By Type (Partially Oxidized Polyacrylonitrile Fibers, Polybenzimidazole (Pbi) Fibers, Carbon Fibers, Aramid Fibers), Application (Reinforcement Materials, Aerospace), and By Geography

|
Years Covered |
2020-2028 |
|
Estimated Year Value (2022) |
US $5.05 MN |
|
Projected Year Value (2028) |
US $7.41 MN |
|
CAGR (2022 - 2028) |
6.6% |
|
Regions Covered |
North America, Europe, Asia Pacific, South America, and Middle East & Africa |
|
Countries Covered |
US, Canada, Mexico, Germany, UK, Italy, France, Spain, Japan, China, India, Australia, New Zealand, South Korea, Rest of Asia Pacific, South America, Argentina, Brazil, Chile, Middle East & Africa, Saudi Arabia, UAE, Qatar, and South Africa |
|
Largest Market |
Asia Pacific |
|
Fastest Growing Market |
Asia Pacific |
According to Stratistics MRC, the Global Specialty Fibers Market is accounted for 5.05 million tons in 2022 and is expected to reach 7.41 million tons by 2028 growing at a CAGR of 6.6% during the forecast period. Specialty fibers can be defined as those fibers that do NOT comply with single-mode and multimode communication fiber standards. Specialty fibers are optimized for applications other than signal transmission, such as amplifiers, sensors, lasers, filters, ring resonators, etc. To serve such varied applications, there are hundreds of different specialty fiber types, with many variations in glass composition, core and cladding structures, geometric properties, coatings, and specially tailored optical performance characteristics.
The core Segment Fibers accounted for 90.1 per cent of consolidated sales. The smaller Segment Plastics Products generated 7.6 per cent, the Segment Engineering 2.2 per cent and others accounted for 0.1 per cent (based on external sales). Asia Pacific Rayon (APR) announced its plans to increase its production capacity to 600,000 metric ton to meet the strong growth potential of viscose staple fiber and strengthen its market position in Indonesia and export markets across the region. The additional capacity will be achieved through improved optimization and efficiencies and by adding a 300,000-metric-ton viscose production facility in Pangkalan Kerinci, where the company is co-located with the sister company and fiber supplier APRIL Group.
Market Dynamics:
Driver:
Increasing Adoption of Sustainable Products
Textile producers and distributors are increasingly grateful to transport textiles that are sustainably manufactured and free of harmful chemicals due to stress from governments, non-governmental agencies. Huge brands and merchants are requesting that their suppliers verify the items long-term sustainability. For such purposes, restricted substance lists (RSLs) are created, which banned chemicals and their greatest values.
Restraint:
Fluctuations in Raw Material Prices
The costs of raw materials and energy utilized in the production of fabrics are highly fluctuating. These resources prices have a direct impact on the value chain units that include procurement and functioning prices. Manufacturer’s profit limitations are affected by unexpected fluctuations. The final price is prejudiced by raw material prices and accessibility.
Opportunity:
High strength
CFRP (Carbon fiber reinforced polymers) composites, in spite of their light weight, advanced strength and greater resistance per unit weight of CFRP composite than glass fiber composites.
Threat:
Conductivity
Carbon fibers are particularly conductive, while glass fibers are insulated. Many products use fiber glass as an alternative of carbon fiber or metal because they need strict filling. In the creation of utilities, several commodities involve the use of fiber glass.
Covid-19 Impact
The textile sector has impacted in numerous countries since the global lockdown imposed during the COVID-19 pandemic. The supply chains, logistic procedures, and workforce accessibility have decreased, causing the polyarylate market operations to be moderately affected. During the COVID-19, the fiber market qualified a sharp decline, both in capacity and in quantity. This is due to the strong closures that have been placed in different parts of the world, which has led to disruption of the supply chain and production performance. In addition, declining production at end-of-life industries, such as automotive, and passenger car sales also had an impact on the market for synthetic fiber by 2021.
The Polybenzimidazole (PBI) fibers segment is expected to be the largest during the forecast period
The Polybenzimidazole (PBI) fibers segment is expected to record the highest share during the forecast period and due to better-quality properties obtainable by the product, such as high glass changeover temperature, negative melting point, and enormously high heat deflection temperature. PBI fibers are discovering applications in numerous products including heat and safety garments. PBI fibers are widely used for several applications with other high-performance fibers like Kevlar. They are used in plastic reinforcements, for chemical and heat opposing filters, and as well for some civil engineering applications.
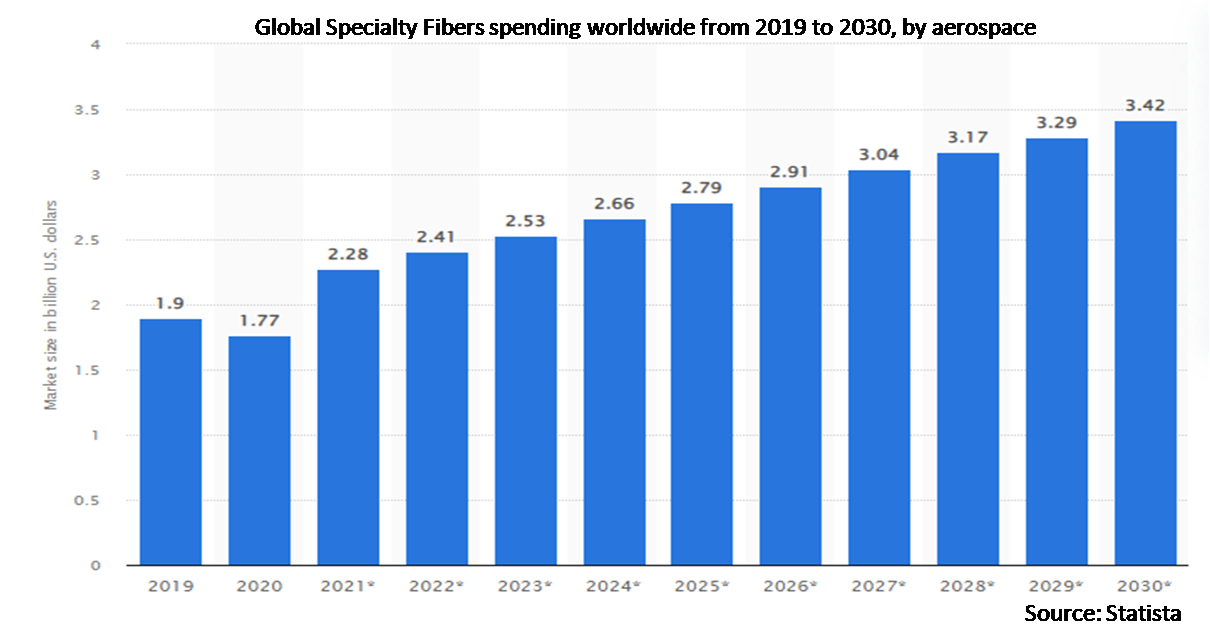
The aerospace segment is expected to have the highest CAGR during the forecast period
The aerospace segment led the market and expected to record a stable CAGR during the forecast period. As the industry is shifting in the direction of lightweight materials in a challenge to get better with cost-efficiency, this segment is having the major growth. Hence, high-strength, lightweight, and fiber-reinforced composite materials are very important to the aircraft manufacturing industry. Lightweight materials and structures provide an essential advantage in aerospace applications since it offers high strength and hardness at a condensed weight, considerably reducing the fuel consumption.
Region with highest share:
The region of Asia Pacific led the market and expected to grow at a highest share over the forecast period due to the rise in demand for fiber-reinforced composite materials in the automotive, electronics, as well as construction sectors. As well, the manufactured goods development, accessibility of raw materials at reasonable prices, and setting up of manufacturing facilities by market leaders are anticipated to drive the market.
Region with highest CAGR:
Asia Pacific region is expected to exhibit higher CAGR during the forecast period, owing to improved technological advancements owing to their large scale adoption in IT & telecommunication, administrative sector and increase in growth of general economy. Governments of developed countries are seriously investing to improve their security infrastructures on individual and country levels. The Asia-Pacific region is one of the prime markets for elevated performance fibers. This region is a major consumer of high performance fibers, to meet this growing demand for high performance fibers from different countries of the Asia-Pacific region.

Key players in the market
Some of the key players profiled in the Global Specialty Fibers Market Dupont, 3M Company, Nv Bekaert Sa, Sgl Group, Dsm N.V., Teijin, Evonik Fibres Gm, Huvis, KOLON Industries, Shenma Industrial, Yantai Tayho Advanced materials, Kamenskvolokno JSC, Umeco Plc.
Key Developments
In March 2021, Teijin Frontier Co. Ltd. has merged with its subsidiary, Teijin Modern Yarn Co. Ltd. and Shinwa Limited, to develop, produce, sell, and process cables under the new name, Teijin Frontier Knitting Co. The company will create next-generation materials that will be used for circular knitting patterns, which will incorporate special threads made by combining the technology of its two predecessors.
Types Covered:
• Partially Oxidized Polyacrylonitrile Fibers
• Polybenzimidazole (Pbi) Fibers
• Carbon Fibers
• Aramid Fibers
• Ultra-High-Molecular-Weight Polyethylene (UHMWPE) Fiber
• Other Types
Application Covered:
• Reinforcement Materials
• Aerospace
• Commercial Marine
• Friction and Sealing Materials
• Security
• Body Armor & Helmet
• Sports Materials
• Tire
• Other Applications
Regions Covered:
• North America
o US
o Canada
o Mexico
• Europe
o Germany
o UK
o Italy
o France
o Spain
o Rest of Europe
• Asia Pacific
o Japan
o China
o India
o Australia
o New Zealand
o South Korea
o Rest of Asia Pacific
• South America
o Argentina
o Brazil
o Chile
o Rest of South America
• Middle East & Africa
o Saudi Arabia
o UAE
o Qatar
o South Africa
o Rest of Middle East & Africa
What our report offers:
- Market share assessments for the regional and country-level segments
- Strategic recommendations for the new entrants
- Covers Market data for the years 2020, 2021, 2022, 2025, and 2028
- Market Trends (Drivers, Constraints, Opportunities, Threats, Challenges, Investment Opportunities, and recommendations)
- Strategic recommendations in key business segments based on the market estimations
- Competitive landscaping mapping the key common trends
- Company profiling with detailed strategies, financials, and recent developments
- Supply chain trends mapping the latest technological advancements
Free Customization Offerings:
All the customers of this report will be entitled to receive one of the following free customization options:
• Company Profiling
o Comprehensive profiling of additional market players (up to 3)
o SWOT Analysis of key players (up to 3)
• Regional Segmentation
o Market estimations, Forecasts and CAGR of any prominent country as per the client's interest (Note: Depends on feasibility check)
• Competitive Benchmarking
o Benchmarking of key players based on product portfolio, geographical presence, and strategic alliances
Table of Contents
1 Executive Summary
2 Preface
2.1 Abstract
2.2 Stake Holders
2.3 Research Scope
2.4 Research Methodology
2.4.1 Data Mining
2.4.2 Data Analysis
2.4.3 Data Validation
2.4.4 Research Approach
2.5 Research Sources
2.5.1 Primary Research Sources
2.5.2 Secondary Research Sources
2.5.3 Assumptions
3 Market Trend Analysis
3.1 Introduction
3.2 Drivers
3.3 Restraints
3.4 Opportunities
3.5 Threats
3.6 Application Analysis
3.7 Emerging Markets
3.8 Impact of Covid-19
4 Porters Five Force Analysis
4.1 Bargaining power of suppliers
4.2 Bargaining power of buyers
4.3 Threat of substitutes
4.4 Threat of new entrants
4.5 Competitive rivalry
5 Global Specialty Fibers Market, By Type
5.1 Introduction
5.2 Partially Oxidized Polyacrylonitrile Fibers
5.3 Polybenzimidazole (Pbi) Fibers
5.4 Carbon Fibers
5.5 Aramid Fibers
5.6 Ultra-High-Molecular-Weight Polyethylene (UHMWPE) Fiber
5.7 Other Types
6 Global Specialty Fibers Market, By Application
6.1 Introduction
6.2 Reinforcement Materials
6.3 Aerospace
6.4 Commercial Marine
6.5 Friction and Sealing Materials
6.6 Security
6.7 Body Armor & Helmet
6.8 Sports Materials
6.9 Tire
6.10 Other Applications
7 Global Specialty Fibers Market, By Geography
7.1 Introduction
7.2 North America
7.2.1 US
7.2.2 Canada
7.2.3 Mexico
7.3 Europe
7.3.1 Germany
7.3.2 UK
7.3.3 Italy
7.3.4 France
7.3.5 Spain
7.3.6 Rest of Europe
7.4 Asia Pacific
7.4.1 Japan
7.4.2 China
7.4.3 India
7.4.4 Australia
7.4.5 New Zealand
7.4.6 South Korea
7.4.7 Rest of Asia Pacific
7.5 South America
7.5.1 Argentina
7.5.2 Brazil
7.5.3 Chile
7.5.4 Rest of South America
7.6 Middle East & Africa
7.6.1 Saudi Arabia
7.6.2 UAE
7.6.3 Qatar
7.6.4 South Africa
7.6.5 Rest of Middle East & Africa
8 Key Developments
8.1 Agreements, Partnerships, Collaborations and Joint Ventures
8.2 Acquisitions & Mergers
8.3 New Product Launch
8.4 Expansions
8.5 Other Key Strategies
9 Company Profiling
9.1 Dupont
9.2 3M Company
9.3 Nv Bekaert Sa
9.4 Sgl Group
9.5 Dsm N.V.
9.6 Teijin
9.7 Evonik Fibres Gmbh
9.8 Huvis
9.9 KOLON Industries
9.10 Shenma Industrial
9.11 Yantai Tayho Advanced materials
9.12 Kamenskvolokno JSC
9.13 Umeco Plc
List of Tables
1 Global Specialty Fibers Market Outlook, By Region (2020-2028) ($MN)
2 Global Specialty Fibers Market Outlook, By Reinforcement Materials (2020-2028) ($MN)
3 Global Specialty Fibers Market Outlook, By Aerospace (2020-2028) ($MN)
4 Global Specialty Fibers Market Outlook, By Commercial Marine (2020-2028) ($MN)
5 Global Specialty Fibers Market Outlook, By Friction and Sealing Materials (2020-2028) ($MN)
6 Global Specialty Fibers Market Outlook, By Security (2020-2028) ($MN)
7 Global Specialty Fibers Market Outlook, By Body Armor & Helmet (2020-2028) ($MN)
8 Global Specialty Fibers Market Outlook, By Sports Materials (2020-2028) ($MN)
9 Global Specialty Fibers Market Outlook, By Tire (2020-2028) ($MN)
10 Global Specialty Fibers Market Outlook, By Reinforcement Materials (2020-2028) ($MN)
11 Global Specialty Fibers Market Outlook, By Aerospace (2020-2028) ($MN)
12 Global Specialty Fibers Market Outlook, By Commercial Marine (2020-2028) ($MN)
13 Global Specialty Fibers Market Outlook, By Friction and Sealing Materials (2020-2028) ($MN)
14 Global Specialty Fibers Market Outlook, By Security (2020-2028) ($MN)
15 Global Specialty Fibers Market Outlook, By Body Armor & Helmet (2020-2028) ($MN)
16 Global Specialty Fibers Market Outlook, By Sports Materials (2020-2028) ($MN)
17 Global Specialty Fibers Market Outlook, By Tire (2020-2028) ($MN)
18 Global Specialty Fibers Market Outlook, By Other Applications (2020-2028) ($MN)
19 North America Specialty Fibers Market Outlook, By Country (2020-2028) ($MN)
20 North America Specialty Fibers Market Outlook, By Reinforcement Materials (2020-2028) ($MN)
21 North America Specialty Fibers Market Outlook, By Aerospace (2020-2028) ($MN)
22 North America Specialty Fibers Market Outlook, By Commercial Marine (2020-2028) ($MN)
23 North America Specialty Fibers Market Outlook, By Friction and Sealing Materials (2020-2028) ($MN)
24 North America Specialty Fibers Market Outlook, By Security (2020-2028) ($MN)
25 North America Specialty Fibers Market Outlook, By Body Armor & Helmet (2020-2028) ($MN)
26 North America Specialty Fibers Market Outlook, By Sports Materials (2020-2028) ($MN)
27 North America Specialty Fibers Market Outlook, By Tire (2020-2028) ($MN)
28 North America Specialty Fibers Market Outlook, By Reinforcement Materials (2020-2028) ($MN)
29 North America Specialty Fibers Market Outlook, By Aerospace (2020-2028) ($MN)
30 North America Specialty Fibers Market Outlook, By Commercial Marine (2020-2028) ($MN)
31 North America Specialty Fibers Market Outlook, By Friction and Sealing Materials (2020-2028) ($MN)
32 North America Specialty Fibers Market Outlook, By Security (2020-2028) ($MN)
33 North America Specialty Fibers Market Outlook, By Body Armor & Helmet (2020-2028) ($MN)
34 North America Specialty Fibers Market Outlook, By Sports Materials (2020-2028) ($MN)
35 North America Specialty Fibers Market Outlook, By Tire (2020-2028) ($MN)
36 North America Specialty Fibers Market Outlook, By Other Applications (2020-2028) ($MN)
37 Europe Specialty Fibers Market Outlook, By Country (2020-2028) ($MN)
38 Europe Specialty Fibers Market Outlook, By Reinforcement Materials (2020-2028) ($MN)
39 Europe Specialty Fibers Market Outlook, By Aerospace (2020-2028) ($MN)
40 Europe Specialty Fibers Market Outlook, By Commercial Marine (2020-2028) ($MN)
41 Europe Specialty Fibers Market Outlook, By Friction and Sealing Materials (2020-2028) ($MN)
42 Europe Specialty Fibers Market Outlook, By Security (2020-2028) ($MN)
43 Europe Specialty Fibers Market Outlook, By Body Armor & Helmet (2020-2028) ($MN)
44 Europe Specialty Fibers Market Outlook, By Sports Materials (2020-2028) ($MN)
45 Europe Specialty Fibers Market Outlook, By Tire (2020-2028) ($MN)
46 Europe Specialty Fibers Market Outlook, By Reinforcement Materials (2020-2028) ($MN)
47 Europe Specialty Fibers Market Outlook, By Aerospace (2020-2028) ($MN)
48 Europe Specialty Fibers Market Outlook, By Commercial Marine (2020-2028) ($MN)
49 Europe Specialty Fibers Market Outlook, By Friction and Sealing Materials (2020-2028) ($MN)
50 Europe Specialty Fibers Market Outlook, By Security (2020-2028) ($MN)
51 Europe Specialty Fibers Market Outlook, By Body Armor & Helmet (2020-2028) ($MN)
52 Europe Specialty Fibers Market Outlook, By Sports Materials (2020-2028) ($MN)
53 Europe Specialty Fibers Market Outlook, By Tire (2020-2028) ($MN)
54 Europe Specialty Fibers Market Outlook, By Other Applications (2020-2028) ($MN)
55 Asia Pacific Specialty Fibers Market Outlook, By Country (2020-2028) ($MN)
56 Asia Pacific Specialty Fibers Market Outlook, By Reinforcement Materials (2020-2028) ($MN)
57 Asia Pacific Specialty Fibers Market Outlook, By Aerospace (2020-2028) ($MN)
58 Asia Pacific Specialty Fibers Market Outlook, By Commercial Marine (2020-2028) ($MN)
59 Asia Pacific Specialty Fibers Market Outlook, By Friction and Sealing Materials (2020-2028) ($MN)
60 Asia Pacific Specialty Fibers Market Outlook, By Security (2020-2028) ($MN)
61 Asia Pacific Specialty Fibers Market Outlook, By Body Armor & Helmet (2020-2028) ($MN)
62 Asia Pacific Specialty Fibers Market Outlook, By Sports Materials (2020-2028) ($MN)
63 Asia Pacific Specialty Fibers Market Outlook, By Tire (2020-2028) ($MN)
64 Asia Pacific Specialty Fibers Market Outlook, By Reinforcement Materials (2020-2028) ($MN)
65 Asia Pacific Specialty Fibers Market Outlook, By Aerospace (2020-2028) ($MN)
66 Asia Pacific Specialty Fibers Market Outlook, By Commercial Marine (2020-2028) ($MN)
67 Asia Pacific Specialty Fibers Market Outlook, By Friction and Sealing Materials (2020-2028) ($MN)
68 Asia Pacific Specialty Fibers Market Outlook, By Security (2020-2028) ($MN)
69 Asia Pacific Specialty Fibers Market Outlook, By Body Armor & Helmet (2020-2028) ($MN)
70 Asia Pacific Specialty Fibers Market Outlook, By Sports Materials (2020-2028) ($MN)
71 Asia Pacific Specialty Fibers Market Outlook, By Tire (2020-2028) ($MN)
72 Asia Pacific Specialty Fibers Market Outlook, By Other Applications (2020-2028) ($MN)
73 South America Specialty Fibers Market Outlook, By Country (2020-2028) ($MN)
74 South America Specialty Fibers Market Outlook, By Reinforcement Materials (2020-2028) ($MN)
75 South America Specialty Fibers Market Outlook, By Aerospace (2020-2028) ($MN)
76 South America Specialty Fibers Market Outlook, By Commercial Marine (2020-2028) ($MN)
77 South America Specialty Fibers Market Outlook, By Friction and Sealing Materials (2020-2028) ($MN)
78 South America Specialty Fibers Market Outlook, By Security (2020-2028) ($MN)
79 South America Specialty Fibers Market Outlook, By Body Armor & Helmet (2020-2028) ($MN)
80 South America Specialty Fibers Market Outlook, By Sports Materials (2020-2028) ($MN)
81 South America Specialty Fibers Market Outlook, By Tire (2020-2028) ($MN)
82 South America Specialty Fibers Market Outlook, By Reinforcement Materials (2020-2028) ($MN)
83 South America Specialty Fibers Market Outlook, By Aerospace (2020-2028) ($MN)
84 South America Specialty Fibers Market Outlook, By Commercial Marine (2020-2028) ($MN)
85 South America Specialty Fibers Market Outlook, By Friction and Sealing Materials (2020-2028) ($MN)
86 South America Specialty Fibers Market Outlook, By Security (2020-2028) ($MN)
87 South America Specialty Fibers Market Outlook, By Body Armor & Helmet (2020-2028) ($MN)
88 South America Specialty Fibers Market Outlook, By Sports Materials (2020-2028) ($MN)
89 South America Specialty Fibers Market Outlook, By Tire (2020-2028) ($MN)
90 South America Specialty Fibers Market Outlook, By Other Applications (2020-2028) ($MN)
91 Middle East & Africa Specialty Fibers Market Outlook, By Country (2020-2028) ($MN)
92 Middle East & Africa Specialty Fibers Market Outlook, By Reinforcement Materials (2020-2028) ($MN)
93 Middle East & Africa Specialty Fibers Market Outlook, By Aerospace (2020-2028) ($MN)
94 Middle East & Africa Specialty Fibers Market Outlook, By Commercial Marine (2020-2028) ($MN)
95 Middle East & Africa Specialty Fibers Market Outlook, By Friction and Sealing Materials (2020-2028) ($MN)
96 Middle East & Africa Specialty Fibers Market Outlook, By Security (2020-2028) ($MN)
97 Middle East & Africa Specialty Fibers Market Outlook, By Body Armor & Helmet (2020-2028) ($MN)
98 Middle East & Africa Specialty Fibers Market Outlook, By Sports Materials (2020-2028) ($MN)
99 Middle East & Africa Specialty Fibers Market Outlook, By Tire (2020-2028) ($MN)
100 Middle East & Africa Specialty Fibers Market Outlook, By Reinforcement Materials (2020-2028) ($MN)
101 Middle East & Africa Specialty Fibers Market Outlook, By Aerospace (2020-2028) ($MN)
102 Middle East & Africa Specialty Fibers Market Outlook, By Commercial Marine (2020-2028) ($MN)
103 Middle East & Africa Specialty Fibers Market Outlook, By Friction and Sealing Materials (2020-2028) ($MN)
104 Middle East & Africa Specialty Fibers Market Outlook, By Security (2020-2028) ($MN)
105 Middle East & Africa Specialty Fibers Market Outlook, By Body Armor & Helmet (2020-2028) ($MN)
106 Middle East & Africa Specialty Fibers Market Outlook, By Sports Materials (2020-2028) ($MN)
107 Middle East & Africa Specialty Fibers Market Outlook, By Tire (2020-2028) ($MN)
108 Middle East & Africa Specialty Fibers Market Outlook, By Other Applications (2020-2028) ($MN)
List of Figures
RESEARCH METHODOLOGY

We at ‘Stratistics’ opt for an extensive research approach which involves data mining, data validation, and data analysis. The various research sources include in-house repository, secondary research, competitor’s sources, social media research, client internal data, and primary research.
Our team of analysts prefers the most reliable and authenticated data sources in order to perform the comprehensive literature search. With access to most of the authenticated data bases our team highly considers the best mix of information through various sources to obtain extensive and accurate analysis.
Each report takes an average time of a month and a team of 4 industry analysts. The time may vary depending on the scope and data availability of the desired market report. The various parameters used in the market assessment are standardized in order to enhance the data accuracy.
Data Mining
The data is collected from several authenticated, reliable, paid and unpaid sources and is filtered depending on the scope & objective of the research. Our reports repository acts as an added advantage in this procedure. Data gathering from the raw material suppliers, distributors and the manufacturers is performed on a regular basis, this helps in the comprehensive understanding of the products value chain. Apart from the above mentioned sources the data is also collected from the industry consultants to ensure the objective of the study is in the right direction.
Market trends such as technological advancements, regulatory affairs, market dynamics (Drivers, Restraints, Opportunities and Challenges) are obtained from scientific journals, market related national & international associations and organizations.
Data Analysis
From the data that is collected depending on the scope & objective of the research the data is subjected for the analysis. The critical steps that we follow for the data analysis include:
- Product Lifecycle Analysis
- Competitor analysis
- Risk analysis
- Porters Analysis
- PESTEL Analysis
- SWOT Analysis
The data engineering is performed by the core industry experts considering both the Marketing Mix Modeling and the Demand Forecasting. The marketing mix modeling makes use of multiple-regression techniques to predict the optimal mix of marketing variables. Regression factor is based on a number of variables and how they relate to an outcome such as sales or profits.
Data Validation
The data validation is performed by the exhaustive primary research from the expert interviews. This includes telephonic interviews, focus groups, face to face interviews, and questionnaires to validate our research from all aspects. The industry experts we approach come from the leading firms, involved in the supply chain ranging from the suppliers, distributors to the manufacturers and consumers so as to ensure an unbiased analysis.
We are in touch with more than 15,000 industry experts with the right mix of consultants, CEO's, presidents, vice presidents, managers, experts from both supply side and demand side, executives and so on.
The data validation involves the primary research from the industry experts belonging to:
- Leading Companies
- Suppliers & Distributors
- Manufacturers
- Consumers
- Industry/Strategic Consultants
Apart from the data validation the primary research also helps in performing the fill gap research, i.e. providing solutions for the unmet needs of the research which helps in enhancing the reports quality.
For more details about research methodology, kindly write to us at info@strategymrc.com
Frequently Asked Questions
In case of any queries regarding this report, you can contact the customer service by filing the “Inquiry Before Buy” form available on the right hand side. You may also contact us through email: info@strategymrc.com or phone: +1-301-202-5929
Yes, the samples are available for all the published reports. You can request them by filling the “Request Sample” option available in this page.
Yes, you can request a sample with your specific requirements. All the customized samples will be provided as per the requirement with the real data masked.
All our reports are available in Digital PDF format. In case if you require them in any other formats, such as PPT, Excel etc you can submit a request through “Inquiry Before Buy” form available on the right hand side. You may also contact us through email: info@strategymrc.com or phone: +1-301-202-5929
We offer a free 15% customization with every purchase. This requirement can be fulfilled for both pre and post sale. You may send your customization requirements through email at info@strategymrc.com or call us on +1-301-202-5929.
We have 3 different licensing options available in electronic format.
- Single User Licence: Allows one person, typically the buyer, to have access to the ordered product. The ordered product cannot be distributed to anyone else.
- 2-5 User Licence: Allows the ordered product to be shared among a maximum of 5 people within your organisation.
- Corporate License: Allows the product to be shared among all employees of your organisation regardless of their geographical location.
All our reports are typically be emailed to you as an attachment.
To order any available report you need to register on our website. The payment can be made either through CCAvenue or PayPal payments gateways which accept all international cards.
We extend our support to 6 months post sale. A post sale customization is also provided to cover your unmet needs in the report.
Request Customization
We provide a free 15% customization on every purchase. This requirement can be fulfilled for both pre and post sale. You may send your customization requirements through email at info@strategymrc.com or call us on +1-301-202-5929.
Note: This customization is absolutely free until it falls under the 15% bracket. If your requirement exceeds this a feasibility check will be performed. Post that, a quote will be provided along with the timelines.
WHY CHOOSE US ?

Assured Quality
Best in class reports with high standard of research integrity

24X7 Research Support
Continuous support to ensure the best customer experience.

Free Customization
Adding more values to your product of interest.

Safe & Secure Access
Providing a secured environment for all online transactions.

Trusted by 600+ Brands
Serving the most reputed brands across the world.