
Sports Hydration And Recovery Drinks Market
Sports Hydration & Recovery Drinks Market Forecasts to 2034 - Global Analysis By Product Type (Isotonic Drinks, Hypotonic Drinks, Hypertonic Drinks, Recovery Protein Drinks and Other Product Types), Ingredient Type, Distribution Channel, Application, and End User

|
Years Covered |
2023-2034 |
|
Estimated Year Value (2026) |
US $51.1 BN |
|
Projected Year Value (2034) |
US $109.6 BN |
|
CAGR (2026-2034) |
10% |
|
Regions Covered |
North America, Europe, Asia Pacific, South America, and Rest of the World (RoW) |
|
Countries Covered |
United States, Canada, Mexico, United Kingdom, Germany, France, Italy, Spain, Netherlands, Belgium, Sweden, Switzerland, Poland, Rest of Europe, China, Japan, India, South Korea, Australia, Indonesia, Thailand, Malaysia, Singapore, Vietnam, Rest of Asia Pacific, Brazil, Argentina, Colombia, Chile, Peru, Rest of South America, Saudi Arabia, United Arab Emirates, Qatar, Israel, Rest of Middle East, South Africa, Egypt, Morocco, and Rest of Africa. |
|
Largest Market |
North America |
|
Highest Growing Market |
Asia Pacific |
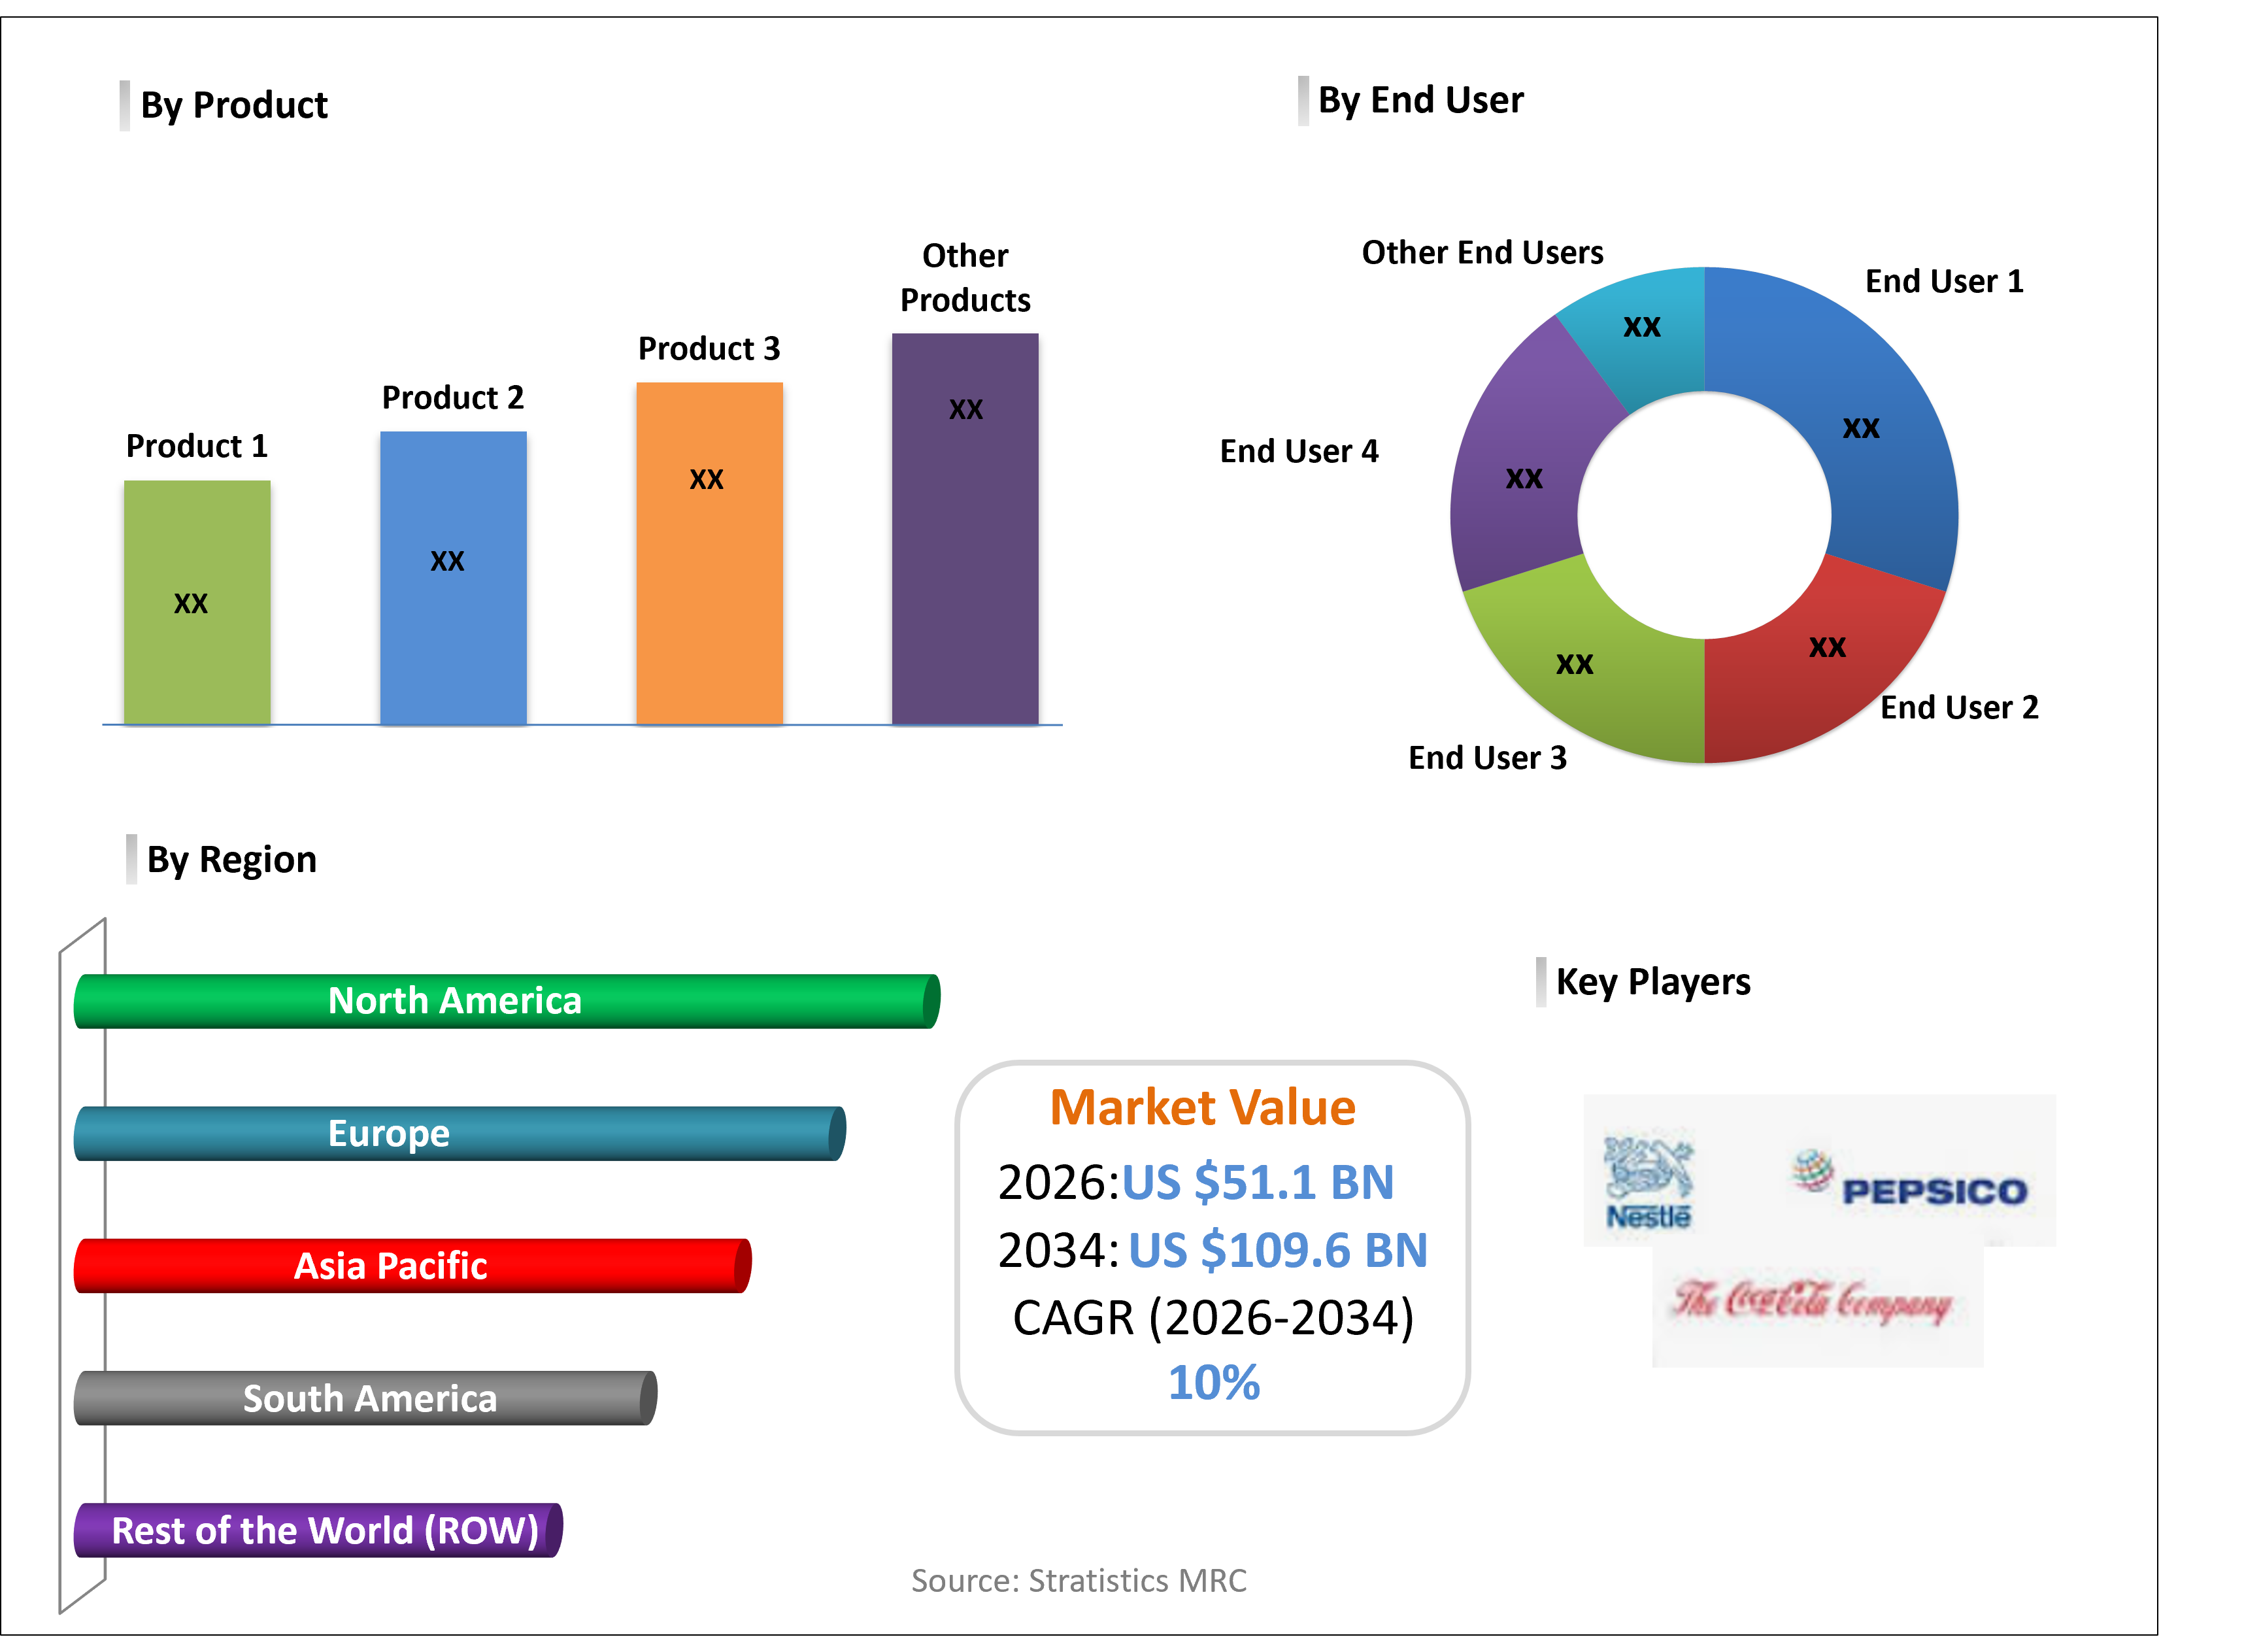
According to Stratistics MRC, the Global Sports Hydration & Recovery Drinks Market is accounted for $51.1 billion in 2026 and is expected to reach $109.6 billion by 2034 growing at a CAGR of 10% during the forecast period. Sports Hydration & Recovery Drinks are formulated to replenish fluids, electrolytes, and nutrients lost during physical activity. These beverages support hydration, muscle recovery, and endurance performance. They include isotonic, hypotonic, and hypertonic drinks enriched with electrolytes, amino acids, and vitamins. Widely used by athletes and fitness enthusiasts, these products help improve performance and reduce fatigue. Increasing participation in sports and fitness activities is driving demand. Manufacturers are focusing on clean-label formulations and natural ingredients to attract health-conscious consumers.
Market Dynamics:
Driver:
Increasing participation in fitness activities
Rising awareness of hydration’s role in performance and recovery has boosted demand for specialized drinks. Gyms, sports clubs, and recreational centers actively promote hydration products to support endurance and wellness. Youth and professional athletes alike are turning to functional beverages for improved stamina. The expansion of organized sports and fitness events further accelerates consumption. Collectively, growing fitness participation remains the strongest driver of market growth.
Restraint:
Price sensitivity among casual consumers
Price sensitivity among casual consumers acts as a major restraint for the market. Many hydration and recovery drinks are priced at a premium due to advanced formulations. Casual exercisers often opt for cheaper alternatives such as water or basic beverages. This limits penetration in non-professional segments, particularly in emerging markets. High costs also reduce repeat purchases among budget-conscious consumers.
Opportunity:
Low-sugar and clean hydration formulations
Consumers increasingly prefer beverages that balance performance benefits with health-conscious ingredients. Innovations in plant-based electrolytes, natural flavors, and functional additives enhance appeal. Clean-label positioning strengthens trust and aligns with wellness-focused lifestyles. Brands investing in transparent formulations gain competitive advantage in premium and mainstream segments. This opportunity positions low-sugar hydration as a cornerstone of future market development.
Threat:
Regulatory scrutiny on performance claims
Authorities closely monitor product labeling to ensure claims about endurance, recovery, or energy are scientifically validated. Misleading claims can lead to fines, recalls, and reputational damage. Heightened consumer awareness of exaggerated marketing further intensifies scrutiny. Smaller brands face challenges in meeting compliance standards, while larger firms incur higher testing costs. These risks highlight the importance of transparency and clinical validation in product positioning.
Covid-19 Impact:
The Covid-19 pandemic reshaped consumer behavior in the sports hydration market. Lockdowns reduced participation in organized sports, temporarily slowing demand. However, home workouts and digital fitness platforms boosted interest in hydration and recovery solutions. Online retail channels gained prominence as physical stores faced restrictions. Supply chain disruptions initially affected product availability but recovery efforts stabilized distribution.
The isotonic drinks segment is expected to be the largest during the forecast period
The isotonic drinks segment is expected to account for the largest market share during the forecast period due to its widespread use in replenishing electrolytes and maintaining hydration balance. These drinks are particularly popular among athletes and fitness enthusiasts for immediate energy and recovery. Their versatility across professional and recreational sports supports segment dominance. Continuous innovation in flavors and packaging enhances consumer appeal. Strong distribution networks across retail and gyms reinforce accessibility.
The youth consumers segment is expected to have the highest CAGR during the forecast period
Over the forecast period, the youth consumers segment is predicted to witness the highest growth rate due to rising participation in school sports, fitness clubs, and recreational activities drives demand in this demographic. Youth consumers are highly receptive to innovative flavors and functional benefits. Social media influence and peer trends further accelerate adoption. Affordable, portable hydration products resonate strongly with younger audiences.
Region with largest share:
During the forecast period, the North America region is expected to hold the largest market share owing to high consumer awareness of hydration benefits. Strong disposable incomes support investment in premium sports drinks. The presence of leading beverage brands reinforces regional dominance. Regulatory frameworks supporting product safety enhance consumer confidence. Marketing campaigns targeting athletes and fitness enthusiasts further strengthen demand.
Region with highest CAGR:
Over the forecast period, the Asia Pacific region is anticipated to exhibit the highest CAGR driven by rapid urbanization and rising fitness participation. Expanding middle-class populations in countries such as India and China fuel demand for hydration and recovery solutions. Younger demographics increasingly embrace fitness lifestyles, boosting adoption. E-commerce platforms accelerate accessibility of sports drinks across diverse geographies. Government-led initiatives promoting health and wellness further support market growth.

Key players in the market
Some of the key players in Sports Hydration & Recovery Drinks Market include PepsiCo, Inc., The Coca-Cola Company, Nestlé S.A., Danone S.A., Monster Beverage Corporation, Red Bull GmbH, Glanbia plc, Herbalife Nutrition Ltd., Abbott Laboratories, Amway Corporation, Electrolit, BodyArmor, Skratch Labs, Oshee and High5 Ltd.
Key Developments:
In May 2026, PepsiCo announced a long-term collaboration with Fertiberia to scale the use of green hydrogen-based fertilizers across 400,000 acres of European farmland. This partnership supports the sustainable sourcing of key ingredients like corn and sugar beet, ensuring that flagship products like Gatorade meet the company's "PepsiCo Positive" goals for reducing Scope 3 carbon emissions by 30% by 2030.
In February 2026, Glanbia PLC reported that its Performance Nutrition segment remains its primary growth engine, driven by the #1 global market position of its Optimum Nutrition brand. This strategic focus is supported by a group-wide transformation program intended to simplify operations and accelerate digital innovation to meet the evolving "active lifestyle" needs of global consumers.
Product Types Covered:
• Isotonic Drinks
• Hypotonic Drinks
• Hypertonic Drinks
• Recovery Protein Drinks
• Other Product Types
Ingredient Types Covered:
• Electrolytes
• Carbohydrates
• Proteins & Amino Acids
• Vitamins & Minerals
• Other Ingredient Types
Distribution Channels Covered:
• Supermarkets & Hypermarkets
• Convenience Stores
• Online Retail
• Fitness Centers & Gyms
• Other Distribution Channels
Applications Covered:
• Endurance Sports
• Fitness Training
• Professional Sports
• Recreational Activities
• Other Applications
End Users Covered:
• Athletes
• Fitness Enthusiasts
• Recreational Users
• Youth Consumers
• Other End Users
Regions Covered:
• North America
o United States
o Canada
o Mexico
• Europe
o United Kingdom
o Germany
o France
o Italy
o Spain
o Netherlands
o Belgium
o Sweden
o Switzerland
o Poland
o Rest of Europe
• Asia Pacific
o China
o Japan
o India
o South Korea
o Australia
o Indonesia
o Thailand
o Malaysia
o Singapore
o Vietnam
o Rest of Asia Pacific
• South America
o Brazil
o Argentina
o Colombia
o Chile
o Peru
o Rest of South America
• Rest of the World (RoW)
o Middle East
§ Saudi Arabia
§ United Arab Emirates
§ Qatar
§ Israel
§ Rest of Middle East
o Africa
§ South Africa
§ Egypt
§ Morocco
§ Rest of Africa
What our report offers:
- Market share assessments for the regional and country-level segments
- Strategic recommendations for the new entrants
- Covers Market data for the years 2023, 2024, 2025, 2026, 2027, 2028, 2030, 2032 and 2034
- Market Trends (Drivers, Constraints, Opportunities, Threats, Challenges, Investment Opportunities, and recommendations)
- Strategic recommendations in key business segments based on the market estimations
- Competitive landscaping mapping the key common trends
- Company profiling with detailed strategies, financials, and recent developments
- Supply chain trends mapping the latest technological advancements
Free Customization Offerings:
All the customers of this report will be entitled to receive one of the following free customization options:
• Company Profiling
o Comprehensive profiling of additional market players (up to 3)
o SWOT Analysis of key players (up to 3)
• Regional Segmentation
o Market estimations, Forecasts and CAGR of any prominent country as per the client's interest (Note: Depends on feasibility check)
• Competitive Benchmarking
o Benchmarking of key players based on product portfolio, geographical presence, and strategic alliances
Table of Contents
1 Executive Summary
1.1 Market Snapshot and Key Highlights
1.2 Growth Drivers, Challenges, and Opportunities
1.3 Competitive Landscape Overview
1.4 Strategic Insights and Recommendations
2 Research Framework
2.1 Study Objectives and Scope
2.2 Stakeholder Analysis
2.3 Research Assumptions and Limitations
2.4 Research Methodology
2.4.1 Data Collection (Primary and Secondary)
2.4.2 Data Modeling and Estimation Techniques
2.4.3 Data Validation and Triangulation
2.4.4 Analytical and Forecasting Approach
3 Market Dynamics and Trend Analysis
3.1 Market Definition and Structure
3.2 Key Market Drivers
3.3 Market Restraints and Challenges
3.4 Growth Opportunities and Investment Hotspots
3.5 Industry Threats and Risk Assessment
3.6 Technology and Innovation Landscape
3.7 Emerging and High-Growth Markets
3.8 Regulatory and Policy Environment
3.9 Impact of COVID-19 and Recovery Outlook
4 Competitive and Strategic Assessment
4.1 Porter's Five Forces Analysis
4.1.1 Supplier Bargaining Power
4.1.2 Buyer Bargaining Power
4.1.3 Threat of Substitutes
4.1.4 Threat of New Entrants
4.1.5 Competitive Rivalry
4.2 Market Share Analysis of Key Players
4.3 Product Benchmarking and Performance Comparison
5 Global Sports Hydration & Recovery Drinks Market, By Product Type
5.1 Isotonic Drinks
5.2 Hypotonic Drinks
5.3 Hypertonic Drinks
5.4 Recovery Protein Drinks
5.5 Other Product Types
6 Global Sports Hydration & Recovery Drinks Market, By Ingredient Type
6.1 Electrolytes
6.2 Carbohydrates
6.3 Proteins & Amino Acids
6.4 Vitamins & Minerals
6.5 Other Ingredient Types
7 Global Sports Hydration & Recovery Drinks Market, By Distribution Channel
7.1 Supermarkets & Hypermarkets
7.2 Convenience Stores
7.3 Online Retail
7.4 Fitness Centers & Gyms
7.5 Other Distribution Channels
8 Global Sports Hydration & Recovery Drinks Market, By Application
8.1 Endurance Sports
8.2 Fitness Training
8.3 Professional Sports
8.4 Recreational Activities
8.5 Other Applications
9 Global Sports Hydration & Recovery Drinks Market, By End User
9.1 Athletes
9.2 Fitness Enthusiasts
9.3 Recreational Users
9.4 Youth Consumers
9.5 Other End Users
10 Global Sports Hydration & Recovery Drinks Market, By Geography
10.1 North America
10.1.1 United States
10.1.2 Canada
10.1.3 Mexico
10.2 Europe
10.2.1 United Kingdom
10.2.2 Germany
10.2.3 France
10.2.4 Italy
10.2.5 Spain
10.2.6 Netherlands
10.2.7 Belgium
10.2.8 Sweden
10.2.9 Switzerland
10.2.10 Poland
10.2.11 Rest of Europe
10.3 Asia Pacific
10.3.1 China
10.3.2 Japan
10.3.3 India
10.3.4 South Korea
10.3.5 Australia
10.3.6 Indonesia
10.3.7 Thailand
10.3.8 Malaysia
10.3.9 Singapore
10.3.10 Vietnam
10.3.11 Rest of Asia Pacific
10.4 South America
10.4.1 Brazil
10.4.2 Argentina
10.4.3 Colombia
10.4.4 Chile
10.4.5 Peru
10.4.6 Rest of South America
10.5 Rest of the World (RoW)
10.5.1 Middle East
10.5.1.1 Saudi Arabia
10.5.1.2 United Arab Emirates
10.5.1.3 Qatar
10.5.1.4 Israel
10.5.1.5 Rest of Middle East
10.5.2 Africa
10.5.2.1 South Africa
10.5.2.2 Egypt
10.5.2.3 Morocco
10.5.2.4 Rest of Africa
11 Strategic Market Intelligence
11.1 Industry Value Network and Supply Chain Assessment
11.2 White-Space and Opportunity Mapping
11.3 Product Evolution and Market Life Cycle Analysis
11.4 Channel, Distributor, and Go-to-Market Assessment
12 Industry Developments and Strategic Initiatives
12.1 Mergers and Acquisitions
12.2 Partnerships, Alliances, and Joint Ventures
12.3 New Product Launches and Certifications
12.4 Capacity Expansion and Investments
12.5 Other Strategic Initiatives
13 Company Profiles
13.1 PepsiCo, Inc.
13.2 The Coca-Cola Company
13.3 Nestlé S.A.
13.4 Danone S.A.
13.5 Monster Beverage Corporation
13.6 Red Bull GmbH
13.7 Glanbia plc
13.8 Herbalife Nutrition Ltd.
13.9 Abbott Laboratories
13.10 Amway Corporation
13.11 Electrolit
13.12 BodyArmor
13.13 Skratch Labs
13.14 Oshee
13.15 High5 Ltd.
List of Tables
1 Global Sports Hydration & Recovery Drinks Market Outlook, By Region (2023-2034) ($MN)
2 Global Sports Hydration & Recovery Drinks Market, By Product Type (2023–2034) ($MN)
3 Global Sports Hydration & Recovery Drinks Market, By Isotonic Drinks (2023–2034) ($MN)
4 Global Sports Hydration & Recovery Drinks Market, By Hypotonic Drinks (2023–2034) ($MN)
5 Global Sports Hydration & Recovery Drinks Market, By Hypertonic Drinks (2023–2034) ($MN)
6 Global Sports Hydration & Recovery Drinks Market, By Recovery Protein Drinks (2023–2034) ($MN)
7 Global Sports Hydration & Recovery Drinks Market, By Other Product Types (2023–2034) ($MN)
8 Global Sports Hydration & Recovery Drinks Market, By Ingredient Type (2023–2034) ($MN)
9 Global Sports Hydration & Recovery Drinks Market, By Electrolytes (2023–2034) ($MN)
10 Global Sports Hydration & Recovery Drinks Market, By Carbohydrates (2023–2034) ($MN)
11 Global Sports Hydration & Recovery Drinks Market, By Proteins & Amino Acids (2023–2034) ($MN)
12 Global Sports Hydration & Recovery Drinks Market, By Vitamins & Minerals (2023–2034) ($MN)
13 Global Sports Hydration & Recovery Drinks Market, By Other Ingredient Types (2023–2034) ($MN)
14 Global Sports Hydration & Recovery Drinks Market, By Distribution Channel (2023–2034) ($MN)
15 Global Sports Hydration & Recovery Drinks Market, By Supermarkets & Hypermarkets (2023–2034) ($MN)
16 Global Sports Hydration & Recovery Drinks Market, By Convenience Stores (2023–2034) ($MN)
17 Global Sports Hydration & Recovery Drinks Market, By Online Retail (2023–2034) ($MN)
18 Global Sports Hydration & Recovery Drinks Market, By Fitness Centers & Gyms (2023–2034) ($MN)
19 Global Sports Hydration & Recovery Drinks Market, By Other Distribution Channels (2023–2034) ($MN)
20 Global Sports Hydration & Recovery Drinks Market, By Application (2023–2034) ($MN)
21 Global Sports Hydration & Recovery Drinks Market, By Endurance Sports (2023–2034) ($MN)
22 Global Sports Hydration & Recovery Drinks Market, By Fitness Training (2023–2034) ($MN)
23 Global Sports Hydration & Recovery Drinks Market, By Professional Sports (2023–2034) ($MN)
24 Global Sports Hydration & Recovery Drinks Market, By Recreational Activities (2023–2034) ($MN)
25 Global Sports Hydration & Recovery Drinks Market, By Other Applications (2023–2034) ($MN)
26 Global Sports Hydration & Recovery Drinks Market, By End User (2023–2034) ($MN)
27 Global Sports Hydration & Recovery Drinks Market, By Athletes (2023–2034) ($MN)
28 Global Sports Hydration & Recovery Drinks Market, By Fitness Enthusiasts (2023–2034) ($MN)
29 Global Sports Hydration & Recovery Drinks Market, By Recreational Users (2023–2034) ($MN)
30 Global Sports Hydration & Recovery Drinks Market, By Youth Consumers (2023–2034) ($MN)
31 Global Sports Hydration & Recovery Drinks Market, By Other End Users (2023–2034) ($MN)
Note: Tables for North America, Europe, APAC, South America, and Rest of the World (RoW) are also represented in the same manner as above.
List of Figures
RESEARCH METHODOLOGY

We at ‘Stratistics’ opt for an extensive research approach which involves data mining, data validation, and data analysis. The various research sources include in-house repository, secondary research, competitor’s sources, social media research, client internal data, and primary research.
Our team of analysts prefers the most reliable and authenticated data sources in order to perform the comprehensive literature search. With access to most of the authenticated data bases our team highly considers the best mix of information through various sources to obtain extensive and accurate analysis.
Each report takes an average time of a month and a team of 4 industry analysts. The time may vary depending on the scope and data availability of the desired market report. The various parameters used in the market assessment are standardized in order to enhance the data accuracy.
Data Mining
The data is collected from several authenticated, reliable, paid and unpaid sources and is filtered depending on the scope & objective of the research. Our reports repository acts as an added advantage in this procedure. Data gathering from the raw material suppliers, distributors and the manufacturers is performed on a regular basis, this helps in the comprehensive understanding of the products value chain. Apart from the above mentioned sources the data is also collected from the industry consultants to ensure the objective of the study is in the right direction.
Market trends such as technological advancements, regulatory affairs, market dynamics (Drivers, Restraints, Opportunities and Challenges) are obtained from scientific journals, market related national & international associations and organizations.
Data Analysis
From the data that is collected depending on the scope & objective of the research the data is subjected for the analysis. The critical steps that we follow for the data analysis include:
- Product Lifecycle Analysis
- Competitor analysis
- Risk analysis
- Porters Analysis
- PESTEL Analysis
- SWOT Analysis
The data engineering is performed by the core industry experts considering both the Marketing Mix Modeling and the Demand Forecasting. The marketing mix modeling makes use of multiple-regression techniques to predict the optimal mix of marketing variables. Regression factor is based on a number of variables and how they relate to an outcome such as sales or profits.
Data Validation
The data validation is performed by the exhaustive primary research from the expert interviews. This includes telephonic interviews, focus groups, face to face interviews, and questionnaires to validate our research from all aspects. The industry experts we approach come from the leading firms, involved in the supply chain ranging from the suppliers, distributors to the manufacturers and consumers so as to ensure an unbiased analysis.
We are in touch with more than 15,000 industry experts with the right mix of consultants, CEO's, presidents, vice presidents, managers, experts from both supply side and demand side, executives and so on.
The data validation involves the primary research from the industry experts belonging to:
- Leading Companies
- Suppliers & Distributors
- Manufacturers
- Consumers
- Industry/Strategic Consultants
Apart from the data validation the primary research also helps in performing the fill gap research, i.e. providing solutions for the unmet needs of the research which helps in enhancing the reports quality.
For more details about research methodology, kindly write to us at info@strategymrc.com
Frequently Asked Questions
In case of any queries regarding this report, you can contact the customer service by filing the “Inquiry Before Buy” form available on the right hand side. You may also contact us through email: info@strategymrc.com or phone: +1-301-202-5929
Yes, the samples are available for all the published reports. You can request them by filling the “Request Sample” option available in this page.
Yes, you can request a sample with your specific requirements. All the customized samples will be provided as per the requirement with the real data masked.
All our reports are available in Digital PDF format. In case if you require them in any other formats, such as PPT, Excel etc you can submit a request through “Inquiry Before Buy” form available on the right hand side. You may also contact us through email: info@strategymrc.com or phone: +1-301-202-5929
We offer a free 15% customization with every purchase. This requirement can be fulfilled for both pre and post sale. You may send your customization requirements through email at info@strategymrc.com or call us on +1-301-202-5929.
We have 3 different licensing options available in electronic format.
- Single User Licence: Allows one person, typically the buyer, to have access to the ordered product. The ordered product cannot be distributed to anyone else.
- 2-5 User Licence: Allows the ordered product to be shared among a maximum of 5 people within your organisation.
- Corporate License: Allows the product to be shared among all employees of your organisation regardless of their geographical location.
All our reports are typically be emailed to you as an attachment.
To order any available report you need to register on our website. The payment can be made either through CCAvenue or PayPal payments gateways which accept all international cards.
We extend our support to 6 months post sale. A post sale customization is also provided to cover your unmet needs in the report.
Request Customization
We offer complimentary customization of up to 15% with every purchase. To share your customization requirements, feel free to email us at info@strategymrc.com or call us on +1-301-202-5929. .
Please Note: Customization within the 15% threshold is entirely free of charge. If your request exceeds this limit, we will conduct a feasibility assessment. Following that, a detailed quote and timeline will be provided.
WHY CHOOSE US ?

Assured Quality
Best in class reports with high standard of research integrity

24X7 Research Support
Continuous support to ensure the best customer experience.

Free Customization
Adding more values to your product of interest.

Safe & Secure Access
Providing a secured environment for all online transactions.

Trusted by 600+ Brands
Serving the most reputed brands across the world.