
Telecom Api Market
Telecom API Market Forecasts to 2028 - Global Analysis By Service Type (Identity Management API, Messaging API, Maps and Location API, Voice/Speech API, Payment API, WebRTC (Real-Time Connection) API and Other Service Types), End User (Internal Telecom Developer, Long Tail Developer, Partner Developer, Enterprise Developer and Other End Users) and By Geography

|
Years Covered |
2020-2028 |
|
Estimated Year Value (2022) |
US $270 BN |
|
Projected Year Value (2028) |
US $899 BN |
|
CAGR (2022 - 2028) |
22.1% |
|
Regions Covered |
North America, Europe, Asia Pacific, South America, and Middle East & Africa |
|
Countries Covered |
US, Canada, Mexico, Germany, UK, Italy, France, Spain, Japan, China, India, Australia, New Zealand, South Korea, Rest of Asia Pacific, South America, Argentina, Brazil, Chile, Middle East & Africa, Saudi Arabia, UAE, Qatar, and South Africa |
|
Largest Market |
Asia Pacific |
|
Highest Growing Market |
North America |
According to Stratistics MRC, the Global Telecom API Market is accounted for $270 billion in 2022 and is expected to reach $899 billion by 2028 growing at a CAGR of 22.1% during the forecast period. Application Programming Interface (API) is an ancient term that describes a set of standard software functions that an application can use. The API forms the interface between the resources and the application in the device. It can also be called middleware. IT is used to develop applications and services independently of the underlying device it will run on. Often such APIs were highly complicated and not used for broad consumption.
According to Global System for Mobile Communications Association (GSMA), 5G connections are expected to reach 1.8 billion. According to GSMA data, 5.2 billion people enrolled in mobile services by the end of 2021, with 5.7 billion expected by 2025, creating additional prospects for telecom API in mobile-based services.
Market Dynamics:
Driver:
Increasing network access to the 4G LTE network
4G LTE offers high-bandwidth internet connectivity for uninterrupted audio and video streaming. Furthermore, it provides voice over LTE (VoLTE) based on IP multimedia systems thereby allowing high-clarity voice. It eliminates the need for separate networks for voice and data for a given telecom tower. VoLTE can be deployed with RCS and video calls over LTE, facilitating MMS, chat, file sharing, and video transfer. Thus, these factors are expected to impel the market growth.
Restraint:
The penetration of over-the-top (OTT) services
Over the top service refers to services like audio, video, and other data through the internet independent of telecom carriers. OTT service providers can generate additional revenues depending upon the service provided. Introduction of Voice over Internet Protocol is decreasing the demand for voice-based services provided by telecom carriers. The amount of revenue generated from telecom carrier services is declining, owing to the presence of OTT services. Hence, these factors are expected to restrain growth of the market during the forecast period.
Opportunity:
Rising propagation of mobile internet
Rising adoption of mobile internet and cloud technologies is expected to boost the use of the mobile application in the near future. Because of their single point of interaction between multiple nodes in the network, telecom APIs can enable IoT solutions that are end-to-end. The third-party service provider is no longer required to integrate systems. IoT penetration will drive an explosion in demand for telecom APIs. Hence, these factors are expected to drive growth of the market during the forecast period.
Threat:
Implementing open telecom API
A large number of telecom carriers are increasing including telecom API services in their portfolio. However, very few telecom carriers are opening up their telecom platform to external developers. Most telecom carriers consider application developers as value-added resellers and provide a business model that exposes less of the platform to the developer. This restricts the possibilities for innovation in platforms and developers are not able to create applications using this. Hence, these factors are expected to hamper the global telecom API market growth over the forecast period.
Covid-19 Impact
The telecom API is used to create compatible applications for multiple devices under a particular network. The telecom API’s offers Customer Service Point (CSPs) to integrate features like real-time communications, messaging, payment options and many more. There are several countries who have imposed lockdown due to the COVID-19 pandemic. Owing to this, companies are conducting meetings on online platforms and also increased spending on IT infrastructure due to government rules and regulations. The increasing spending on IT infrastructure is expected to drive the growth of the given market during the forecast period.
The messaging APIs segment is expected to be the largest during the forecast period
The messaging APIs segment is estimated to have a lucrative growth, due to increasing number of companies are utilizing SMS services for personalized marketing efforts and enhancing customer engagement and experience. It helps in sending trigger transaction updates, bulk SMS offers, and OTPs. Also, helps in receiving inbound SMS and managing contacts. Rich Communication Services improves messaging functionality which includes text messages along with pictures, group chat, location sharing, and video calls. Thus, these are propelling the demand for the segment.
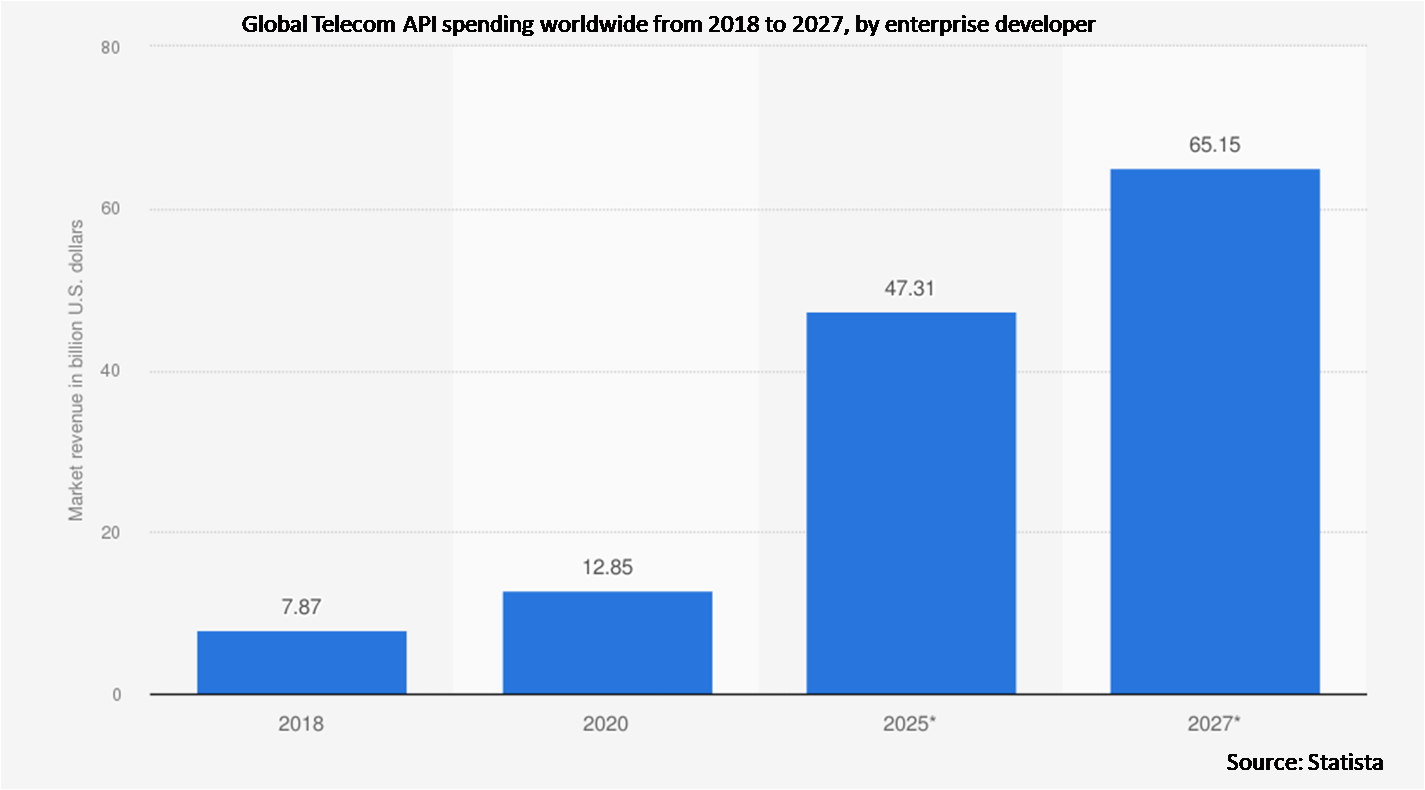
The enterprise developers segment is expected to have the highest CAGR during the forecast period
The enterprise developers segment is anticipated to witness the fastest CAGR growth during the forecast period, due to the increasing usage of A2P messaging tools in large-scale firms to introduce sales, offers, promotional activities, and other change in policies. The partner APIs help in building the data-sharing platforms among the telecommunication service suppliers and the other developers to enhance their payment and streaming services.
Region with highest share:
Asia Pacific is projected to hold the largest market share during the forecast period owing to the increasing number of mobile subscribers in the region and the increasing adoption of 5G technologies in the near future. With the rising penetration of internet services and mobile applications, the market here is expected to expand substantially. Thus, these are the factors improving the growth of the region.
Region with highest CAGR:
North America is projected to have the highest CAGR over the forecast period, owing to the presence of several key global companies. The integration of 4G and 5G technology with APIs enables communication services like video and also voice calls, as well as speech & video integration services, to be delivered efficiently, increasing business productivity. Factors such as high adoption of 4G technology and rising number of smartphones users in this region is majorly contributing to the regional market growth.

Key players in the market
Some of the key players profiled in the Telecom API Market include Vodafone, Google, LLC, Nokia Corporation, Orange S.A, Tropo, Inc, AT&T Inc., LocationSmart, Xura, Infobip Ltd, Verizon Communication, Alcatel-Lucent Enterprise, Nexmo, Aspect Software, Twilio Inc., Telefonica SA, Apigee, Huawei Technologies Co., Ltd, Ribbon Communications, Bharati Airtel Limited and MessageBird BV.
Key Developments:
In March 2020, Google, LLC collaborated with AT&T Inc. to develop 5G edge computing solutions. The company recently invested in launching Anthos for telecom to deliver an open platform that spans multi-cloud and edge.
In February 2019, Twilio, Inc. acquired SendGrid, Inc., an email API platform company for US$ 2 Bn, to increase its customer base and product offering. Through this acquisition, Twillo, Inc. is now able to use SendGrid’s communication platforms such as voice, messaging, video, and email.
Service Types Covered:
• Identity Management API
• Messaging API
• Maps and Location API
• Voice/Speech API
• Payment API
• WebRTC (Real-Time Connection) API
• Other Service Types
End Users Covered:
• Internal Telecom Developer
• Long Tail Developer
• Partner Developer
• Enterprise Developer
• Other End Users
Regions Covered:
• North America
o US
o Canada
o Mexico
• Europe
o Germany
o UK
o Italy
o France
o Spain
o Rest of Europe
• Asia Pacific
o Japan
o China
o India
o Australia
o New Zealand
o South Korea
o Rest of Asia Pacific
• South America
o Argentina
o Brazil
o Chile
o Rest of South America
• Middle East & Africa
o Saudi Arabia
o UAE
o Qatar
o South Africa
o Rest of Middle East & Africa
What our report offers:
- Market share assessments for the regional and country-level segments
- Strategic recommendations for the new entrants
- Covers Market data for the years 2020, 2021, 2022, 2025, and 2028
- Market Trends (Drivers, Constraints, Opportunities, Threats, Challenges, Investment Opportunities, and recommendations)
- Strategic recommendations in key business segments based on the market estimations
- Competitive landscaping mapping the key common trends
- Company profiling with detailed strategies, financials, and recent developments
- Supply chain trends mapping the latest technological advancements
Free Customization Offerings:
All the customers of this report will be entitled to receive one of the following free customization options:
• Company Profiling
o Comprehensive profiling of additional market players (up to 3)
o SWOT Analysis of key players (up to 3)
• Regional Segmentation
o Market estimations, Forecasts and CAGR of any prominent country as per the client's interest (Note: Depends on feasibility check)
• Competitive Benchmarking
Benchmarking of key players based on product portfolio, geographical presence, and strategic alliances
Table of Contents
1 Executive Summary
2 Preface
2.1 Abstract
2.2 Stake Holders
2.3 Research Scope
2.4 Research Methodology
2.4.1 Data Mining
2.4.2 Data Analysis
2.4.3 Data Validation
2.4.4 Research Approach
2.5 Research Sources
2.5.1 Primary Research Sources
2.5.2 Secondary Research Sources
2.5.3 Assumptions
3 Market Trend Analysis
3.1 Introduction
3.2 Drivers
3.3 Restraints
3.4 Opportunities
3.5 Threats
3.6 End User Analysis
3.7 Emerging Markets
3.8 Impact of Covid-19
4 Porters Five Force Analysis
4.1 Bargaining power of suppliers
4.2 Bargaining power of buyers
4.3 Threat of substitutes
4.4 Threat of new entrants
4.5 Competitive rivalry
5 Global Telecom API Market, By Service Type
5.1 Introduction
5.2 Identity Management API
5.3 Messaging API
5.4 Maps and Location API
5.5 Voice/Speech API
5.6 Payment API
5.7 WebRTC (Real-Time Connection) API
5.8 Other Service Types
6 Global Telecom API Market, By End User
6.1 Introduction
6.2 Internal Telecom Developer
6.3 Long Tail Developer
6.4 Partner Developer
6.5 Enterprise Developer
6.6 Other End Users
7 Global Telecom API Market, By Geography
7.1 Introduction
7.2 North America
7.2.1 US
7.2.2 Canada
7.2.3 Mexico
7.3 Europe
7.3.1 Germany
7.3.2 UK
7.3.3 Italy
7.3.4 France
7.3.5 Spain
7.3.6 Rest of Europe
7.4 Asia Pacific
7.4.1 Japan
7.4.2 China
7.4.3 India
7.4.4 Australia
7.4.5 New Zealand
7.4.6 South Korea
7.4.7 Rest of Asia Pacific
7.5 South America
7.5.1 Argentina
7.5.2 Brazil
7.5.3 Chile
7.5.4 Rest of South America
7.6 Middle East & Africa
7.6.1 Saudi Arabia
7.6.2 UAE
7.6.3 Qatar
7.6.4 South Africa
7.6.5 Rest of Middle East & Africa
8 Key Developments
8.1 Agreements, Partnerships, Collaborations and Joint Ventures
8.2 Acquisitions & Mergers
8.3 New Product Launch
8.4 Expansions
8.5 Other Key Strategies
9 Company Profiling
9.1 Vodafone
9.2 Google, LLC
9.3 Nokia Corporation
9.4 Orange S.A
9.5 Tropo, Inc
9.6 AT&T Inc.
9.7 LocationSmart
9.8 Xura
9.9 Infobip Ltd
9.10 Verizon Communication
9.11 Alcatel-Lucent Enterprise
9.12 Nexmo
9.13 Aspect Software
9.14 Twilio Inc.
9.15 Telefonica SA
9.16 Apigee
9.17 Huawei Technologies Co., Ltd
9.18 Ribbon Communications
9.19 Bharati Airtel Limited
9.20 MessageBird BV
List of Tables
1 Global Telecom API Market Outlook, By Region (2020-2028) ($MN)
2 Global Telecom API Market Outlook, By Service Type (2020-2028) ($MN)
3 Global Telecom API Market Outlook, By Identity Management API (2020-2028) ($MN)
4 Global Telecom API Market Outlook, By Messaging API (2020-2028) ($MN)
5 Global Telecom API Market Outlook, By Maps and Location API (2020-2028) ($MN)
6 Global Telecom API Market Outlook, By Voice/Speech API (2020-2028) ($MN)
7 Global Telecom API Market Outlook, By Payment API (2020-2028) ($MN)
8 Global Telecom API Market Outlook, By WebRTC (Real-Time Connection) API (2020-2028) ($MN)
9 Global Telecom API Market Outlook, By Other Service Types (2020-2028) ($MN)
10 Global Telecom API Market Outlook, By End User (2020-2028) ($MN)
11 Global Telecom API Market Outlook, By Internal Telecom Developer (2020-2028) ($MN)
12 Global Telecom API Market Outlook, By Long Tail Developer (2020-2028) ($MN)
13 Global Telecom API Market Outlook, By Partner Developer (2020-2028) ($MN)
14 Global Telecom API Market Outlook, By Enterprise Developer (2020-2028) ($MN)
15 Global Telecom API Market Outlook, By Other End Users (2020-2028) ($MN)
16 North America Telecom API Market Outlook, By Country (2020-2028) ($MN)
17 North America Telecom API Market Outlook, By Service Type (2020-2028) ($MN)
18 North America Telecom API Market Outlook, By Identity Management API (2020-2028) ($MN)
19 North America Telecom API Market Outlook, By Messaging API (2020-2028) ($MN)
20 North America Telecom API Market Outlook, By Maps and Location API (2020-2028) ($MN)
21 North America Telecom API Market Outlook, By Voice/Speech API (2020-2028) ($MN)
22 North America Telecom API Market Outlook, By Payment API (2020-2028) ($MN)
23 North America Telecom API Market Outlook, By WebRTC (Real-Time Connection) API (2020-2028) ($MN)
24 North America Telecom API Market Outlook, By Other Service Types (2020-2028) ($MN)
25 North America Telecom API Market Outlook, By End User (2020-2028) ($MN)
26 North America Telecom API Market Outlook, By Internal Telecom Developer (2020-2028) ($MN)
27 North America Telecom API Market Outlook, By Long Tail Developer (2020-2028) ($MN)
28 North America Telecom API Market Outlook, By Partner Developer (2020-2028) ($MN)
29 North America Telecom API Market Outlook, By Enterprise Developer (2020-2028) ($MN)
30 North America Telecom API Market Outlook, By Other End Users (2020-2028) ($MN)
31 Europe Telecom API Market Outlook, By Country (2020-2028) ($MN)
32 Europe Telecom API Market Outlook, By Service Type (2020-2028) ($MN)
33 Europe Telecom API Market Outlook, By Identity Management API (2020-2028) ($MN)
34 Europe Telecom API Market Outlook, By Messaging API (2020-2028) ($MN)
35 Europe Telecom API Market Outlook, By Maps and Location API (2020-2028) ($MN)
36 Europe Telecom API Market Outlook, By Voice/Speech API (2020-2028) ($MN)
37 Europe Telecom API Market Outlook, By Payment API (2020-2028) ($MN)
38 Europe Telecom API Market Outlook, By WebRTC (Real-Time Connection) API (2020-2028) ($MN)
39 Europe Telecom API Market Outlook, By Other Service Types (2020-2028) ($MN)
40 Europe Telecom API Market Outlook, By End User (2020-2028) ($MN)
41 Europe Telecom API Market Outlook, By Internal Telecom Developer (2020-2028) ($MN)
42 Europe Telecom API Market Outlook, By Long Tail Developer (2020-2028) ($MN)
43 Europe Telecom API Market Outlook, By Partner Developer (2020-2028) ($MN)
44 Europe Telecom API Market Outlook, By Enterprise Developer (2020-2028) ($MN)
45 Europe Telecom API Market Outlook, By Other End Users (2020-2028) ($MN)
46 Asia Pacific Telecom API Market Outlook, By Country (2020-2028) ($MN)
47 Asia Pacific Telecom API Market Outlook, By Service Type (2020-2028) ($MN)
48 Asia Pacific Telecom API Market Outlook, By Identity Management API (2020-2028) ($MN)
49 Asia Pacific Telecom API Market Outlook, By Messaging API (2020-2028) ($MN)
50 Asia Pacific Telecom API Market Outlook, By Maps and Location API (2020-2028) ($MN)
51 Asia Pacific Telecom API Market Outlook, By Voice/Speech API (2020-2028) ($MN)
52 Asia Pacific Telecom API Market Outlook, By Payment API (2020-2028) ($MN)
53 Asia Pacific Telecom API Market Outlook, By WebRTC (Real-Time Connection) API (2020-2028) ($MN)
54 Asia Pacific Telecom API Market Outlook, By Other Service Types (2020-2028) ($MN)
55 Asia Pacific Telecom API Market Outlook, By End User (2020-2028) ($MN)
56 Asia Pacific Telecom API Market Outlook, By Internal Telecom Developer (2020-2028) ($MN)
57 Asia Pacific Telecom API Market Outlook, By Long Tail Developer (2020-2028) ($MN)
58 Asia Pacific Telecom API Market Outlook, By Partner Developer (2020-2028) ($MN)
59 Asia Pacific Telecom API Market Outlook, By Enterprise Developer (2020-2028) ($MN)
60 Asia Pacific Telecom API Market Outlook, By Other End Users (2020-2028) ($MN)
61 South America Telecom API Market Outlook, By Country (2020-2028) ($MN)
62 South America Telecom API Market Outlook, By Service Type (2020-2028) ($MN)
63 South America Telecom API Market Outlook, By Identity Management API (2020-2028) ($MN)
64 South America Telecom API Market Outlook, By Messaging API (2020-2028) ($MN)
65 South America Telecom API Market Outlook, By Maps and Location API (2020-2028) ($MN)
66 South America Telecom API Market Outlook, By Voice/Speech API (2020-2028) ($MN)
67 South America Telecom API Market Outlook, By Payment API (2020-2028) ($MN)
68 South America Telecom API Market Outlook, By WebRTC (Real-Time Connection) API (2020-2028) ($MN)
69 South America Telecom API Market Outlook, By Other Service Types (2020-2028) ($MN)
70 South America Telecom API Market Outlook, By End User (2020-2028) ($MN)
71 South America Telecom API Market Outlook, By Internal Telecom Developer (2020-2028) ($MN)
72 South America Telecom API Market Outlook, By Long Tail Developer (2020-2028) ($MN)
73 South America Telecom API Market Outlook, By Partner Developer (2020-2028) ($MN)
74 South America Telecom API Market Outlook, By Enterprise Developer (2020-2028) ($MN)
75 South America Telecom API Market Outlook, By Other End Users (2020-2028) ($MN)
76 Middle East & Africa Telecom API Market Outlook, By Country (2020-2028) ($MN)
77 Middle East & Africa Telecom API Market Outlook, By Service Type (2020-2028) ($MN)
78 Middle East & Africa Telecom API Market Outlook, By Identity Management API (2020-2028) ($MN)
79 Middle East & Africa Telecom API Market Outlook, By Messaging API (2020-2028) ($MN)
80 Middle East & Africa Telecom API Market Outlook, By Maps and Location API (2020-2028) ($MN)
81 Middle East & Africa Telecom API Market Outlook, By Voice/Speech API (2020-2028) ($MN)
82 Middle East & Africa Telecom API Market Outlook, By Payment API (2020-2028) ($MN)
83 Middle East & Africa Telecom API Market Outlook, By WebRTC (Real-Time Connection) API (2020-2028) ($MN)
84 Middle East & Africa Telecom API Market Outlook, By Other Service Types (2020-2028) ($MN)
85 Middle East & Africa Telecom API Market Outlook, By End User (2020-2028) ($MN)
86 Middle East & Africa Telecom API Market Outlook, By Internal Telecom Developer (2020-2028) ($MN)
87 Middle East & Africa Telecom API Market Outlook, By Long Tail Developer (2020-2028) ($MN)
88 Middle East & Africa Telecom API Market Outlook, By Partner Developer (2020-2028) ($MN)
89 Middle East & Africa Telecom API Market Outlook, By Enterprise Developer (2020-2028) ($MN)
90 Middle East & Africa Telecom API Market Outlook, By Other End Users (2020-2028) ($MN)
List of Figures
RESEARCH METHODOLOGY

We at ‘Stratistics’ opt for an extensive research approach which involves data mining, data validation, and data analysis. The various research sources include in-house repository, secondary research, competitor’s sources, social media research, client internal data, and primary research.
Our team of analysts prefers the most reliable and authenticated data sources in order to perform the comprehensive literature search. With access to most of the authenticated data bases our team highly considers the best mix of information through various sources to obtain extensive and accurate analysis.
Each report takes an average time of a month and a team of 4 industry analysts. The time may vary depending on the scope and data availability of the desired market report. The various parameters used in the market assessment are standardized in order to enhance the data accuracy.
Data Mining
The data is collected from several authenticated, reliable, paid and unpaid sources and is filtered depending on the scope & objective of the research. Our reports repository acts as an added advantage in this procedure. Data gathering from the raw material suppliers, distributors and the manufacturers is performed on a regular basis, this helps in the comprehensive understanding of the products value chain. Apart from the above mentioned sources the data is also collected from the industry consultants to ensure the objective of the study is in the right direction.
Market trends such as technological advancements, regulatory affairs, market dynamics (Drivers, Restraints, Opportunities and Challenges) are obtained from scientific journals, market related national & international associations and organizations.
Data Analysis
From the data that is collected depending on the scope & objective of the research the data is subjected for the analysis. The critical steps that we follow for the data analysis include:
- Product Lifecycle Analysis
- Competitor analysis
- Risk analysis
- Porters Analysis
- PESTEL Analysis
- SWOT Analysis
The data engineering is performed by the core industry experts considering both the Marketing Mix Modeling and the Demand Forecasting. The marketing mix modeling makes use of multiple-regression techniques to predict the optimal mix of marketing variables. Regression factor is based on a number of variables and how they relate to an outcome such as sales or profits.
Data Validation
The data validation is performed by the exhaustive primary research from the expert interviews. This includes telephonic interviews, focus groups, face to face interviews, and questionnaires to validate our research from all aspects. The industry experts we approach come from the leading firms, involved in the supply chain ranging from the suppliers, distributors to the manufacturers and consumers so as to ensure an unbiased analysis.
We are in touch with more than 15,000 industry experts with the right mix of consultants, CEO's, presidents, vice presidents, managers, experts from both supply side and demand side, executives and so on.
The data validation involves the primary research from the industry experts belonging to:
- Leading Companies
- Suppliers & Distributors
- Manufacturers
- Consumers
- Industry/Strategic Consultants
Apart from the data validation the primary research also helps in performing the fill gap research, i.e. providing solutions for the unmet needs of the research which helps in enhancing the reports quality.
For more details about research methodology, kindly write to us at info@strategymrc.com
Frequently Asked Questions
In case of any queries regarding this report, you can contact the customer service by filing the “Inquiry Before Buy” form available on the right hand side. You may also contact us through email: info@strategymrc.com or phone: +1-301-202-5929
Yes, the samples are available for all the published reports. You can request them by filling the “Request Sample” option available in this page.
Yes, you can request a sample with your specific requirements. All the customized samples will be provided as per the requirement with the real data masked.
All our reports are available in Digital PDF format. In case if you require them in any other formats, such as PPT, Excel etc you can submit a request through “Inquiry Before Buy” form available on the right hand side. You may also contact us through email: info@strategymrc.com or phone: +1-301-202-5929
We offer a free 15% customization with every purchase. This requirement can be fulfilled for both pre and post sale. You may send your customization requirements through email at info@strategymrc.com or call us on +1-301-202-5929.
We have 3 different licensing options available in electronic format.
- Single User Licence: Allows one person, typically the buyer, to have access to the ordered product. The ordered product cannot be distributed to anyone else.
- 2-5 User Licence: Allows the ordered product to be shared among a maximum of 5 people within your organisation.
- Corporate License: Allows the product to be shared among all employees of your organisation regardless of their geographical location.
All our reports are typically be emailed to you as an attachment.
To order any available report you need to register on our website. The payment can be made either through CCAvenue or PayPal payments gateways which accept all international cards.
We extend our support to 6 months post sale. A post sale customization is also provided to cover your unmet needs in the report.
Request Customization
We offer complimentary customization of up to 15% with every purchase. To share your customization requirements, feel free to email us at info@strategymrc.com or call us on +1-301-202-5929. .
Please Note: Customization within the 15% threshold is entirely free of charge. If your request exceeds this limit, we will conduct a feasibility assessment. Following that, a detailed quote and timeline will be provided.
WHY CHOOSE US ?

Assured Quality
Best in class reports with high standard of research integrity

24X7 Research Support
Continuous support to ensure the best customer experience.

Free Customization
Adding more values to your product of interest.

Safe & Secure Access
Providing a secured environment for all online transactions.

Trusted by 600+ Brands
Serving the most reputed brands across the world.