
Used Tractors Market
Used Tractors Market Forecasts to 2032 - Global Analysis By Type (Farm Tractors, Utility Tractors, Construction Tractors and Garden Tractors), Drive Type (Two-Wheel Drive (2WD) and Four-Wheel Drive (4WD/MFWD)), Horsepower (HP), Engine, Sales Channel, Application and By Geography

|
Years Covered |
2024-2032 |
|
Estimated Year Value (2025) |
US $35.4 BN |
|
Projected Year Value (2032) |
US $50.1 BN |
|
CAGR (2025-2032) |
5.1% |
|
Regions Covered |
North America, Europe, Asia Pacific, South America, and Middle East & Africa |
|
Countries Covered |
US, Canada, Mexico, Germany, UK, Italy, France, Spain, Japan, China, India, Australia, New Zealand, South Korea, Rest of Asia Pacific, South America, Argentina, Brazil, Chile, Middle East & Africa, Saudi Arabia, UAE, Qatar, and South Africa |
|
Largest Market |
North America |
|
Highest Growing Market |
Asia Pacific |
According to Stratistics MRC, the Global Used Tractors Market is accounted for $35.4 billion in 2025 and is expected to reach $50.1 billion by 2032 growing at a CAGR of 5.1% during the forecast period. Pre-owned tractors are agricultural vehicles that have been previously operated and are available for resale. These machines differ in age, condition, and performance, presenting an economical alternative to new models. Buyers evaluate aspects such as engine capability, maintenance records, and overall durability before making a purchase. The secondary market offers both refurbished and well-used units with varying degrees of wear. Thorough assessment ensures dependability, enhancing farming efficiency while minimizing investment costs for farmers and agricultural enterprises.
According to CEMA, the European Agricultural Machinery Association, tractor registrations across 30 European countries decreased by 4.9% in 2023.
Market Dynamics:
Driver:
Rising demand for higher productivity and efficiency in farming
Farmers seek cost-effective solutions to optimize operations, making pre-owned machinery an attractive choice. Technological advancements in farming equipment improve fuel efficiency and durability, extending the usability of used tractors. Additionally, increasing mechanization in emerging economies is creating a significant market for second-hand agricultural vehicles. As sustainability gains traction, repurposing used machinery aligns with economic and environmental considerations.
Restraint:
Unfavorable weather conditions & fragmented land holdings
Frequent droughts, floods, and soil degradation affect machinery demand, as farmers hesitate to invest in additional equipment. Small-scale farms often face financial constraints, limiting their ability to purchase and maintain tractors. Moreover, regional variations in farming practices result in inconsistent adoption rates of used agricultural vehicles. The availability of diverse tractor models with varying specifications further complicates purchasing decisions for buyers.
Opportunity:
Fluctuating raw material and commodity prices
Inflation in production costs makes new agricultural equipment less affordable, increasing the appeal of pre-owned machinery. The growing emphasis on sustainable practices is driving interest in refurbished tractors, promoting circular economy models. Additionally, government incentives encouraging farm mechanization in developing regions support the expansion of the used tractor industry. With digital platforms streamlining transactions, buyers can access a wider range of second-hand tractor listings.
Threat:
Environmental and climate challenges
Rising global temperatures, soil erosion, and unpredictable rainfall patterns hinder farming productivity, reducing the need for additional equipment. Regulatory frameworks aimed at lowering emissions and promoting eco-friendly technologies may limit the resale potential of older tractor models. Moreover, the increasing availability of autonomous and AI-powered machinery presents competition for conventional used tractors.
Covid-19 Impact:
The pandemic affected the used tractor market in multiple ways, disrupting supply chains while shifting consumer priorities. Initial lockdown measures slowed dealership operations, limiting access to second-hand machinery and delaying transactions. However, as economic uncertainty grew, farmers leaned towards cost-effective solutions, boosting demand for used tractors. Additionally, digitalization gained momentum, enabling online platforms to facilitate remote tractor purchases and sales.
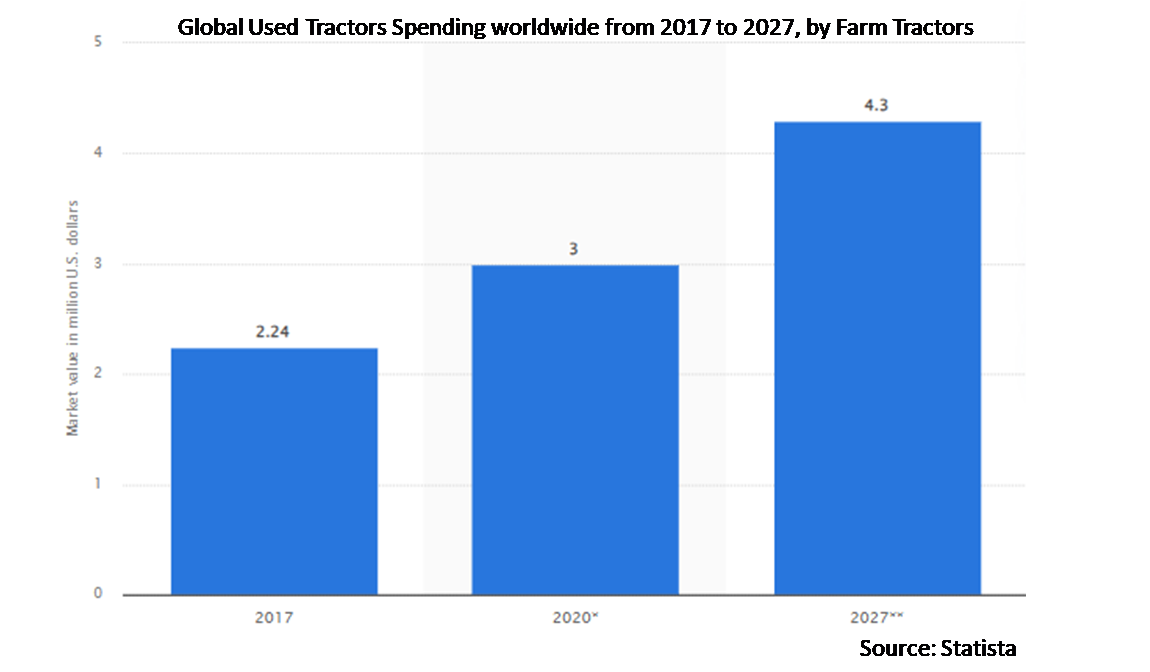
The farm tractors segment is expected to be the largest during the forecast period
The farm tractors segment is expected to account for the largest market share during the forecast period due to their widespread application in agricultural activities. Farmers prioritize reliable and versatile machinery capable of handling diverse tasks, making farm tractors a preferred choice. Enhanced durability and adaptability to different terrains further contribute to their market dominance. Cost-conscious farmers seeking reliable machinery at reduced investment costs further bolster market demand.
The diesel engine segment is expected to have the highest CAGR during the forecast period
Over the forecast period, the diesel engine segment is predicted to witness the highest growth rate driven by its efficiency and power output. Diesel engines are preferred for agricultural applications due to their ability to sustain high-performance levels under heavy workloads. Additionally, technological innovations in fuel efficiency and emissions reduction are enhancing the viability of diesel-powered tractors. As farmers seek high-performing machinery that balances cost and productivity, demand for used diesel-engine tractors remains strong.
Region with largest share:
During the forecast period, the North America region is expected to hold the largest market share attributed to its well-established agricultural infrastructure. High adoption rates of mechanized farming, coupled with strong dealership networks, support secondary sales in the region. Farmers in North America prioritize reliability and advanced functionality, making high-quality refurbished tractors a lucrative market growth.
Region with highest CAGR:
Over the forecast period, the Asia Pacific region is anticipated to exhibit the highest CAGR fueled by growing mechanization efforts and increasing investments in the agricultural sector. Rising demand for affordable farming equipment in countries such as India and China is stimulating growth in the used tractor market. Government initiatives aimed at enhancing agricultural productivity and providing financial assistance for equipment purchases are encouraging adoption.

Key players in the market
Some of the key players in Used Tractors Market include TractorGyan, Farmkart, Tractor Junction, TAFE (Tractors and Farm Equipment Ltd.), Sonalika Tractors, SAS Motors (Angad Tractors), Mitsubishi Mahindra Agricultural Machiner Inc, Mahindra Tractors, Kubota India, John Deere India Pvt. Ltd., Force Motors, Tractor Kharido, Escorts Kubota Limited, Captain Tractors Pvt. Ltd. and Action Construction Equipment Ltd. (ACE).
Key Developments:
In April 2025, TAFE (Tractors and Farm Equipment Ltd.) launched the MF 7235 DI tractor in Bihar, Jharkhand, and Haryana, targeting haulage and commercial segments. This model aims to address customer concerns with enhanced performance and reliability.
In April 2025, Mahindra's Farm Equipment Sector sold 38,516 tractor units in India, marking a significant achievement. This performance underscores Mahindra's leadership in the Indian tractor market.
In January 2025, John Deere unveiled new autonomous machines and technologies at CES 2025, aiming to support customers in agriculture and construction. The launch demonstrates John Deere's commitment to technological advancement.
Types Covered:
• Farm Tractors
• Utility Tractors
• Construction Tractors
• Garden Tractors
Drive Types Covered:
• Two-Wheel Drive (2WD)
• Four-Wheel Drive (4WD/MFWD)
Horsepowers (HP)s Covered:
• Below 30 HP
• 30-50 HP
• 51-100 HP
• Above 100 HP
Engines Covered:
• Diesel Engine
• Petrol Engine
• Other Engines
Sales Channels Covered:
• Dealerships
• Auctions
• Private Sales
• Online Platforms/E-commerce
Applications Covered:
• Agriculture
• Construction
• Landscaping
• Forestry
• Mining & Logistics
• Other Applications
Regions Covered:
• North America
o US
o Canada
o Mexico
• Europe
o Germany
o UK
o Italy
o France
o Spain
o Rest of Europe
• Asia Pacific
o Japan
o China
o India
o Australia
o New Zealand
o South Korea
o Rest of Asia Pacific
• South America
o Argentina
o Brazil
o Chile
o Rest of South America
• Middle East & Africa
o Saudi Arabia
o UAE
o Qatar
o South Africa
o Rest of Middle East & Africa
What our report offers:
- Market share assessments for the regional and country-level segments
- Strategic recommendations for the new entrants
- Covers Market data for the years 2024, 2025, 2026, 2028, and 2032
- Market Trends (Drivers, Constraints, Opportunities, Threats, Challenges, Investment Opportunities, and recommendations)
- Strategic recommendations in key business segments based on the market estimations
- Competitive landscaping mapping the key common trends
- Company profiling with detailed strategies, financials, and recent developments
- Supply chain trends mapping the latest technological advancements
Free Customization Offerings:
All the customers of this report will be entitled to receive one of the following free customization options:
• Company Profiling
o Comprehensive profiling of additional market players (up to 3)
o SWOT Analysis of key players (up to 3)
• Regional Segmentation
o Market estimations, Forecasts and CAGR of any prominent country as per the client's interest (Note: Depends on feasibility check)
• Competitive Benchmarking
o Benchmarking of key players based on product portfolio, geographical presence, and strategic alliances
Table of Contents
1 Executive Summary
2 Preface
2.1 Abstract
2.2 Stake Holders
2.3 Research Scope
2.4 Research Methodology
2.4.1 Data Mining
2.4.2 Data Analysis
2.4.3 Data Validation
2.4.4 Research Approach
2.5 Research Sources
2.5.1 Primary Research Sources
2.5.2 Secondary Research Sources
2.5.3 Assumptions
3 Market Trend Analysis
3.1 Introduction
3.2 Drivers
3.3 Restraints
3.4 Opportunities
3.5 Threats
3.6 Application Analysis
3.7 Emerging Markets
3.8 Impact of Covid-19
4 Porters Five Force Analysis
4.1 Bargaining power of suppliers
4.2 Bargaining power of buyers
4.3 Threat of substitutes
4.4 Threat of new entrants
4.5 Competitive rivalry
5 Global Used Tractors Market, By Type
5.1 Introduction
5.2 Farm Tractors
5.3 Utility Tractors
5.4 Construction Tractors
5.5 Garden Tractors
6 Global Used Tractors Market, By Drive Type
6.1 Introduction
6.2 Two-Wheel Drive (2WD)
6.3 Four-Wheel Drive (4WD/MFWD)
7 Global Used Tractors Market, By Horsepower (HP)
7.1 Introduction
7.2 Below 30 HP
7.3 30-50 HP
7.4 51-100 HP
7.5 Above 100 HP
8 Global Used Tractors Market, By Engine
8.1 Introduction
8.2 Diesel Engine
8.3 Petrol Engine
8.4 Other Engines
9 Global Used Tractors Market, By Sales Channel
9.1 Introduction
9.2 Dealerships
9.3 Auctions
9.4 Private Sales
9.5 Online Platforms/E-commerce
10 Global Used Tractors Market, By Application
10.1 Introduction
10.2 Agriculture
10.3 Construction
10.4 Landscaping
10.5 Forestry
10.6 Mining & Logistics
10.7 Other Applications
11 Global Used Tractors Market, By Geography
11.1 Introduction
11.2 North America
11.2.1 US
11.2.2 Canada
11.2.3 Mexico
11.3 Europe
11.3.1 Germany
11.3.2 UK
11.3.3 Italy
11.3.4 France
11.3.5 Spain
11.3.6 Rest of Europe
11.4 Asia Pacific
11.4.1 Japan
11.4.2 China
11.4.3 India
11.4.4 Australia
11.4.5 New Zealand
11.4.6 South Korea
11.4.7 Rest of Asia Pacific
11.5 South America
11.5.1 Argentina
11.5.2 Brazil
11.5.3 Chile
11.5.4 Rest of South America
11.6 Middle East & Africa
11.6.1 Saudi Arabia
11.6.2 UAE
11.6.3 Qatar
11.6.4 South Africa
11.6.5 Rest of Middle East & Africa
12 Key Developments
12.1 Agreements, Partnerships, Collaborations and Joint Ventures
12.2 Acquisitions & Mergers
12.3 New Product Launch
12.4 Expansions
12.5 Other Key Strategies
13 Company Profiling
13.1 TractorGyan
13.2 Farmkart
13.3 Tractor Junction
13.4 TAFE (Tractors and Farm Equipment Ltd.)
13.5 Sonalika Tractors
13.6 SAS Motors (Angad Tractors)
13.7 Mitsubishi Mahindra Agricultural Machiner
13.8 Mahindra Tractors
13.9 Kubota India
13.10 John Deere India Pvt. Ltd.
13.11 Force Motors
13.12 Tractor Kharido
13.13 Escorts Kubota Limited
13.14 Captain Tractors Pvt. Ltd.
13.15 Action Construction Equipment Ltd. (ACE)
List of Tables
1 Global Used Tractors Market Outlook, By Region (2024-2032) ($MN)
2 Global Used Tractors Market Outlook, By Type (2024-2032) ($MN)
3 Global Used Tractors Market Outlook, By Farm Tractors (2024-2032) ($MN)
4 Global Used Tractors Market Outlook, By Utility Tractors (2024-2032) ($MN)
5 Global Used Tractors Market Outlook, By Construction Tractors (2024-2032) ($MN)
6 Global Used Tractors Market Outlook, By Garden Tractors (2024-2032) ($MN)
7 Global Used Tractors Market Outlook, By Drive Type (2024-2032) ($MN)
8 Global Used Tractors Market Outlook, By Two-Wheel Drive (2WD) (2024-2032) ($MN)
9 Global Used Tractors Market Outlook, By Four-Wheel Drive (4WD/MFWD) (2024-2032) ($MN)
10 Global Used Tractors Market Outlook, By Horsepower (HP) (2024-2032) ($MN)
11 Global Used Tractors Market Outlook, By Below 30 HP (2024-2032) ($MN)
12 Global Used Tractors Market Outlook, By 30-50 HP (2024-2032) ($MN)
13 Global Used Tractors Market Outlook, By 51-100 HP (2024-2032) ($MN)
14 Global Used Tractors Market Outlook, By Above 100 HP (2024-2032) ($MN)
15 Global Used Tractors Market Outlook, By Engine (2024-2032) ($MN)
16 Global Used Tractors Market Outlook, By Diesel Engine (2024-2032) ($MN)
17 Global Used Tractors Market Outlook, By Petrol Engine (2024-2032) ($MN)
18 Global Used Tractors Market Outlook, By Other Engines (2024-2032) ($MN)
19 Global Used Tractors Market Outlook, By Sales Channel (2024-2032) ($MN)
20 Global Used Tractors Market Outlook, By Dealerships (2024-2032) ($MN)
21 Global Used Tractors Market Outlook, By Auctions (2024-2032) ($MN)
22 Global Used Tractors Market Outlook, By Private Sales (2024-2032) ($MN)
23 Global Used Tractors Market Outlook, By Online Platforms/E-commerce (2024-2032) ($MN)
24 Global Used Tractors Market Outlook, By Application (2024-2032) ($MN)
25 Global Used Tractors Market Outlook, By Agriculture (2024-2032) ($MN)
26 Global Used Tractors Market Outlook, By Construction (2024-2032) ($MN)
27 Global Used Tractors Market Outlook, By Landscaping (2024-2032) ($MN)
28 Global Used Tractors Market Outlook, By Forestry (2024-2032) ($MN)
29 Global Used Tractors Market Outlook, By Mining & Logistics (2024-2032) ($MN)
30 Global Used Tractors Market Outlook, By Other Applications (2024-2032) ($MN)
Note: Tables for North America, Europe, APAC, South America, and Middle East & Africa Regions are also represented in the same manner as above.
List of Figures
RESEARCH METHODOLOGY

We at ‘Stratistics’ opt for an extensive research approach which involves data mining, data validation, and data analysis. The various research sources include in-house repository, secondary research, competitor’s sources, social media research, client internal data, and primary research.
Our team of analysts prefers the most reliable and authenticated data sources in order to perform the comprehensive literature search. With access to most of the authenticated data bases our team highly considers the best mix of information through various sources to obtain extensive and accurate analysis.
Each report takes an average time of a month and a team of 4 industry analysts. The time may vary depending on the scope and data availability of the desired market report. The various parameters used in the market assessment are standardized in order to enhance the data accuracy.
Data Mining
The data is collected from several authenticated, reliable, paid and unpaid sources and is filtered depending on the scope & objective of the research. Our reports repository acts as an added advantage in this procedure. Data gathering from the raw material suppliers, distributors and the manufacturers is performed on a regular basis, this helps in the comprehensive understanding of the products value chain. Apart from the above mentioned sources the data is also collected from the industry consultants to ensure the objective of the study is in the right direction.
Market trends such as technological advancements, regulatory affairs, market dynamics (Drivers, Restraints, Opportunities and Challenges) are obtained from scientific journals, market related national & international associations and organizations.
Data Analysis
From the data that is collected depending on the scope & objective of the research the data is subjected for the analysis. The critical steps that we follow for the data analysis include:
- Product Lifecycle Analysis
- Competitor analysis
- Risk analysis
- Porters Analysis
- PESTEL Analysis
- SWOT Analysis
The data engineering is performed by the core industry experts considering both the Marketing Mix Modeling and the Demand Forecasting. The marketing mix modeling makes use of multiple-regression techniques to predict the optimal mix of marketing variables. Regression factor is based on a number of variables and how they relate to an outcome such as sales or profits.
Data Validation
The data validation is performed by the exhaustive primary research from the expert interviews. This includes telephonic interviews, focus groups, face to face interviews, and questionnaires to validate our research from all aspects. The industry experts we approach come from the leading firms, involved in the supply chain ranging from the suppliers, distributors to the manufacturers and consumers so as to ensure an unbiased analysis.
We are in touch with more than 15,000 industry experts with the right mix of consultants, CEO's, presidents, vice presidents, managers, experts from both supply side and demand side, executives and so on.
The data validation involves the primary research from the industry experts belonging to:
- Leading Companies
- Suppliers & Distributors
- Manufacturers
- Consumers
- Industry/Strategic Consultants
Apart from the data validation the primary research also helps in performing the fill gap research, i.e. providing solutions for the unmet needs of the research which helps in enhancing the reports quality.
For more details about research methodology, kindly write to us at info@strategymrc.com
Frequently Asked Questions
In case of any queries regarding this report, you can contact the customer service by filing the “Inquiry Before Buy” form available on the right hand side. You may also contact us through email: info@strategymrc.com or phone: +1-301-202-5929
Yes, the samples are available for all the published reports. You can request them by filling the “Request Sample” option available in this page.
Yes, you can request a sample with your specific requirements. All the customized samples will be provided as per the requirement with the real data masked.
All our reports are available in Digital PDF format. In case if you require them in any other formats, such as PPT, Excel etc you can submit a request through “Inquiry Before Buy” form available on the right hand side. You may also contact us through email: info@strategymrc.com or phone: +1-301-202-5929
We offer a free 15% customization with every purchase. This requirement can be fulfilled for both pre and post sale. You may send your customization requirements through email at info@strategymrc.com or call us on +1-301-202-5929.
We have 3 different licensing options available in electronic format.
- Single User Licence: Allows one person, typically the buyer, to have access to the ordered product. The ordered product cannot be distributed to anyone else.
- 2-5 User Licence: Allows the ordered product to be shared among a maximum of 5 people within your organisation.
- Corporate License: Allows the product to be shared among all employees of your organisation regardless of their geographical location.
All our reports are typically be emailed to you as an attachment.
To order any available report you need to register on our website. The payment can be made either through CCAvenue or PayPal payments gateways which accept all international cards.
We extend our support to 6 months post sale. A post sale customization is also provided to cover your unmet needs in the report.
Request Customization
We offer complimentary customization of up to 15% with every purchase. To share your customization requirements, feel free to email us at info@strategymrc.com or call us on +1-301-202-5929. .
Please Note: Customization within the 15% threshold is entirely free of charge. If your request exceeds this limit, we will conduct a feasibility assessment. Following that, a detailed quote and timeline will be provided.
WHY CHOOSE US ?

Assured Quality
Best in class reports with high standard of research integrity

24X7 Research Support
Continuous support to ensure the best customer experience.

Free Customization
Adding more values to your product of interest.

Safe & Secure Access
Providing a secured environment for all online transactions.

Trusted by 600+ Brands
Serving the most reputed brands across the world.