
Utility Communication Market
Utility Communication Market Forecasts to 2028 - Global Analysis By Technology (Wireless and Wired), Utility (Private and Public), Component (Software and Hardware), Application (Oil & Gas Utility, Transmission & Distribution and Other Applications), End User and Geography

|
Years Covered |
2020-2028 |
|
Estimated Year Value (2022) |
US $17.59 BN |
|
Projected Year Value (2028) |
US $45.37 BN |
|
CAGR (2022 - 2028) |
17.1% |
|
Regions Covered |
North America, Europe, Asia Pacific, South America, and Middle East & Africa |
|
Countries Covered |
US, Canada, Mexico, Germany, UK, Italy, France, Spain, Japan, China, India, Australia, New Zealand, South Korea, Rest of Asia Pacific, South America, Argentina, Brazil, Chile, Middle East & Africa, Saudi Arabia, UAE, Qatar, and South Africa |
|
Largest Market |
Asia Pacific |
|
Highest Growing Market |
Europe |
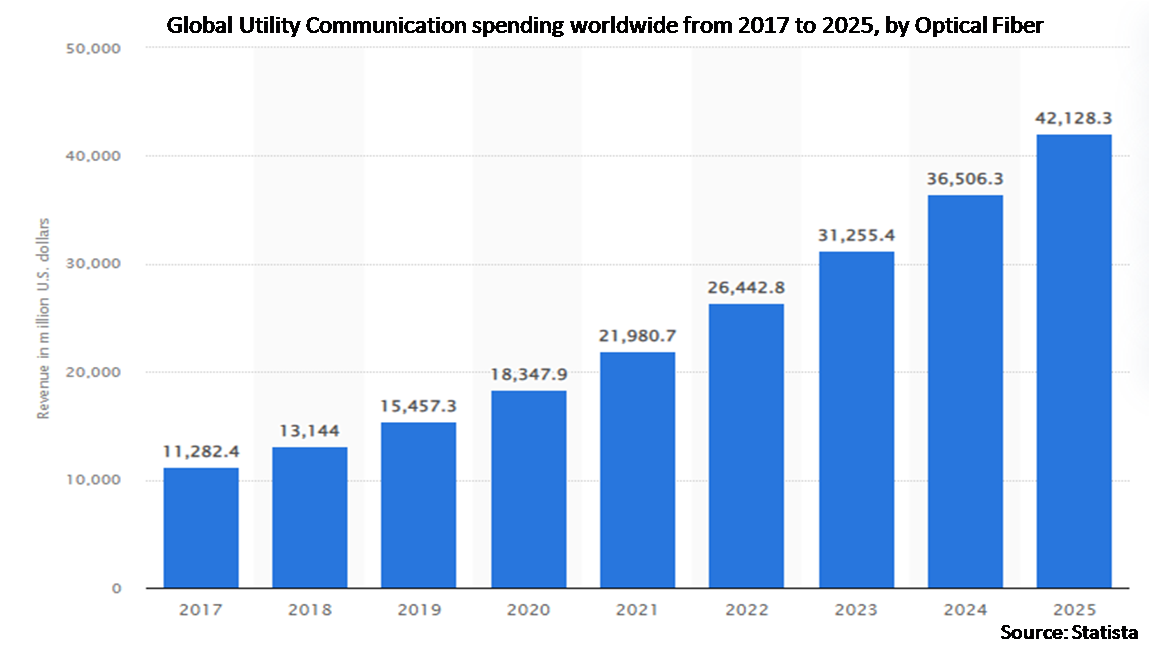
According to Stratistics MRC, the Global Utility Communication Market is accounted for $17.59 billion in 2022 and is expected to reach $45.37 billion by 2028 growing at a CAGR of 17.1% during the forecast period. Utility communications are the steps taken to set up two-way communication between utility and end consumers across all of the network's distributed data points. It enables real-time data transfer to control centres, the control and monitoring of grid equipment, and the measurement of electric network performance. Power line carrier, fibre optics, ethernet, microwave, and radio communications are just a few of the utility communication technologies that can be used in the Oil & Gas sectors' transmission and distribution networks. The utility communications market makes it possible to connect with quicker, more reliable, and cost-effective infrastructure, which results in lower operational costs, fewer customer complaints, and more energy conservation.
According to the IEA, renewable energy capacity is anticipated to grow at a rapid pace in the following five years, accounting for about 95% of the increase in global power capacity by 2026. According to the UN report, by 2025, 1.8 billion people will be living in countries or regions with absolute water scarcity and that poses a major threat to several sectors including food security.
Market Dynamics:
Driver:
Focus on improving grid reliability
In order to increase the reliability of the electricity distribution network, utility communication technologies are needed. To increase the operational effectiveness of power distribution systems, data is collected, automated, analysed, and optimised using sensors, processors, communication networks, and switches. Automated voltage regulators aid electric utilities in lowering peak loads, making the most of their current resources, and enhancing power reliability. Utility communication systems assist grid operators in utilising repair workers effectively and reducing truck rolls based on real-time data to maximise operations remotely. As a result, implementing utility communication enables utilities to restore service more quickly, emit less pollution, and maintain high levels of operational efficiency and dependability.
Restraint:
Lack of standards and interoperability
The capacity of two or more networks, systems, devices, applications, or components to share and easily use information safely and effectively without the user experiencing any discomfort is known as interoperability, and it is vital for grid modernization. Interoperability in electric power systems is the seamless, end-to-end interconnection of hardware and software from client appliances via distribution and transmission systems to the power source to improve the coordination of energy flow with real-time information and analysis flow. One of the biggest obstacles to the deployment of diverse devices is the lack of a universally accepted communication standard, as well as the incompatibility of various IT protocols and communication system components. Data management and storage is another problem. The difficulty that the majority of solution providers are dealing with is identifying non-quantifiable data from the enormous volume of data provided by various nodes of the network.
Opportunity:
Rise in number of upcoming smart city projects in developing regions
Urban areas are developing smart cities to foster sustainable economic growth. There are already more than 100 smart city projects underway throughout the globe, which present enormous prospects for tech firms, service providers, utility providers, and consulting firms. An uninterrupted power supply distribution network, which the traditional grid cannot deliver due to the high level of efficiency required, is a crucial component of the success of smart cities. As a result, utility communication is expected to be necessary for smart cities to have a reliable electricity supply. Electric service efficiency, quality, dependability, safety, and security are all improved through utility communication. New requirements like energy conservation and storage also present profitable market prospects for utility communications.
Threat:
Oil price instability and reduced oil demand
The COVID-19 epidemic has slowed the expansion of the oil and gas sector by lowering demand and, as a result, the price of oil. Lockdowns affected the nations, and the authorities imposed them all throughout the country. As a result, transportation and allied industries have experienced a significant reduction, which has had an effect on the demand for oil and gas. Due to the global shutdown and related problems along the supply chain, the spread of COVID-19 is also likely to have a negative impact on the producers of field devices used in utility communication. Due to the lack of supply, it is also anticipated that raw material prices would rise, which will ultimately cause order closures to be delayed.
Covid-19 Impact
Utility communications in 2020 will feel some of the harmful effects of the coronavirus, which are already having an adverse influence on the planet. The World Health Organization issued a public health emergency declaration in response to the COVID-19 virus epidemic in December 2019. The disease has spread to more than 100 countries, resulting in a huge mortality toll on a global scale. Global tourism, export-import, banking, and manufacturing all experienced significant losses. After initially demonstrating the potential for improvement, the downward pressure on the global economy has once more grown. The dangerous elements of the slowly expanding economy have already expanded due to the viral pandemic.
The public segment is expected to be the largest during the forecast period
The public segment is estimated to have a lucrative growth, whose primary motivation in becoming monopoly businesses is to better serve their customers by offering competitively priced services. In order to enhance their performance, these concerns are also given a few extra privileges. Large capital investments are needed for public utility companies, and these investments primarily take the form of fixed assets.
The commercial segment is expected to have the highest CAGR during the forecast period
The commercial segment is anticipated to witness the fastest CAGR growth during the forecast period, due to the demand for utility communication in the business sector has been driven by the quick expansion and development of commercial facilities, including office buildings, shops, municipal buildings, data centres, schools, hospitals, gymnasiums, and warehouses among others. Commercial buildings can reduce their energy expenditures by effectively managing peak load and power consumption through the use of utility communication systems. As a result, it is predicted that the commercial category would have the highest CAGR during the forecast period.
Region with highest share:
Asia Pacific is projected to hold the largest market share during the forecast period owing to its growing population and sizable manufacturing base. As a result, the developing nations are actively investing in matrix extension projects to improve the dependability and adaptability of appropriation organisations. Local economies are heavily focused on increasing the amount of renewable energy production. In addition, the district's state-run administrations are quickly updating its outdated power system and integrating utility exchange systems into the network to enable continuous monitoring, reduce blackouts, track usage, and integrate infinite energy sources into the matrix. These factors are anticipated to support the extension of the utilities correspondence market in the district.
Region with highest CAGR:
Europe is projected to have the highest CAGR over the forecast period, owing to the demand for advanced communication solutions is rising in Europe as a result of enterprises adopting more technological solutions. Additionally, the expansion of offshore drilling operations provides an opportunity for market expansion in Europe. These elements significantly contribute to the expansion of the utility communications sector in Europe.

Key players in the market
Some of the key players profiled in the Utility Communication Market include ABB, Honeywell International Inc., Yokogawa, Hitachi, Azbil Corporation, General Electric, Schneider Electric, Metso Corporation, Emerson, Rockwell Automation, Toshiba, Siemens, Black & Veatch Holding, Itron, Telefonaktiebolaget LM Ericsson, Nokia, FUJITSU, Sensus (Xylem) and Motorola Solutions.
Key Developments:
In June 2022 Nokia came into collaboration with Cellnex Telecom, a Spanish wireless telecommunications infrastructure, and services company. This partnership is aimed to promote digital transformation across a series of industries.
In June 2022, GE Digital partnered with Climavision, a weather technology company. The partnership is made to support GE Digital’s electric utility customers to enhance their capability to forecast weather and good plan for worse storm events.
In June 2022, Schneider Electric came into collaboration with Hitachi Energy, a technology leader in transmission, distribution, and grid automation solutions. Through this collaboration, both companies aim to offer better customer value and boost the energy transition. Additionally, the company assumes this collaboration would ensure benefits for customers in their operational life cycle.
In May 2022, Itron, Inc., collaborated with Microsoft, a technology corporation producing computer software, and consumer electronics. Under this collaboration, companies would combine Microsoft’s leading cloud solutions and Itron’s leading energy management solutions to change the way end users manage and look at their energy and how utilities address the requirements of a quickly transforming industry.
In December 2021, Fujitsu signed an agreement with GE, an energy leader engaged in offering equipment, solutions, and services. Under this Agreement, Companies combine Fujitsu’s system integration, operation services, and maintenance and GE’s OEM expertise in grid asset performance management to deliver Transmission & Distribution utilities full support in creating and finalizing their digitalization projects.
Technologies Covered:
• Wireless
• Wired
Utilities Covered:
• Private
• Public
Components Covered:
• Software
• Hardware
Applications Covered:
• Oil & Gas Utility
• Transmission & Distribution
• Other Applications
End Users Covered:
• Industrial
• Commercial
• Residential
• Other End Users
Regions Covered:
• North America
o US
o Canada
o Mexico
• Europe
o Germany
o UK
o Italy
o France
o Spain
o Rest of Europe
• Asia Pacific
o Japan
o China
o India
o Australia
o New Zealand
o South Korea
o Rest of Asia Pacific
• South America
o Argentina
o Brazil
o Chile
o Rest of South America
• Middle East & Africa
o Saudi Arabia
o UAE
o Qatar
o South Africa
o Rest of Middle East & Africa
What our report offers:
- Market share assessments for the regional and country-level segments
- Strategic recommendations for the new entrants
- Covers Market data for the years 2020, 2021, 2022, 2025, and 2028
- Market Trends (Drivers, Constraints, Opportunities, Threats, Challenges, Investment Opportunities, and recommendations)
- Strategic recommendations in key business segments based on the market estimations
- Competitive landscaping mapping the key common trends
- Company profiling with detailed strategies, financials, and recent developments
- Supply chain trends mapping the latest technological advancements
Free Customization Offerings:
All the customers of this report will be entitled to receive one of the following free customization options:
• Company Profiling
o Comprehensive profiling of additional market players (up to 3)
o SWOT Analysis of key players (up to 3)
• Regional Segmentation
o Market estimations, Forecasts and CAGR of any prominent country as per the client's interest (Note: Depends on feasibility check)
• Competitive Benchmarking
o Benchmarking of key players based on product portfolio, geographical presence, and strategic alliances
Table of Contents
1 Executive Summary
2 Preface
2.1 Abstract
2.2 Stake Holders
2.3 Research Scope
2.4 Research Methodology
2.4.1 Data Mining
2.4.2 Data Analysis
2.4.3 Data Validation
2.4.4 Research Approach
2.5 Research Sources
2.5.1 Primary Research Sources
2.5.2 Secondary Research Sources
2.5.3 Assumptions
3 Market Trend Analysis
3.1 Introduction
3.2 Drivers
3.3 Restraints
3.4 Opportunities
3.5 Threats
3.6 Technology Analysis
3.7 Application Analysis
3.8 End User Analysis
3.9 Emerging Markets
3.10 Impact of Covid-19
4 Porters Five Force Analysis
4.1 Bargaining power of suppliers
4.2 Bargaining power of buyers
4.3 Threat of substitutes
4.4 Threat of new entrants
4.5 Competitive rivalry
5 Global Utility Communication Market, By Technology
5.1 Introduction
5.2 Wireless
5.2.1 Ethernet
5.2.2 PLC
5.2.3 Optical Fiber
5.3 Wired
6 Global Utility Communication Market, By Utility
6.1 Introduction
6.2 Private
6.3 Public
7 Global Utility Communication Market, By Component
7.1 Introduction
7.2 Software
7.3 Hardware
8 Global Utility Communication Market, By Application
8.1 Introduction
8.2 Oil & Gas Utility
8.3 Transmission & Distribution
8.4 Other Applications
9 Global Utility Communication Market, By End User
9.1 Introduction
9.2 Industrial
9.3 Commercial
9.4 Residential
9.5 Other End Users
10 Global Utility Communication Market, By Geography
10.1 Introduction
10.2 North America
10.2.1 US
10.2.2 Canada
10.2.3 Mexico
10.3 Europe
10.3.1 Germany
10.3.2 UK
10.3.3 Italy
10.3.4 France
10.3.5 Spain
10.3.6 Rest of Europe
10.4 Asia Pacific
10.4.1 Japan
10.4.2 China
10.4.3 India
10.4.4 Australia
10.4.5 New Zealand
10.4.6 South Korea
10.4.7 Rest of Asia Pacific
10.5 South America
10.5.1 Argentina
10.5.2 Brazil
10.5.3 Chile
10.5.4 Rest of South America
10.6 Middle East & Africa
10.6.1 Saudi Arabia
10.6.2 UAE
10.6.3 Qatar
10.6.4 South Africa
10.6.5 Rest of Middle East & Africa
11 Key Developments
11.1 Agreements, Partnerships, Collaborations and Joint Ventures
11.2 Acquisitions & Mergers
11.3 New Product Launch
11.4 Expansions
11.5 Other Key Strategies
12 Company Profiling
12.1 ABB
12.2 Honeywell International Inc.
12.3 Yokogawa
12.4 Hitachi
12.5 Azbil Corporation
12.6 General Electric
12.7 Schneider Electric
12.8 Metso Corporation
12.9 Emerson
12.10 Rockwell Automation
12.11 Toshiba
12.12 Siemens
12.13 Black & Veatch Holding
12.14 Itron
12.15 Telefonaktiebolaget LM Ericsson
12.16 Nokia
12.17 FUJITSU
12.18 Sensus (Xylem)
12.19 Motorola Solutions
List of Tables
1 Global Utility Communication Market Outlook, By Region (2020-2028) ($MN)
2 Global Utility Communication Market Outlook, By Technology (2020-2028) ($MN)
3 Global Utility Communication Market Outlook, By Wireless (2020-2028) ($MN)
4 Global Utility Communication Market Outlook, By Ethernet (2020-2028) ($MN)
5 Global Utility Communication Market Outlook, By PLC (2020-2028) ($MN)
6 Global Utility Communication Market Outlook, By Optical Fiber (2020-2028) ($MN)
7 Global Utility Communication Market Outlook, By Wired (2020-2028) ($MN)
8 Global Utility Communication Market Outlook, By Utility (2020-2028) ($MN)
9 Global Utility Communication Market Outlook, By Private (2020-2028) ($MN)
10 Global Utility Communication Market Outlook, By Public (2020-2028) ($MN)
11 Global Utility Communication Market Outlook, By Component (2020-2028) ($MN)
12 Global Utility Communication Market Outlook, By Software (2020-2028) ($MN)
13 Global Utility Communication Market Outlook, By Hardware (2020-2028) ($MN)
14 Global Utility Communication Market Outlook, By Application (2020-2028) ($MN)
15 Global Utility Communication Market Outlook, By Oil & Gas Utility (2020-2028) ($MN)
16 Global Utility Communication Market Outlook, By Transmission & Distribution (2020-2028) ($MN)
17 Global Utility Communication Market Outlook, By Other Applications (2020-2028) ($MN)
18 Global Utility Communication Market Outlook, By End User (2020-2028) ($MN)
19 Global Utility Communication Market Outlook, By Industrial (2020-2028) ($MN)
20 Global Utility Communication Market Outlook, By Commercial (2020-2028) ($MN)
21 Global Utility Communication Market Outlook, By Residential (2020-2028) ($MN)
22 Global Utility Communication Market Outlook, By Other End Users (2020-2028) ($MN)
23 North America Utility Communication Market Outlook, By Country (2020-2028) ($MN)
24 North America Utility Communication Market Outlook, By Technology (2020-2028) ($MN)
25 North America Utility Communication Market Outlook, By Wireless (2020-2028) ($MN)
26 North America Utility Communication Market Outlook, By Ethernet (2020-2028) ($MN)
27 North America Utility Communication Market Outlook, By PLC (2020-2028) ($MN)
28 North America Utility Communication Market Outlook, By Optical Fiber (2020-2028) ($MN)
29 North America Utility Communication Market Outlook, By Wired (2020-2028) ($MN)
30 North America Utility Communication Market Outlook, By Utility (2020-2028) ($MN)
31 North America Utility Communication Market Outlook, By Private (2020-2028) ($MN)
32 North America Utility Communication Market Outlook, By Public (2020-2028) ($MN)
33 North America Utility Communication Market Outlook, By Component (2020-2028) ($MN)
34 North America Utility Communication Market Outlook, By Software (2020-2028) ($MN)
35 North America Utility Communication Market Outlook, By Hardware (2020-2028) ($MN)
36 North America Utility Communication Market Outlook, By Application (2020-2028) ($MN)
37 North America Utility Communication Market Outlook, By Oil & Gas Utility (2020-2028) ($MN)
38 North America Utility Communication Market Outlook, By Transmission & Distribution (2020-2028) ($MN)
39 North America Utility Communication Market Outlook, By Other Applications (2020-2028) ($MN)
40 North America Utility Communication Market Outlook, By End User (2020-2028) ($MN)
41 North America Utility Communication Market Outlook, By Industrial (2020-2028) ($MN)
42 North America Utility Communication Market Outlook, By Commercial (2020-2028) ($MN)
43 North America Utility Communication Market Outlook, By Residential (2020-2028) ($MN)
44 North America Utility Communication Market Outlook, By Other End Users (2020-2028) ($MN)
45 Europe Utility Communication Market Outlook, By Country (2020-2028) ($MN)
46 Europe Utility Communication Market Outlook, By Technology (2020-2028) ($MN)
47 Europe Utility Communication Market Outlook, By Wireless (2020-2028) ($MN)
48 Europe Utility Communication Market Outlook, By Ethernet (2020-2028) ($MN)
49 Europe Utility Communication Market Outlook, By PLC (2020-2028) ($MN)
50 Europe Utility Communication Market Outlook, By Optical Fiber (2020-2028) ($MN)
51 Europe Utility Communication Market Outlook, By Wired (2020-2028) ($MN)
52 Europe Utility Communication Market Outlook, By Utility (2020-2028) ($MN)
53 Europe Utility Communication Market Outlook, By Private (2020-2028) ($MN)
54 Europe Utility Communication Market Outlook, By Public (2020-2028) ($MN)
55 Europe Utility Communication Market Outlook, By Component (2020-2028) ($MN)
56 Europe Utility Communication Market Outlook, By Software (2020-2028) ($MN)
57 Europe Utility Communication Market Outlook, By Hardware (2020-2028) ($MN)
58 Europe Utility Communication Market Outlook, By Application (2020-2028) ($MN)
59 Europe Utility Communication Market Outlook, By Oil & Gas Utility (2020-2028) ($MN)
60 Europe Utility Communication Market Outlook, By Transmission & Distribution (2020-2028) ($MN)
61 Europe Utility Communication Market Outlook, By Other Applications (2020-2028) ($MN)
62 Europe Utility Communication Market Outlook, By End User (2020-2028) ($MN)
63 Europe Utility Communication Market Outlook, By Industrial (2020-2028) ($MN)
64 Europe Utility Communication Market Outlook, By Commercial (2020-2028) ($MN)
65 Europe Utility Communication Market Outlook, By Residential (2020-2028) ($MN)
66 Europe Utility Communication Market Outlook, By Other End Users (2020-2028) ($MN)
67 Asia Pacific Utility Communication Market Outlook, By Country (2020-2028) ($MN)
68 Asia Pacific Utility Communication Market Outlook, By Technology (2020-2028) ($MN)
69 Asia Pacific Utility Communication Market Outlook, By Wireless (2020-2028) ($MN)
70 Asia Pacific Utility Communication Market Outlook, By Ethernet (2020-2028) ($MN)
71 Asia Pacific Utility Communication Market Outlook, By PLC (2020-2028) ($MN)
72 Asia Pacific Utility Communication Market Outlook, By Optical Fiber (2020-2028) ($MN)
73 Asia Pacific Utility Communication Market Outlook, By Wired (2020-2028) ($MN)
74 Asia Pacific Utility Communication Market Outlook, By Utility (2020-2028) ($MN)
75 Asia Pacific Utility Communication Market Outlook, By Private (2020-2028) ($MN)
76 Asia Pacific Utility Communication Market Outlook, By Public (2020-2028) ($MN)
77 Asia Pacific Utility Communication Market Outlook, By Component (2020-2028) ($MN)
78 Asia Pacific Utility Communication Market Outlook, By Software (2020-2028) ($MN)
79 Asia Pacific Utility Communication Market Outlook, By Hardware (2020-2028) ($MN)
80 Asia Pacific Utility Communication Market Outlook, By Application (2020-2028) ($MN)
81 Asia Pacific Utility Communication Market Outlook, By Oil & Gas Utility (2020-2028) ($MN)
82 Asia Pacific Utility Communication Market Outlook, By Transmission & Distribution (2020-2028) ($MN)
83 Asia Pacific Utility Communication Market Outlook, By Other Applications (2020-2028) ($MN)
84 Asia Pacific Utility Communication Market Outlook, By End User (2020-2028) ($MN)
85 Asia Pacific Utility Communication Market Outlook, By Industrial (2020-2028) ($MN)
86 Asia Pacific Utility Communication Market Outlook, By Commercial (2020-2028) ($MN)
87 Asia Pacific Utility Communication Market Outlook, By Residential (2020-2028) ($MN)
88 Asia Pacific Utility Communication Market Outlook, By Other End Users (2020-2028) ($MN)
89 South America Utility Communication Market Outlook, By Country (2020-2028) ($MN)
90 South America Utility Communication Market Outlook, By Technology (2020-2028) ($MN)
91 South America Utility Communication Market Outlook, By Wireless (2020-2028) ($MN)
92 South America Utility Communication Market Outlook, By Ethernet (2020-2028) ($MN)
93 South America Utility Communication Market Outlook, By PLC (2020-2028) ($MN)
94 South America Utility Communication Market Outlook, By Optical Fiber (2020-2028) ($MN)
95 South America Utility Communication Market Outlook, By Wired (2020-2028) ($MN)
96 South America Utility Communication Market Outlook, By Utility (2020-2028) ($MN)
97 South America Utility Communication Market Outlook, By Private (2020-2028) ($MN)
98 South America Utility Communication Market Outlook, By Public (2020-2028) ($MN)
99 South America Utility Communication Market Outlook, By Component (2020-2028) ($MN)
100 South America Utility Communication Market Outlook, By Software (2020-2028) ($MN)
101 South America Utility Communication Market Outlook, By Hardware (2020-2028) ($MN)
102 South America Utility Communication Market Outlook, By Application (2020-2028) ($MN)
103 South America Utility Communication Market Outlook, By Oil & Gas Utility (2020-2028) ($MN)
104 South America Utility Communication Market Outlook, By Transmission & Distribution (2020-2028) ($MN)
105 South America Utility Communication Market Outlook, By Other Applications (2020-2028) ($MN)
106 South America Utility Communication Market Outlook, By End User (2020-2028) ($MN)
107 South America Utility Communication Market Outlook, By Industrial (2020-2028) ($MN)
108 South America Utility Communication Market Outlook, By Commercial (2020-2028) ($MN)
109 South America Utility Communication Market Outlook, By Residential (2020-2028) ($MN)
110 South America Utility Communication Market Outlook, By Other End Users (2020-2028) ($MN)
111 Middle East & Africa Utility Communication Market Outlook, By Country (2020-2028) ($MN)
112 Middle East & Africa Utility Communication Market Outlook, By Technology (2020-2028) ($MN)
113 Middle East & Africa Utility Communication Market Outlook, By Wireless (2020-2028) ($MN)
114 Middle East & Africa Utility Communication Market Outlook, By Ethernet (2020-2028) ($MN)
115 Middle East & Africa Utility Communication Market Outlook, By PLC (2020-2028) ($MN)
116 Middle East & Africa Utility Communication Market Outlook, By Optical Fiber (2020-2028) ($MN)
117 Middle East & Africa Utility Communication Market Outlook, By Wired (2020-2028) ($MN)
118 Middle East & Africa Utility Communication Market Outlook, By Utility (2020-2028) ($MN)
119 Middle East & Africa Utility Communication Market Outlook, By Private (2020-2028) ($MN)
120 Middle East & Africa Utility Communication Market Outlook, By Public (2020-2028) ($MN)
121 Middle East & Africa Utility Communication Market Outlook, By Component (2020-2028) ($MN)
122 Middle East & Africa Utility Communication Market Outlook, By Software (2020-2028) ($MN)
123 Middle East & Africa Utility Communication Market Outlook, By Hardware (2020-2028) ($MN)
124 Middle East & Africa Utility Communication Market Outlook, By Application (2020-2028) ($MN)
125 Middle East & Africa Utility Communication Market Outlook, By Oil & Gas Utility (2020-2028) ($MN)
126 Middle East & Africa Utility Communication Market Outlook, By Transmission & Distribution (2020-2028) ($MN)
127 Middle East & Africa Utility Communication Market Outlook, By Other Applications (2020-2028) ($MN)
128 Middle East & Africa Utility Communication Market Outlook, By End User (2020-2028) ($MN)
129 Middle East & Africa Utility Communication Market Outlook, By Industrial (2020-2028) ($MN)
130 Middle East & Africa Utility Communication Market Outlook, By Commercial (2020-2028) ($MN)
131 Middle East & Africa Utility Communication Market Outlook, By Residential (2020-2028) ($MN)
132 Middle East & Africa Utility Communication Market Outlook, By Other End Users (2020-2028) ($MN)
List of Figures
RESEARCH METHODOLOGY

We at ‘Stratistics’ opt for an extensive research approach which involves data mining, data validation, and data analysis. The various research sources include in-house repository, secondary research, competitor’s sources, social media research, client internal data, and primary research.
Our team of analysts prefers the most reliable and authenticated data sources in order to perform the comprehensive literature search. With access to most of the authenticated data bases our team highly considers the best mix of information through various sources to obtain extensive and accurate analysis.
Each report takes an average time of a month and a team of 4 industry analysts. The time may vary depending on the scope and data availability of the desired market report. The various parameters used in the market assessment are standardized in order to enhance the data accuracy.
Data Mining
The data is collected from several authenticated, reliable, paid and unpaid sources and is filtered depending on the scope & objective of the research. Our reports repository acts as an added advantage in this procedure. Data gathering from the raw material suppliers, distributors and the manufacturers is performed on a regular basis, this helps in the comprehensive understanding of the products value chain. Apart from the above mentioned sources the data is also collected from the industry consultants to ensure the objective of the study is in the right direction.
Market trends such as technological advancements, regulatory affairs, market dynamics (Drivers, Restraints, Opportunities and Challenges) are obtained from scientific journals, market related national & international associations and organizations.
Data Analysis
From the data that is collected depending on the scope & objective of the research the data is subjected for the analysis. The critical steps that we follow for the data analysis include:
- Product Lifecycle Analysis
- Competitor analysis
- Risk analysis
- Porters Analysis
- PESTEL Analysis
- SWOT Analysis
The data engineering is performed by the core industry experts considering both the Marketing Mix Modeling and the Demand Forecasting. The marketing mix modeling makes use of multiple-regression techniques to predict the optimal mix of marketing variables. Regression factor is based on a number of variables and how they relate to an outcome such as sales or profits.
Data Validation
The data validation is performed by the exhaustive primary research from the expert interviews. This includes telephonic interviews, focus groups, face to face interviews, and questionnaires to validate our research from all aspects. The industry experts we approach come from the leading firms, involved in the supply chain ranging from the suppliers, distributors to the manufacturers and consumers so as to ensure an unbiased analysis.
We are in touch with more than 15,000 industry experts with the right mix of consultants, CEO's, presidents, vice presidents, managers, experts from both supply side and demand side, executives and so on.
The data validation involves the primary research from the industry experts belonging to:
- Leading Companies
- Suppliers & Distributors
- Manufacturers
- Consumers
- Industry/Strategic Consultants
Apart from the data validation the primary research also helps in performing the fill gap research, i.e. providing solutions for the unmet needs of the research which helps in enhancing the reports quality.
For more details about research methodology, kindly write to us at info@strategymrc.com
Frequently Asked Questions
In case of any queries regarding this report, you can contact the customer service by filing the “Inquiry Before Buy” form available on the right hand side. You may also contact us through email: info@strategymrc.com or phone: +1-301-202-5929
Yes, the samples are available for all the published reports. You can request them by filling the “Request Sample” option available in this page.
Yes, you can request a sample with your specific requirements. All the customized samples will be provided as per the requirement with the real data masked.
All our reports are available in Digital PDF format. In case if you require them in any other formats, such as PPT, Excel etc you can submit a request through “Inquiry Before Buy” form available on the right hand side. You may also contact us through email: info@strategymrc.com or phone: +1-301-202-5929
We offer a free 15% customization with every purchase. This requirement can be fulfilled for both pre and post sale. You may send your customization requirements through email at info@strategymrc.com or call us on +1-301-202-5929.
We have 3 different licensing options available in electronic format.
- Single User Licence: Allows one person, typically the buyer, to have access to the ordered product. The ordered product cannot be distributed to anyone else.
- 2-5 User Licence: Allows the ordered product to be shared among a maximum of 5 people within your organisation.
- Corporate License: Allows the product to be shared among all employees of your organisation regardless of their geographical location.
All our reports are typically be emailed to you as an attachment.
To order any available report you need to register on our website. The payment can be made either through CCAvenue or PayPal payments gateways which accept all international cards.
We extend our support to 6 months post sale. A post sale customization is also provided to cover your unmet needs in the report.
Request Customization
We offer complimentary customization of up to 15% with every purchase. To share your customization requirements, feel free to email us at info@strategymrc.com or call us on +1-301-202-5929. .
Please Note: Customization within the 15% threshold is entirely free of charge. If your request exceeds this limit, we will conduct a feasibility assessment. Following that, a detailed quote and timeline will be provided.
WHY CHOOSE US ?

Assured Quality
Best in class reports with high standard of research integrity

24X7 Research Support
Continuous support to ensure the best customer experience.

Free Customization
Adding more values to your product of interest.

Safe & Secure Access
Providing a secured environment for all online transactions.

Trusted by 600+ Brands
Serving the most reputed brands across the world.