
Water Quality Monitoring Market
Water Quality Monitoring Market Forecasts to 2030 - Global Analysis By Product Type (Sensors, Probes and Analyzers and Software and Services), Technology (Online Monitoring Systems, Offline Monitoring Systems, Remote Monitoring Systems, Continuous Monitoring Systems and Grab Sampling Systems), Application, End User and By Geography

|
Years Covered |
2022-2030 |
|
Estimated Year Value (2024) |
US $6.3 BN |
|
Projected Year Value (2030) |
US $10.0 BN |
|
CAGR (2024-2030) |
7.8% |
|
Regions Covered |
North America, Europe, Asia Pacific, South America, and Middle East & Africa |
|
Countries Covered |
US, Canada, Mexico, Germany, UK, Italy, France, Spain, Japan, China, India, Australia, New Zealand, South Korea, Rest of Asia Pacific, South America, Argentina, Brazil, Chile, Middle East & Africa, Saudi Arabia, UAE, Qatar, and South Africa |
|
Largest Market |
North America |
|
Highest Growing Market |
Asia Pacific |
According to Stratistics MRC, the Global Water Quality Monitoring Market is accounted for $6.3 billion in 2024 and is expected to reach $10.0 billion by 2030 growing at a CAGR of 7.8% during the forecast period. Water quality monitoring involves the systematic sampling and analysis of water to assess its physical, chemical, and biological characteristics, ensuring it meets safety and environmental standards. It is essential for maintaining healthy ecosystems, safe drinking water, and compliance with regulations. The growth of this field is driven by increasing environmental concerns, stringent regulations, technological advancements, and rising awareness of the importance of water quality in public health and industrial processes, particularly in developing regions experiencing rapid industrialization.
According to the World Health Organization (WHO), at least 2 billion people drink contaminated water containing harmful pollutants. Thus, there is an urgent need to adopt water quality monitoring systems for analyzing and examining the water quality.
Market Dynamics:
Driver:
Increasing water pollution
The rise in industrialization and urbanization has led to significant water pollution, necessitating the adoption of water quality monitoring systems. These systems help detect contaminants and ensure water safety, driving market growth. The increasing prevalence of waterborne diseases and stringent government regulations further bolster the demand for these monitoring systems, making water quality monitoring essential for public health and environmental protection.
Restraint:
High cost of advanced systems
The high cost of installing and maintaining advanced water quality monitoring systems is a significant barrier to market growth. These systems require substantial investment in sophisticated sensors and technology, which can be prohibitive for small-scale applications and price-sensitive markets. This cost factor limits the widespread adoption of water quality monitoring solutions, particularly in developing regions.
Opportunity:
Advancements in sensor technology
Technological advancements in sensor technology present significant opportunities for the water quality monitoring market. Innovations such as wireless sensor networks, advanced pH, turbidity, and dissolved oxygen sensors enhance the accuracy and efficiency of water quality monitoring. These advancements enable real-time data collection and analysis, improving contamination detection and water quality management, thus driving market growth.
Threat:
Environmental and climate challenges
Environmental and climate challenges pose a threat to the water quality monitoring market. Climate change can alter water quality parameters, making it difficult to maintain consistent monitoring standards. Additionally, environmental regulations can vary widely across regions, creating challenges for companies to comply with diverse standards. These factors can hinder the effectiveness and adoption of water quality monitoring systems.
Covid-19 Impact:
The COVID-19 pandemic had a mixed impact on the water quality monitoring market. While the initial lockdowns and economic slowdown disrupted supply chains and delayed projects, the pandemic also highlighted the importance of monitoring water quality to prevent disease spread. Increased awareness of hygiene and sanitation has driven demand for water quality monitoring systems, particularly in healthcare and public utilities.
The sensors segment is expected to be the largest during the forecast period
The sensors segment is expected to dominate the market due to their critical role in monitoring various water quality parameters. These sensors provide accurate and real-time data, essential for maintaining water safety and compliance with regulatory standards. The widespread application of these sensors across industries such as pharmaceuticals, food and beverage, and environmental monitoring drives their market dominance.
The wastewater monitoring segment is expected to have the highest CAGR during the forecast period
The wastewater monitoring segment is projected to experience the highest CAGR due to increasing regulatory requirements and the need for sustainable water management practices. Monitoring wastewater helps in detecting pollutants and ensuring that treated water meets safety standards before being discharged into the environment. The growing focus on environmental protection and the implementation of stringent wastewater treatment regulations drive the growth of this segment.
Region with largest share:
North America is expected to dominate the water quality monitoring market due to advanced technological infrastructure, stringent environmental regulations, and high awareness of water quality issues. The presence of key market players and significant government funding for pollution monitoring and control further support the market's growth in this region. The U.S. Clean Water Act and Safe Drinking Water Act are pivotal in driving the adoption of water quality monitoring systems.
Region with highest CAGR:
The Asia Pacific region is anticipated to witness the highest CAGR in the water quality monitoring market, driven by rapid industrialization, urbanization, and increasing environmental concerns. Countries like China and India are investing heavily in water quality monitoring systems to combat pollution and ensure safe drinking water. The growing awareness of waterborne diseases and government initiatives to improve water quality infrastructure contribute to the region's rapid market growth.

Key players in the market
Some of the key players in Water Quality Monitoring Market include Danaher Corporation, Thermo Fisher Scientific Inc., Xylem Inc., Horiba, Ltd., Teledyne Technologies Incorporated, Agilent Technologies, Inc., General Electric Company, Honeywell International Inc., Mettler-Toledo International Inc., Shimadzu Corporation, Emerson Electric Co., Hach Company, LaMotte Company, Pentair plc, Evoqua Water Technologies LLC, YSI Inc., In-Situ Inc., OTT Hydromet, Campbell Scientific, Inc., and Hanna Instruments, Inc.
Key Developments:
In March 2024, Hach introduced the new BioTector B7000 Online ATP Monitoring System for real-time detection of microbial contamination in water treatment processes. It provides rapid results in 5-10 minutes.
In March 2024, Thermo Fisher launched the new Dionex Inuvion Ion Chromatography system designed for simplified and versatile ion analysis for environmental, industrial and municipal water testing labs.
In February 2024, Thermo Fisher announced the launch of its 'Make in India' Class 1 analyser-based Continuous Ambient Air Quality Monitoring System (CAAQMS) to support India's environmental monitoring efforts.
Product Types Covered:
• Sensors
• Probes and Analyzers
• Software and Services
Technologies Covered:
• Online Monitoring Systems
• Offline Monitoring Systems
• Remote Monitoring Systems
• Continuous Monitoring Systems
• Grab Sampling Systems
Applications Covered:
• Surface Water Monitoring
• Groundwater Monitoring
• Drinking Water Monitoring
• Wastewater Monitoring
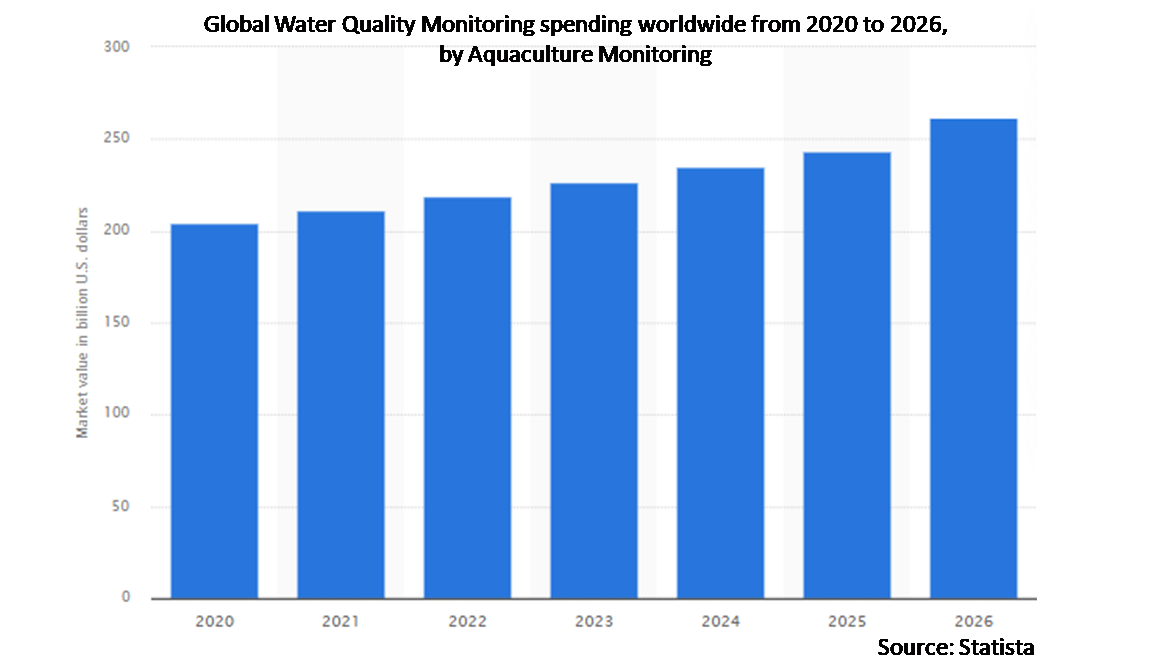
• Aquaculture Monitoring
• Environmental Monitoring
End Users Covered:
• Municipal Water Utilities
• Industrial Facilities
• Marine
• Environmental Agencies
• Research Institutions
• Agriculture Sector
• Residential Users
• Other End Users
Regions Covered:
• North America
o US
o Canada
o Mexico
• Europe
o Germany
o UK
o Italy
o France
o Spain
o Rest of Europe
• Asia Pacific
o Japan
o China
o India
o Australia
o New Zealand
o South Korea
o Rest of Asia Pacific
• South America
o Argentina
o Brazil
o Chile
o Rest of South America
• Middle East & Africa
o Saudi Arabia
o UAE
o Qatar
o South Africa
o Rest of Middle East & Africa
What our report offers:
- Market share assessments for the regional and country-level segments
- Strategic recommendations for the new entrants
- Covers Market data for the years 2022, 2023, 2024, 2026, and 2030
- Market Trends (Drivers, Constraints, Opportunities, Threats, Challenges, Investment Opportunities, and recommendations)
- Strategic recommendations in key business segments based on the market estimations
- Competitive landscaping mapping the key common trends
- Company profiling with detailed strategies, financials, and recent developments
- Supply chain trends mapping the latest technological advancements
Free Customization Offerings:
All the customers of this report will be entitled to receive one of the following free customization options:
• Company Profiling
o Comprehensive profiling of additional market players (up to 3)
o SWOT Analysis of key players (up to 3)
• Regional Segmentation
o Market estimations, Forecasts and CAGR of any prominent country as per the client's interest (Note: Depends on feasibility check)
• Competitive Benchmarking
Benchmarking of key players based on product portfolio, geographical presence, and strategic alliances
Table of Contents
1 Executive Summary
2 Preface
2.1 Abstract
2.2 Stake Holders
2.3 Research Scope
2.4 Research Methodology
2.4.1 Data Mining
2.4.2 Data Analysis
2.4.3 Data Validation
2.4.4 Research Approach
2.5 Research Sources
2.5.1 Primary Research Sources
2.5.2 Secondary Research Sources
2.5.3 Assumptions
3 Market Trend Analysis
3.1 Introduction
3.2 Drivers
3.3 Restraints
3.4 Opportunities
3.5 Threats
3.6 Product Analysis
3.7 Technology Analysis
3.8 Application Analysis
3.9 End User Analysis
3.10 Emerging Markets
3.11 Impact of Covid-19
4 Porters Five Force Analysis
4.1 Bargaining power of suppliers
4.2 Bargaining power of buyers
4.3 Threat of substitutes
4.4 Threat of new entrants
4.5 Competitive rivalry
5 Global Water Quality Monitoring Market, By Product Type
5.1 Introduction
5.2 Sensors
5.2.1 Electrochemical Sensors
5.2.2 Optical Sensors
5.2.3 pH Sensors
5.2.4 Conductivity Sensors
5.2.5 Ion Selective Electrode (ISE)
5.3 Probes and Analyzers
5.3.1 pH Probes
5.3.2 Dissolved Oxygen Probes
5.3.3 Turbidity Analyzers
5.3.4 Total Organic Carbon (TOC) Analyzers
5.3.5 Nutrient Analyzers
5.3.6 Chemical Oxygen Demand (COD) Analyzers
5.4 Software and Services
5.4.1 Data Management Software
5.4.2 Cloud-Based Solutions
5.4.3 Maintenance and Support Services
6 Global Water Quality Monitoring Market, By Technology
6.1 Introduction
6.2 Online Monitoring Systems
6.3 Offline Monitoring Systems
6.4 Remote Monitoring Systems
6.5 Continuous Monitoring Systems
6.6 Grab Sampling Systems
7 Global Water Quality Monitoring Market, By Application
7.1 Introduction
7.2 Surface Water Monitoring
7.3 Groundwater Monitoring
7.4 Drinking Water Monitoring
7.5 Wastewater Monitoring
7.6 Aquaculture Monitoring
7.7 Environmental Monitoring
8 Global Water Quality Monitoring Market, By End User
8.1 Introduction
8.2 Municipal Water Utilities
8.3 Industrial Facilities
8.4 Marine
8.5 Environmental Agencies
8.6 Research Institutions
8.7 Agriculture Sector
8.8 Residential Users
8.9 Other End Users
9 Global Water Quality Monitoring Market, By Geography
9.1 Introduction
9.2 North America
9.2.1 US
9.2.2 Canada
9.2.3 Mexico
9.3 Europe
9.3.1 Germany
9.3.2 UK
9.3.3 Italy
9.3.4 France
9.3.5 Spain
9.3.6 Rest of Europe
9.4 Asia Pacific
9.4.1 Japan
9.4.2 China
9.4.3 India
9.4.4 Australia
9.4.5 New Zealand
9.4.6 South Korea
9.4.7 Rest of Asia Pacific
9.5 South America
9.5.1 Argentina
9.5.2 Brazil
9.5.3 Chile
9.5.4 Rest of South America
9.6 Middle East & Africa
9.6.1 Saudi Arabia
9.6.2 UAE
9.6.3 Qatar
9.6.4 South Africa
9.6.5 Rest of Middle East & Africa
10 Key Developments
10.1 Agreements, Partnerships, Collaborations and Joint Ventures
10.2 Acquisitions & Mergers
10.3 New Product Launch
10.4 Expansions
10.5 Other Key Strategies
11 Company Profiling
11.1 Danaher Corporation
11.2 Thermo Fisher Scientific Inc.
11.3 Xylem Inc.
11.4 Horiba, Ltd.
11.5 Teledyne Technologies Incorporated
11.6 Agilent Technologies, Inc.
11.7 General Electric Company
11.8 Honeywell International Inc.
11.9 Mettler-Toledo International Inc.
11.10 Shimadzu Corporation
11.11 Emerson Electric Co.
11.12 Hach Company
11.13 LaMotte Company
11.14 Pentair plc
11.15 Evoqua Water Technologies LLC
11.16 YSI Inc.
11.17 In-Situ Inc.
11.18 OTT Hydromet
11.19 Campbell Scientific, Inc.
11.20 Hanna Instruments, Inc.
List of Tables
1 Global Water Quality Monitoring Market Outlook, By Region (2022-2030) ($MN)
2 Global Water Quality Monitoring Market Outlook, By Product Type (2022-2030) ($MN)
3 Global Water Quality Monitoring Market Outlook, By Sensors (2022-2030) ($MN)
4 Global Water Quality Monitoring Market Outlook, By Electrochemical Sensors (2022-2030) ($MN)
5 Global Water Quality Monitoring Market Outlook, By Optical Sensors (2022-2030) ($MN)
6 Global Water Quality Monitoring Market Outlook, By pH Sensors (2022-2030) ($MN)
7 Global Water Quality Monitoring Market Outlook, By Conductivity Sensors (2022-2030) ($MN)
8 Global Water Quality Monitoring Market Outlook, By Ion Selective Electrode (ISE) (2022-2030) ($MN)
9 Global Water Quality Monitoring Market Outlook, By Probes and Analyzers (2022-2030) ($MN)
10 Global Water Quality Monitoring Market Outlook, By pH Probes (2022-2030) ($MN)
11 Global Water Quality Monitoring Market Outlook, By Dissolved Oxygen Probes (2022-2030) ($MN)
12 Global Water Quality Monitoring Market Outlook, By Turbidity Analyzers (2022-2030) ($MN)
13 Global Water Quality Monitoring Market Outlook, By Total Organic Carbon (TOC) Analyzers (2022-2030) ($MN)
14 Global Water Quality Monitoring Market Outlook, By Nutrient Analyzers (2022-2030) ($MN)
15 Global Water Quality Monitoring Market Outlook, By Chemical Oxygen Demand (COD) Analyzers (2022-2030) ($MN)
16 Global Water Quality Monitoring Market Outlook, By Software and Services (2022-2030) ($MN)
17 Global Water Quality Monitoring Market Outlook, By Data Management Software (2022-2030) ($MN)
18 Global Water Quality Monitoring Market Outlook, By Cloud-Based Solutions (2022-2030) ($MN)
19 Global Water Quality Monitoring Market Outlook, By Maintenance and Support Services (2022-2030) ($MN)
20 Global Water Quality Monitoring Market Outlook, By Technology (2022-2030) ($MN)
21 Global Water Quality Monitoring Market Outlook, By Online Monitoring Systems (2022-2030) ($MN)
22 Global Water Quality Monitoring Market Outlook, By Offline Monitoring Systems (2022-2030) ($MN)
23 Global Water Quality Monitoring Market Outlook, By Remote Monitoring Systems (2022-2030) ($MN)
24 Global Water Quality Monitoring Market Outlook, By Continuous Monitoring Systems (2022-2030) ($MN)
25 Global Water Quality Monitoring Market Outlook, By Grab Sampling Systems (2022-2030) ($MN)
26 Global Water Quality Monitoring Market Outlook, By Application (2022-2030) ($MN)
27 Global Water Quality Monitoring Market Outlook, By Surface Water Monitoring (2022-2030) ($MN)
28 Global Water Quality Monitoring Market Outlook, By Groundwater Monitoring (2022-2030) ($MN)
29 Global Water Quality Monitoring Market Outlook, By Drinking Water Monitoring (2022-2030) ($MN)
30 Global Water Quality Monitoring Market Outlook, By Wastewater Monitoring (2022-2030) ($MN)
31 Global Water Quality Monitoring Market Outlook, By Aquaculture Monitoring (2022-2030) ($MN)
32 Global Water Quality Monitoring Market Outlook, By Environmental Monitoring (2022-2030) ($MN)
33 Global Water Quality Monitoring Market Outlook, By End User (2022-2030) ($MN)
34 Global Water Quality Monitoring Market Outlook, By Municipal Water Utilities (2022-2030) ($MN)
35 Global Water Quality Monitoring Market Outlook, By Industrial Facilities (2022-2030) ($MN)
36 Global Water Quality Monitoring Market Outlook, By Marine (2022-2030) ($MN)
37 Global Water Quality Monitoring Market Outlook, By Environmental Agencies (2022-2030) ($MN)
38 Global Water Quality Monitoring Market Outlook, By Research Institutions (2022-2030) ($MN)
39 Global Water Quality Monitoring Market Outlook, By Agriculture Sector (2022-2030) ($MN)
40 Global Water Quality Monitoring Market Outlook, By Residential Users (2022-2030) ($MN)
41 Global Water Quality Monitoring Market Outlook, By Other End Users (2022-2030) ($MN)
Note: Tables for North America, Europe, APAC, South America, and Middle East & Africa Regions are also represented in the same manner as above.
List of Figures
RESEARCH METHODOLOGY

We at ‘Stratistics’ opt for an extensive research approach which involves data mining, data validation, and data analysis. The various research sources include in-house repository, secondary research, competitor’s sources, social media research, client internal data, and primary research.
Our team of analysts prefers the most reliable and authenticated data sources in order to perform the comprehensive literature search. With access to most of the authenticated data bases our team highly considers the best mix of information through various sources to obtain extensive and accurate analysis.
Each report takes an average time of a month and a team of 4 industry analysts. The time may vary depending on the scope and data availability of the desired market report. The various parameters used in the market assessment are standardized in order to enhance the data accuracy.
Data Mining
The data is collected from several authenticated, reliable, paid and unpaid sources and is filtered depending on the scope & objective of the research. Our reports repository acts as an added advantage in this procedure. Data gathering from the raw material suppliers, distributors and the manufacturers is performed on a regular basis, this helps in the comprehensive understanding of the products value chain. Apart from the above mentioned sources the data is also collected from the industry consultants to ensure the objective of the study is in the right direction.
Market trends such as technological advancements, regulatory affairs, market dynamics (Drivers, Restraints, Opportunities and Challenges) are obtained from scientific journals, market related national & international associations and organizations.
Data Analysis
From the data that is collected depending on the scope & objective of the research the data is subjected for the analysis. The critical steps that we follow for the data analysis include:
- Product Lifecycle Analysis
- Competitor analysis
- Risk analysis
- Porters Analysis
- PESTEL Analysis
- SWOT Analysis
The data engineering is performed by the core industry experts considering both the Marketing Mix Modeling and the Demand Forecasting. The marketing mix modeling makes use of multiple-regression techniques to predict the optimal mix of marketing variables. Regression factor is based on a number of variables and how they relate to an outcome such as sales or profits.
Data Validation
The data validation is performed by the exhaustive primary research from the expert interviews. This includes telephonic interviews, focus groups, face to face interviews, and questionnaires to validate our research from all aspects. The industry experts we approach come from the leading firms, involved in the supply chain ranging from the suppliers, distributors to the manufacturers and consumers so as to ensure an unbiased analysis.
We are in touch with more than 15,000 industry experts with the right mix of consultants, CEO's, presidents, vice presidents, managers, experts from both supply side and demand side, executives and so on.
The data validation involves the primary research from the industry experts belonging to:
- Leading Companies
- Suppliers & Distributors
- Manufacturers
- Consumers
- Industry/Strategic Consultants
Apart from the data validation the primary research also helps in performing the fill gap research, i.e. providing solutions for the unmet needs of the research which helps in enhancing the reports quality.
For more details about research methodology, kindly write to us at info@strategymrc.com
Frequently Asked Questions
In case of any queries regarding this report, you can contact the customer service by filing the “Inquiry Before Buy” form available on the right hand side. You may also contact us through email: info@strategymrc.com or phone: +1-301-202-5929
Yes, the samples are available for all the published reports. You can request them by filling the “Request Sample” option available in this page.
Yes, you can request a sample with your specific requirements. All the customized samples will be provided as per the requirement with the real data masked.
All our reports are available in Digital PDF format. In case if you require them in any other formats, such as PPT, Excel etc you can submit a request through “Inquiry Before Buy” form available on the right hand side. You may also contact us through email: info@strategymrc.com or phone: +1-301-202-5929
We offer a free 15% customization with every purchase. This requirement can be fulfilled for both pre and post sale. You may send your customization requirements through email at info@strategymrc.com or call us on +1-301-202-5929.
We have 3 different licensing options available in electronic format.
- Single User Licence: Allows one person, typically the buyer, to have access to the ordered product. The ordered product cannot be distributed to anyone else.
- 2-5 User Licence: Allows the ordered product to be shared among a maximum of 5 people within your organisation.
- Corporate License: Allows the product to be shared among all employees of your organisation regardless of their geographical location.
All our reports are typically be emailed to you as an attachment.
To order any available report you need to register on our website. The payment can be made either through CCAvenue or PayPal payments gateways which accept all international cards.
We extend our support to 6 months post sale. A post sale customization is also provided to cover your unmet needs in the report.
Request Customization
We offer complimentary customization of up to 15% with every purchase. To share your customization requirements, feel free to email us at info@strategymrc.com or call us on +1-301-202-5929. .
Please Note: Customization within the 15% threshold is entirely free of charge. If your request exceeds this limit, we will conduct a feasibility assessment. Following that, a detailed quote and timeline will be provided.
WHY CHOOSE US ?

Assured Quality
Best in class reports with high standard of research integrity

24X7 Research Support
Continuous support to ensure the best customer experience.

Free Customization
Adding more values to your product of interest.

Safe & Secure Access
Providing a secured environment for all online transactions.

Trusted by 600+ Brands
Serving the most reputed brands across the world.