
Wetgas Meters Market
Wetgas Meters Market Forecasts to 2032 - Global Analysis By Type (Differential Pressure (DP) Meters, Ultrasonic Meters, Coriolis Meters, Vortex Meters, Positive Displacement Wet Gas Meters, and Other Types), Material Type, Application, End User and By Geography

|
Years Covered |
2024-2032 |
|
Estimated Year Value (2025) |
US $4.27 BN |
|
Projected Year Value (2032) |
US $7.32 BN |
|
CAGR (2025-2032) |
8.0% |
|
Regions Covered |
North America, Europe, Asia Pacific, South America, and Middle East & Africa |
|
Countries Covered |
US, Canada, Mexico, Germany, UK, Italy, France, Spain, Japan, China, India, Australia, New Zealand, South Korea, Rest of Asia Pacific, South America, Argentina, Brazil, Chile, Middle East & Africa, Saudi Arabia, UAE, Qatar, and South Africa |
|
Largest Market |
Asia Pacific |
|
Highest Growing Market |
North America |
According to Stratistics MRC, the Global Wetgas Meters Market is accounted for $4.27 billion in 2025 and is expected to reach $7.32 billion by 2032 growing at a CAGR of 8.0% during the forecast period. Wet gas meters are specialized flow measurement devices used to accurately quantify gas streams that contain varying amounts of liquid, such as water or hydrocarbons. These meters are essential in industries like oil and gas, where multiphase flow conditions are common. By compensating for the presence of liquid, wet gas meters provide reliable data for operational efficiency, safety, and regulatory compliance, especially in complex environments like offshore production and natural gas processing facilities.
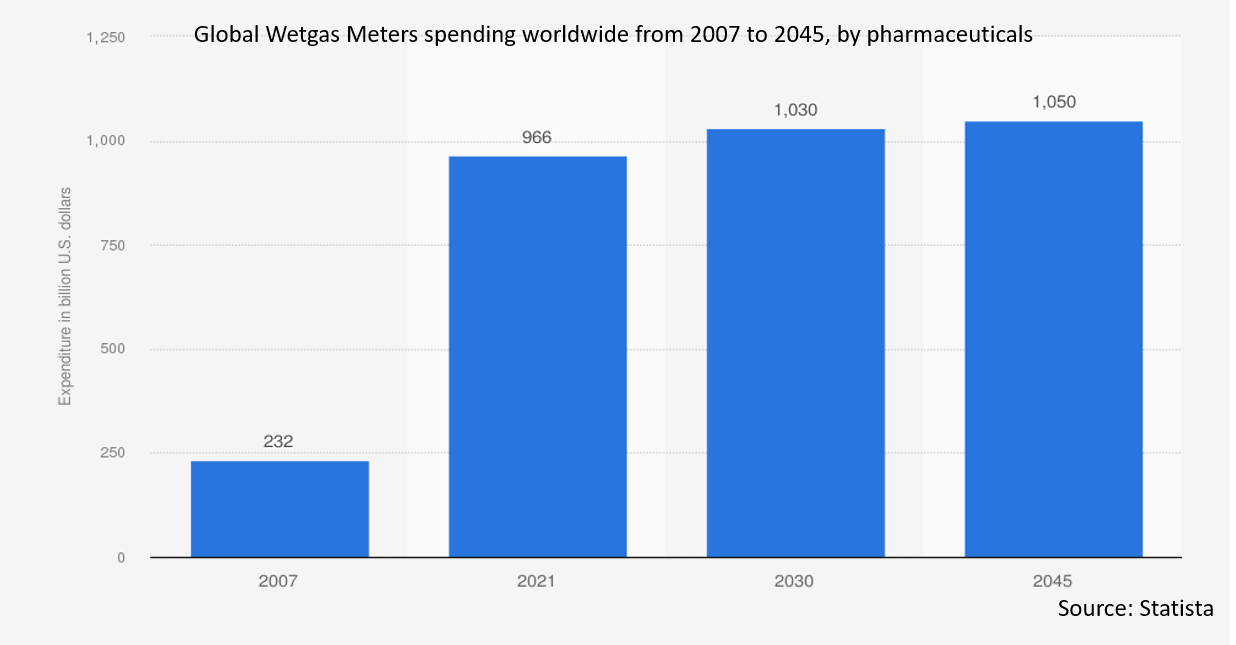
According to The European Chemical Industry Council, chemical sales in Europe is around USD 700 to 800 billion in 2022.
Market Dynamics:
Driver:
Integration of IoT and data analytics
IoT-enabled wetgas meters provide continuous data insights, reducing operational inefficiencies and improving accuracy. Advanced analytics allow companies to detect irregularities, optimize resource allocation, and enhance safety measures. Additionally, automation through AI-driven analytics minimizes manual intervention, leading to cost savings and increased efficiency. The adoption of IoT-based solutions is expanding across various industries, including oil and gas, as businesses seek to improve measurement precision. As technology advances, seamless connectivity and smart analytics will further drive innovation in wetgas metering applications.
Restraint:
Complex calibration and maintenance
Complex calibration and maintenance requirements act as significant restraints in the wetgas meters market. These meters, used to measure gas flow in the presence of liquids, demand precise calibration to ensure accuracy across varying flow conditions and fluid compositions. Calibration often requires specialized equipment and expert personnel, increasing operational costs and downtime. Moreover, frequent maintenance is necessary to prevent measurement drift and equipment degradation due to harsh operating environments. In offshore and remote installations, these challenges are magnified by accessibility issues and high service costs. Consequently, end-users may hesitate to adopt wetgas meters, limiting broader market penetration and growth potential.
Opportunity:
Advancements in hybrid metering technologies
The development of multi-sensor systems integrates various measurement techniques to improve accuracy in dynamic gas-liquid flow environments. These advanced systems enable precise monitoring of wetgas composition, reducing uncertainties in measurement data. Hybrid metering technologies also optimize energy consumption and enhance operational efficiency for industries such as oil and gas extraction. The growing adoption of AI-powered smart meters further supports advancements in this field, improving overall performance. Continuous R&D investments by major players are expected to drive the commercialization of next-generation wetgas meters.
Threat:
Fluctuating natural gas prices
Price volatility affects investment decisions, leading to uncertainty in procurement and deployment of wetgas meters. Companies hesitate to invest in advanced metering technologies due to unpredictable returns, impacting market growth. Additionally, fluctuating prices influence operational costs, forcing businesses to optimize expenses, sometimes at the cost of efficiency. The instability also affects supply chain dynamics, making it difficult for manufacturers to maintain steady production and pricing strategies.
Covid-19 Impact
The COVID-19 pandemic has impacted the Wetgas Meters Market, causing disruptions and accelerating innovations. Initial lockdowns and supply chain issues led to delays in meter installations and reduced oil and gas exploration demand. However, the pandemic emphasized the importance of automated monitoring solutions, driving investment in IoT-enabled metering systems. Companies incorporated AI-driven analytics to improve efficiency during restricted operations. Post-pandemic recovery efforts have boosted demand for advanced metering technologies, with a renewed focus on sustainability and efficiency expected to strengthen the market.
The vortex meters segment is expected to be the largest during the forecast period
The vortex meters segment is expected to account for the largest market share during the forecast period, due to its widespread application in wetgas flow measurement. These meters offer reliable accuracy and durability in high-pressure conditions, making them suitable for oil and gas operations. Vortex meters provide non-intrusive measurements, reducing maintenance requirements and operational downtime. Increasing automation in fluid measurement processes is driving demand for vortex meters.
The chemical segment is expected to have the highest CAGR during the forecast period
Over the forecast period, the chemical segment is predicted to witness the highest growth rate, due to increasing demand for precise wetgas measurement in chemical processing. Chemical plants require accurate flow monitoring to maintain product quality and optimize resource utilization. The implementation of wetgas meters enhances process efficiency by enabling real-time monitoring of gas-liquid mixtures. The growing emphasis on automation and IoT-based monitoring solutions is further accelerating the adoption of wetgas meters in the chemical sector.
Region with largest share:
During the forecast period, the Asia Pacific region is expected to hold the largest market share due to its booming industrial sector and increasing energy demand. The region's rapid urbanization and infrastructure development are driving the need for efficient metering technologies. Government initiatives promoting sustainable energy solutions and technological advancements support market growth. The presence of major industry players and research institutions in the region further fosters innovation in metering solutions.
Region with highest CAGR:
Over the forecast period, the North America region is anticipated to exhibit the highest CAGR, owing to technological advancements and strong industrial adoption of wetgas meters. The region benefits from advanced oil and gas extraction technologies and increasing investments in digital metering solutions. Supportive government policies promoting energy efficiency are further fuelling market expansion.

Key players in the market
Some of the key players profiled in the Wetgas Meters Market include Schlumberger (SLB), Baker Hughes, Emerson Electric Co., ABB Ltd., KROHNE Group, Honeywell International Inc., Siemens AG, TechnipFMC, Aker Solutions, Pietro Fiorentini S.p.a., Haimo Technologies, Weatherford International, Fluid Components International (FCI), Endress+Hauser Group Services AG, and Agar Corp.
Key Developments:
In March 2025, ABB and Charbone Hydrogen Corporation have signed a Memorandum of Understanding (MoU) agreement to collaborate on the development of up to 15 modular and scalable green hydrogen production facilities across North America over the next five years, providing a clean fuel source for existing hydrogen users and heavy industrial processes such as steelmaking, which currently use grey hydrogen as an energy source.
In March 2025, Honeywell announced that it has agreed to acquire Sundyne from private equity firm Warburg Pincus for $2.16 billion in an all-cash transaction. This represents approximately 14.5x 2024 EBITDA on a tax-adjusted basis. Sundyne is a leader in the design, manufacturing and aftermarket support of highly-engineered pumps and gas compressors used in process industries.
Types Covered:
• Differential Pressure (DP) Meters
• Ultrasonic Meters
• Coriolis Meters
• Vortex Meters
• Positive Displacement Wet Gas Meters
• Other Types
Material Types Covered:
• Brass Wet Gas Meters
• Stainless Steel Wet Gas Meters
• Thermoplastic Wet Gas Meters
• Other Material Types
Applications Covered:
• Well Testing
• Hydrocarbon Metering
• Production Allocation
• Process Management
• Flow Assurance
• Environmental Monitoring
• Custody Transfer
• Other Applications
End Users Covered:
• Oil & Gas
• Chemical
• Power Generation
• City Gas Distribution (CGD)
• Biogas Production
• Pharmaceuticals
• Research & Laboratory
• Other End Users
Regions Covered:
• North America
o US
o Canada
o Mexico
• Europe
o Germany
o UK
o Italy
o France
o Spain
o Rest of Europe
• Asia Pacific
o Japan
o China
o India
o Australia
o New Zealand
o South Korea
o Rest of Asia Pacific
• South America
o Argentina
o Brazil
o Chile
o Rest of South America
• Middle East & Africa
o Saudi Arabia
o UAE
o Qatar
o South Africa
o Rest of Middle East & Africa
What our report offers:
- Market share assessments for the regional and country-level segments
- Strategic recommendations for the new entrants
- Covers Market data for the years 2024, 2025, 2026, 2028, and 2032
- Market Trends (Drivers, Constraints, Opportunities, Threats, Challenges, Investment Opportunities, and recommendations)
- Strategic recommendations in key business segments based on the market estimations
- Competitive landscaping mapping the key common trends
- Company profiling with detailed strategies, financials, and recent developments
- Supply chain trends mapping the latest technological advancements
Free Customization Offerings:
All the customers of this report will be entitled to receive one of the following free customization options:
• Company Profiling
o Comprehensive profiling of additional market players (up to 3)
o SWOT Analysis of key players (up to 3)
• Regional Segmentation
o Market estimations, Forecasts and CAGR of any prominent country as per the client's interest (Note: Depends on feasibility check)
• Competitive Benchmarking
o Benchmarking of key players based on product portfolio, geographical presence, and strategic alliances
Table of Contents
1 Executive Summary
2 Preface
2.1 Abstract
2.2 Stake Holders
2.3 Research Scope
2.4 Research Methodology
2.4.1 Data Mining
2.4.2 Data Analysis
2.4.3 Data Validation
2.4.4 Research Approach
2.5 Research Sources
2.5.1 Primary Research Sources
2.5.2 Secondary Research Sources
2.5.3 Assumptions
3 Market Trend Analysis
3.1 Introduction
3.2 Drivers
3.3 Restraints
3.4 Opportunities
3.5 Threats
3.6 Application Analysis
3.7 End User Analysis
3.8 Emerging Markets
3.9 Impact of Covid-19
4 Porters Five Force Analysis
4.1 Bargaining power of suppliers
4.2 Bargaining power of buyers
4.3 Threat of substitutes
4.4 Threat of new entrants
4.5 Competitive rivalry
5 Global Wetgas Meters Market, By Type
5.1 Introduction
5.2 Differential Pressure (DP) Meters
5.3 Ultrasonic Meters
5.4 Coriolis Meters
5.5 Vortex Meters
5.6 Positive Displacement Wet Gas Meters
5.7 Other Types
6 Global Wetgas Meters Market, By Material Type
6.1 Introduction
6.2 Brass Wet Gas Meters
6.3 Stainless Steel Wet Gas Meters
6.4 Thermoplastic Wet Gas Meters
6.5 Other Material Types
7 Global Wetgas Meters Market, By Application
7.1 Introduction
7.2 Well Testing
7.3 Hydrocarbon Metering
7.4 Production Allocation
7.5 Process Management
7.6 Flow Assurance
7.7 Environmental Monitoring
7.8 Custody Transfer
7.9 Other Applications
8 Global Wetgas Meters Market, By End User
8.1 Introduction
8.2 Oil & Gas
8.3 Chemical
8.4 Power Generation
8.5 City Gas Distribution (CGD)
8.6 Biogas Production
8.7 Pharmaceuticals
8.8 Research & Laboratory
8.9 Other End Users
9 Global Wetgas Meters Market, By Geography
9.1 Introduction
9.2 North America
9.2.1 US
9.2.2 Canada
9.2.3 Mexico
9.3 Europe
9.3.1 Germany
9.3.2 UK
9.3.3 Italy
9.3.4 France
9.3.5 Spain
9.3.6 Rest of Europe
9.4 Asia Pacific
9.4.1 Japan
9.4.2 China
9.4.3 India
9.4.4 Australia
9.4.5 New Zealand
9.4.6 South Korea
9.4.7 Rest of Asia Pacific
9.5 South America
9.5.1 Argentina
9.5.2 Brazil
9.5.3 Chile
9.5.4 Rest of South America
9.6 Middle East & Africa
9.6.1 Saudi Arabia
9.6.2 UAE
9.6.3 Qatar
9.6.4 South Africa
9.6.5 Rest of Middle East & Africa
10 Key Developments
10.1 Agreements, Partnerships, Collaborations and Joint Ventures
10.2 Acquisitions & Mergers
10.3 New Product Launch
10.4 Expansions
10.5 Other Key Strategies
11 Company Profiling
11.1 Schlumberger (SLB)
11.2 Baker Hughes
11.3 Emerson Electric Co.
11.4 ABB Ltd.
11.5 KROHNE Group
11.6 Honeywell International Inc.
11.7 Siemens AG
11.8 TechnipFMC
11.9 Aker Solutions
11.10 Pietro Fiorentini S.p.a.
11.11 Haimo Technologies
11.12 Weatherford International
11.13 Fluid Components International (FCI)
11.14 Endress+Hauser Group Services AG
11.15 Agar Corp.
List of Tables
1 Global Wetgas Meters Market Outlook, By Region (2024-2032) ($MN)
2 Global Wetgas Meters Market Outlook, By Type (2024-2032) ($MN)
3 Global Wetgas Meters Market Outlook, By Differential Pressure (DP) Meters (2024-2032) ($MN)
4 Global Wetgas Meters Market Outlook, By Ultrasonic Meters (2024-2032) ($MN)
5 Global Wetgas Meters Market Outlook, By Coriolis Meters (2024-2032) ($MN)
6 Global Wetgas Meters Market Outlook, By Vortex Meters (2024-2032) ($MN)
7 Global Wetgas Meters Market Outlook, By Positive Displacement Wet Gas Meters (2024-2032) ($MN)
8 Global Wetgas Meters Market Outlook, By Other Types (2024-2032) ($MN)
9 Global Wetgas Meters Market Outlook, By Material Type (2024-2032) ($MN)
10 Global Wetgas Meters Market Outlook, By Brass Wet Gas Meters (2024-2032) ($MN)
11 Global Wetgas Meters Market Outlook, By Stainless Steel Wet Gas Meters (2024-2032) ($MN)
12 Global Wetgas Meters Market Outlook, By Thermoplastic Wet Gas Meters (2024-2032) ($MN)
13 Global Wetgas Meters Market Outlook, By Other Material Types (2024-2032) ($MN)
14 Global Wetgas Meters Market Outlook, By Application (2024-2032) ($MN)
15 Global Wetgas Meters Market Outlook, By Well Testing (2024-2032) ($MN)
16 Global Wetgas Meters Market Outlook, By Hydrocarbon Metering (2024-2032) ($MN)
17 Global Wetgas Meters Market Outlook, By Production Allocation (2024-2032) ($MN)
18 Global Wetgas Meters Market Outlook, By Process Management (2024-2032) ($MN)
19 Global Wetgas Meters Market Outlook, By Flow Assurance (2024-2032) ($MN)
20 Global Wetgas Meters Market Outlook, By Environmental Monitoring (2024-2032) ($MN)
21 Global Wetgas Meters Market Outlook, By Custody Transfer (2024-2032) ($MN)
22 Global Wetgas Meters Market Outlook, By Other Applications (2024-2032) ($MN)
23 Global Wetgas Meters Market Outlook, By End User (2024-2032) ($MN)
24 Global Wetgas Meters Market Outlook, By Oil & Gas (2024-2032) ($MN)
25 Global Wetgas Meters Market Outlook, By Chemical (2024-2032) ($MN)
26 Global Wetgas Meters Market Outlook, By Power Generation (2024-2032) ($MN)
27 Global Wetgas Meters Market Outlook, By City Gas Distribution (CGD) (2024-2032) ($MN)
28 Global Wetgas Meters Market Outlook, By Biogas Production (2024-2032) ($MN)
29 Global Wetgas Meters Market Outlook, By Pharmaceuticals (2024-2032) ($MN)
30 Global Wetgas Meters Market Outlook, By Research & Laboratory (2024-2032) ($MN)
31 Global Wetgas Meters Market Outlook, By Other End Users (2024-2032) ($MN)
Note: Tables for North America, Europe, APAC, South America, and Middle East & Africa Regions are also represented in the same manner as above.
List of Figures
RESEARCH METHODOLOGY

We at ‘Stratistics’ opt for an extensive research approach which involves data mining, data validation, and data analysis. The various research sources include in-house repository, secondary research, competitor’s sources, social media research, client internal data, and primary research.
Our team of analysts prefers the most reliable and authenticated data sources in order to perform the comprehensive literature search. With access to most of the authenticated data bases our team highly considers the best mix of information through various sources to obtain extensive and accurate analysis.
Each report takes an average time of a month and a team of 4 industry analysts. The time may vary depending on the scope and data availability of the desired market report. The various parameters used in the market assessment are standardized in order to enhance the data accuracy.
Data Mining
The data is collected from several authenticated, reliable, paid and unpaid sources and is filtered depending on the scope & objective of the research. Our reports repository acts as an added advantage in this procedure. Data gathering from the raw material suppliers, distributors and the manufacturers is performed on a regular basis, this helps in the comprehensive understanding of the products value chain. Apart from the above mentioned sources the data is also collected from the industry consultants to ensure the objective of the study is in the right direction.
Market trends such as technological advancements, regulatory affairs, market dynamics (Drivers, Restraints, Opportunities and Challenges) are obtained from scientific journals, market related national & international associations and organizations.
Data Analysis
From the data that is collected depending on the scope & objective of the research the data is subjected for the analysis. The critical steps that we follow for the data analysis include:
- Product Lifecycle Analysis
- Competitor analysis
- Risk analysis
- Porters Analysis
- PESTEL Analysis
- SWOT Analysis
The data engineering is performed by the core industry experts considering both the Marketing Mix Modeling and the Demand Forecasting. The marketing mix modeling makes use of multiple-regression techniques to predict the optimal mix of marketing variables. Regression factor is based on a number of variables and how they relate to an outcome such as sales or profits.
Data Validation
The data validation is performed by the exhaustive primary research from the expert interviews. This includes telephonic interviews, focus groups, face to face interviews, and questionnaires to validate our research from all aspects. The industry experts we approach come from the leading firms, involved in the supply chain ranging from the suppliers, distributors to the manufacturers and consumers so as to ensure an unbiased analysis.
We are in touch with more than 15,000 industry experts with the right mix of consultants, CEO's, presidents, vice presidents, managers, experts from both supply side and demand side, executives and so on.
The data validation involves the primary research from the industry experts belonging to:
- Leading Companies
- Suppliers & Distributors
- Manufacturers
- Consumers
- Industry/Strategic Consultants
Apart from the data validation the primary research also helps in performing the fill gap research, i.e. providing solutions for the unmet needs of the research which helps in enhancing the reports quality.
For more details about research methodology, kindly write to us at info@strategymrc.com
Frequently Asked Questions
In case of any queries regarding this report, you can contact the customer service by filing the “Inquiry Before Buy” form available on the right hand side. You may also contact us through email: info@strategymrc.com or phone: +1-301-202-5929
Yes, the samples are available for all the published reports. You can request them by filling the “Request Sample” option available in this page.
Yes, you can request a sample with your specific requirements. All the customized samples will be provided as per the requirement with the real data masked.
All our reports are available in Digital PDF format. In case if you require them in any other formats, such as PPT, Excel etc you can submit a request through “Inquiry Before Buy” form available on the right hand side. You may also contact us through email: info@strategymrc.com or phone: +1-301-202-5929
We offer a free 15% customization with every purchase. This requirement can be fulfilled for both pre and post sale. You may send your customization requirements through email at info@strategymrc.com or call us on +1-301-202-5929.
We have 3 different licensing options available in electronic format.
- Single User Licence: Allows one person, typically the buyer, to have access to the ordered product. The ordered product cannot be distributed to anyone else.
- 2-5 User Licence: Allows the ordered product to be shared among a maximum of 5 people within your organisation.
- Corporate License: Allows the product to be shared among all employees of your organisation regardless of their geographical location.
All our reports are typically be emailed to you as an attachment.
To order any available report you need to register on our website. The payment can be made either through CCAvenue or PayPal payments gateways which accept all international cards.
We extend our support to 6 months post sale. A post sale customization is also provided to cover your unmet needs in the report.
Request Customization
We offer complimentary customization of up to 15% with every purchase. To share your customization requirements, feel free to email us at info@strategymrc.com or call us on +1-301-202-5929. .
Please Note: Customization within the 15% threshold is entirely free of charge. If your request exceeds this limit, we will conduct a feasibility assessment. Following that, a detailed quote and timeline will be provided.
WHY CHOOSE US ?

Assured Quality
Best in class reports with high standard of research integrity

24X7 Research Support
Continuous support to ensure the best customer experience.

Free Customization
Adding more values to your product of interest.

Safe & Secure Access
Providing a secured environment for all online transactions.

Trusted by 600+ Brands
Serving the most reputed brands across the world.