
Wind Powered Water Pumps Market
Wind Powered Water Pumps Market Forecasts to 2032 - Global Analysis By Type (Electrical Pumps and Mechanical Pumps), Component (Mild Steel Frames, Pneumatic Cylinders, Rotor Blades, Slider Crank Disc, Shafts, Ball Bearings and Other Components), Capacity, End User and By Geography

|
Years Covered |
2024-2032 |
|
Estimated Year Value (2025) |
US $3.07 BN |
|
Projected Year Value (2032) |
US $6.06 BN |
|
CAGR (2025 - 2032) |
10.2% |
|
Regions Covered |
North America, Europe, Asia Pacific, South America, and Middle East & Africa |
|
Countries Covered |
US, Canada, Mexico, Germany, UK, Italy, France, Spain, Japan, China, India, Australia, New Zealand, South Korea, Rest of Asia Pacific, South America, Argentina, Brazil, Chile, Middle East & Africa, Saudi Arabia, UAE, Qatar, and South Africa |
|
Largest Market |
Asia Pacific |
|
Highest Growing Market |
North America |
According to Stratistics MRC, the Global Wind Powered Water Pumps Market is accounted for $3.07 billion in 2025 and is expected to reach $6.06 billion by 2032 growing at a CAGR of 10.2% during the forecast period. Wind-powered water pumps use wind energy to move water, usually for rural or agricultural water supply applications. Water is lifted or moved from wells, boreholes, or surface sources using these systems, which use wind turbines to transform wind energy into mechanical power that powers a pump, usually a rotary or piston pump. Wind-powered water pumps provide an economical and environmentally friendly option for irrigation, livestock watering, and even small-scale household use, making them perfect for isolated locations with poor electrical connectivity. Moreover, eco-friendly water management strategies can benefit greatly from their low operating expenses and minimal environmental impact.
According to the International Renewable Energy Agency (IRENA), renewable energy sources, including wind power, accounted for 29% of global electricity generation in 2020, and this share is expected to grow significantly by 2030.
Market Dynamics:
Driver:
Increasing attention to renewable and sustainable energy
Wind energy has become a major renewable resource as the world's energy landscape changes toward low-carbon alternatives. This trend is supported by wind-powered water pumps, which provide a zero-emission means of distributing and lifting water, particularly in agriculture. Additionally, to lessen dependency on fossil fuels, governments and international organizations like the International Renewable Energy Agency (IRENA) aggressively support wind-based technologies. Demand for these green technologies is being driven by increased investment in response to the growing urgency to meet climate targets and reduce greenhouse gas emissions.
Restraint:
Expensive initial installation fees
The initial expenses of wind-powered water pumps can be prohibitive, particularly for smallholder farmers and rural communities in developing nations, even though they provide long-term savings. The windmill structure, pump mechanism, tower installation, and occasionally site preparation and transportation are all included in the costs. These expenses are frequently greater than those of solar or traditional diesel pump systems. Furthermore, the capital barrier may deter adoption in places where financing is scarce or subsidies are not available, especially for low-income users who value affordability in the short term over sustainability in the long run.
Opportunity:
Integration with programs for climate-resilient agriculture
A growing number of nations are investing in climate-smart agriculture (CSA) as climate change poses a greater threat to agricultural productivity. Because wind-powered water pumps are emission-free, have minimal operating costs, and are not dependent on fossil fuels, they can be positioned as a crucial component of CSA. Better management of limited water resources is also made possible by them. Moreover, governments, NGOs, and multilateral development banks are likely to back initiatives that incorporate wind pumps into programs for drought resilience, soil conservation, or sustainable farming, creating new avenues for adoption and funding.
Threat:
Limited after-sales support and technical expertise
Wind-powered water pumps, especially mechanical ones, require specialized knowledge to install and maintain. There are not enough skilled technicians in many rural areas to install or fix these systems correctly. Users may choose technologies with more accessible service networks over wind systems if there is a lack of robust after-sales support and easily accessible spare parts. Additionally, this hinders the growth of emerging markets by eroding trust in wind pump dependability and limiting word-of-mouth advertising.
Covid-19 Impact:
The COVID-19 pandemic affected the market for wind-powered water pumps in a variety of ways. The industry was disrupted in the short term by labor shortages, supply chain failures, and delays in the production and installation of pump systems, especially in infrastructure and rural development projects. Additionally, in developing nations, lockdowns and travel restrictions made it difficult to deploy projects and provide maintenance services. But the pandemic also increased interest in resilient and decentralized water infrastructure, as governments and community’s prioritized off-grid, sustainable solutions to guarantee water access in times of emergency.
The rotor blades segment is expected to be the largest during the forecast period
The rotor blades segment is expected to account for the largest market share during the forecast period. Wind energy is captured by rotor blades, which then transform it into rotational motion that powers the pump. They are the most important and extensively utilized market segment since their effectiveness and design have a direct impact on the pump's output and performance. Rotor blades can operate efficiently in a variety of wind conditions because they are designed for longevity and optimal aerodynamic performance. Furthermore, rotor blades' significance in these systems guarantees their leading position in the market's expansion, as wind-powered water pumps are utilized in isolated areas for irrigation, livestock watering, and other agricultural requirements.
The irrigation segment is expected to have the highest CAGR during the forecast period
Over the forecast period, the irrigation segment is predicted to witness the highest growth rate, driven by the growing use of irrigation systems powered by wind to increase crop yields and lessen dependency on conventional water sources. The need for effective water management solutions in rural areas, government incentives encouraging the adoption of renewable energy, and the growing demand for sustainable farming practices are some of the factors contributing to this growth. Moreover, wind-powered water pumps support the growth of the agricultural sector by providing a dependable and affordable irrigation solution, especially in areas with limited access to electricity.
Region with largest share:
During the forecast period, the Asia Pacific region is expected to hold the largest market share. Countries like China and India are the main drivers of this dominance because of their sizable rural populations and extensive agricultural sectors, which generate a high demand for environmentally friendly water pumping solutions. Government programs that support market expansion include India's National Wind-Solar Hybrid Policy, which aims to install 10,000 wind-powered water pumps. Additionally, APAC is positioned as a major player in the market for wind-powered water pumps due to the region's emphasis on the adoption of renewable energy sources and the necessity of effective water management in agriculture.
Region with highest CAGR:
Over the forecast period, the North American region is anticipated to exhibit the highest CAGR. The main drivers of this expansion are the rising demand for renewable energy sources and the existence of advantageous laws supporting environmentally friendly water management techniques. North America had a substantial 35% market share in the global market for wind-powered water pumps in 2023. Furthermore, the market's growth is anticipated to be further fueled in the upcoming years by the region's dedication to implementing green technologies and tackling the issues of water scarcity.

Key players in the market
Some of the key players in Wind Powered Water Pumps Market include CNP Pumps India Pvt Ltd., Aermotor Windmill Company Inc., EcoInnovation Ltd., GE Renewable Energy, Bergey Windpower Co., Grundfos Holding A/S, Lorentz, WindEnergy7 LLC, Suzlon Energy Ltd., QED Environmental Systems Ltd, Sweco AB, Lone Star Windmill Company LLC, Graco Inc., Kijito Windpower Ltd and Airwell Group Pty Ltd.
Key Developments:
In January 2025, Suzlon Energy Ltd. and Torrent Power Ltd. said they secured a 486 megawatt wind power contract in Gujarat. The deal value was not disclosed. Under the agreement, Suzlon will supply 162 state?of?the?art S144 wind turbine generators with hybrid lattice towers, each rated at 3 MW capacity in the Bhogat region in Gujarat, according to an exchange filing.
In September 2023, Lorentz and Xylem Inc announced they will enter into a distribution agreement to expand the availability of solar-powered pumping systems, globally. These sustainable pumping solutions are commonly used in agriculture, irrigation and drinking water applications, enabling water managers to address decarbonization goals while reducing operating costs.
In December 2022, GE Renewable Energy and Hyundai Electric announced that they have signed a strategic partnership agreement as the next step in their efforts to work together to serve the South Korean offshore wind market. Under the terms of the agreement, Hyundai Electric will serve as a manufacturing associate to help localize assembly of the Haliade-X offshore wind turbines and generators in South Korea.
Types Covered:
• Electrical Pumps
• Mechanical Pumps
Components Covered:
• Mild Steel Frames
• Pneumatic Cylinders
• Rotor Blades
• Slider Crank Disc
• Shafts
• Ball Bearings
• Other Components
Capacities Covered:
• Less than 2.5 kWh
• 2.5 to 10 kWh
• Greater than 10 kWh
End Users Covered:
• Irrigation
• Off-grid Water Supply
• Water Treatment Plants
• Other End Users
Regions Covered:
• North America
o US
o Canada
o Mexico
• Europe
o Germany
o UK
o Italy
o France
o Spain
o Rest of Europe
• Asia Pacific
o Japan
o China
o India
o Australia
o New Zealand
o South Korea
o Rest of Asia Pacific
• South America
o Argentina
o Brazil
o Chile
o Rest of South America
• Middle East & Africa
o Saudi Arabia
o UAE
o Qatar
o South Africa
o Rest of Middle East & Africa
What our report offers:
- Market share assessments for the regional and country-level segments
- Strategic recommendations for the new entrants
- Covers Market data for the years 2024, 2025, 2026, 2028, and 2032
- Market Trends (Drivers, Constraints, Opportunities, Threats, Challenges, Investment Opportunities, and recommendations)
- Strategic recommendations in key business segments based on the market estimations
- Competitive landscaping mapping the key common trends
- Company profiling with detailed strategies, financials, and recent developments
- Supply chain trends mapping the latest technological advancements
Free Customization Offerings:
All the customers of this report will be entitled to receive one of the following free customization options:
• Company Profiling
o Comprehensive profiling of additional market players (up to 3)
o SWOT Analysis of key players (up to 3)
• Regional Segmentation
o Market estimations, Forecasts and CAGR of any prominent country as per the client's interest (Note: Depends on feasibility check)
• Competitive Benchmarking
o Benchmarking of key players based on product portfolio, geographical presence, and strategic alliances
Table of Contents
1 Executive Summary
2 Preface
2.1 Abstract
2.2 Stake Holders
2.3 Research Scope
2.4 Research Methodology
2.4.1 Data Mining
2.4.2 Data Analysis
2.4.3 Data Validation
2.4.4 Research Approach
2.5 Research Sources
2.5.1 Primary Research Sources
2.5.2 Secondary Research Sources
2.5.3 Assumptions
3 Market Trend Analysis
3.1 Introduction
3.2 Drivers
3.3 Restraints
3.4 Opportunities
3.5 Threats
3.6 End User Analysis
3.7 Emerging Markets
3.8 Impact of Covid-19
4 Porters Five Force Analysis
4.1 Bargaining power of suppliers
4.2 Bargaining power of buyers
4.3 Threat of substitutes
4.4 Threat of new entrants
4.5 Competitive rivalry
5 Global Wind Powered Water Pumps Market, By Type
5.1 Introduction
5.2 Electrical Pumps
5.3 Mechanical Pumps
6 Global Wind Powered Water Pumps Market, By Component
6.1 Introduction
6.2 Mild Steel Frames
6.3 Pneumatic Cylinders
6.4 Rotor Blades
6.5 Slider Crank Disc
6.6 Shafts
6.7 Ball Bearings
6.8 Other Components
7 Global Wind Powered Water Pumps Market, By Capacity
7.1 Introduction
7.2 Less than 2.5 kWh
7.3 2.5 to 10 kWh
7.4 Greater than 10 kWh
8 Global Wind Powered Water Pumps Market, By End User
8.1 Introduction
8.2 Irrigation
8.3 Off-grid Water Supply
8.4 Water Treatment Plants
8.5 Other End Users
9 Global Wind Powered Water Pumps Market, By Geography
9.1 Introduction
9.2 North America
9.2.1 US
9.2.2 Canada
9.2.3 Mexico
9.3 Europe
9.3.1 Germany
9.3.2 UK
9.3.3 Italy
9.3.4 France
9.3.5 Spain
9.3.6 Rest of Europe
9.4 Asia Pacific
9.4.1 Japan
9.4.2 China
9.4.3 India
9.4.4 Australia
9.4.5 New Zealand
9.4.6 South Korea
9.4.7 Rest of Asia Pacific
9.5 South America
9.5.1 Argentina
9.5.2 Brazil
9.5.3 Chile
9.5.4 Rest of South America
9.6 Middle East & Africa
9.6.1 Saudi Arabia
9.6.2 UAE
9.6.3 Qatar
9.6.4 South Africa
9.6.5 Rest of Middle East & Africa
10 Key Developments
10.1 Agreements, Partnerships, Collaborations and Joint Ventures
10.2 Acquisitions & Mergers
10.3 New Product Launch
10.4 Expansions
10.5 Other Key Strategies
11 Company Profiling
11.1 CNP Pumps India Pvt Ltd.
11.2 Aermotor Windmill Company Inc.
11.3 EcoInnovation Ltd.
11.4 GE Renewable Energy
11.5 Bergey Windpower Co.
11.6 Grundfos Holding A/S
11.7 Lorentz
11.8 WindEnergy7 LLC
11.9 Suzlon Energy Ltd.
11.10 QED Environmental Systems Ltd
11.11 Sweco AB
11.12 Lone Star Windmill Company LLC
11.13 Graco Inc.
11.14 Kijito Windpower Ltd
11.15 Airwell Group Pty Ltd
List of Tables
1 Global Wind Powered Water Pumps Market Outlook, By Region (2024-2032) ($MN)
2 Global Wind Powered Water Pumps Market Outlook, By Type (2024-2032) ($MN)
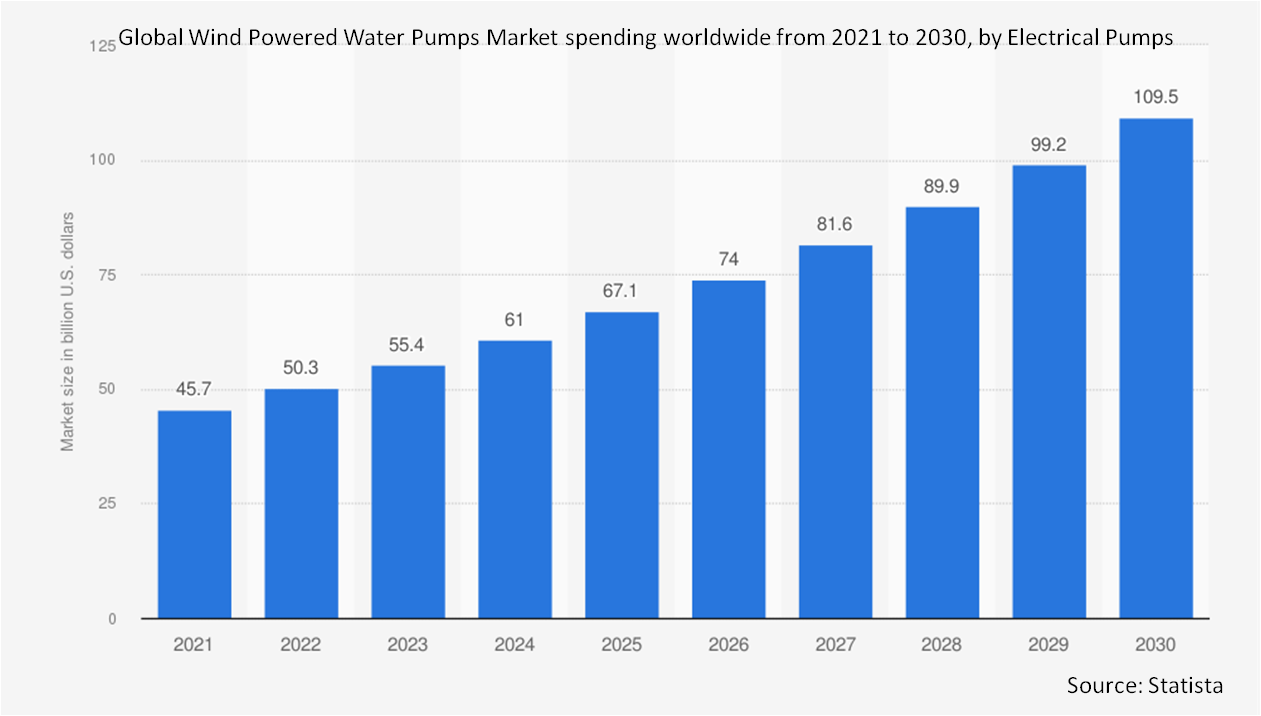
3 Global Wind Powered Water Pumps Market Outlook, By Electrical Pumps (2024-2032) ($MN)
4 Global Wind Powered Water Pumps Market Outlook, By Mechanical Pumps (2024-2032) ($MN)
5 Global Wind Powered Water Pumps Market Outlook, By Component (2024-2032) ($MN)
6 Global Wind Powered Water Pumps Market Outlook, By Mild Steel Frames (2024-2032) ($MN)
7 Global Wind Powered Water Pumps Market Outlook, By Pneumatic Cylinders (2024-2032) ($MN)
8 Global Wind Powered Water Pumps Market Outlook, By Rotor Blades (2024-2032) ($MN)
9 Global Wind Powered Water Pumps Market Outlook, By Slider Crank Disc (2024-2032) ($MN)
10 Global Wind Powered Water Pumps Market Outlook, By Shafts (2024-2032) ($MN)
11 Global Wind Powered Water Pumps Market Outlook, By Ball Bearings (2024-2032) ($MN)
12 Global Wind Powered Water Pumps Market Outlook, By Other Components (2024-2032) ($MN)
13 Global Wind Powered Water Pumps Market Outlook, By Capacity (2024-2032) ($MN)
14 Global Wind Powered Water Pumps Market Outlook, By Less than 2.5 kWh (2024-2032) ($MN)
15 Global Wind Powered Water Pumps Market Outlook, By 2.5 to 10 kWh (2024-2032) ($MN)
16 Global Wind Powered Water Pumps Market Outlook, By Greater than 10 kWh (2024-2032) ($MN)
17 Global Wind Powered Water Pumps Market Outlook, By End User (2024-2032) ($MN)
18 Global Wind Powered Water Pumps Market Outlook, By Irrigation (2024-2032) ($MN)
19 Global Wind Powered Water Pumps Market Outlook, By Off-grid Water Supply (2024-2032) ($MN)
20 Global Wind Powered Water Pumps Market Outlook, By Water Treatment Plants (2024-2032) ($MN)
21 Global Wind Powered Water Pumps Market Outlook, By Other End Users (2024-2032) ($MN)
22 North America Wind Powered Water Pumps Market Outlook, By Country (2024-2032) ($MN)
23 North America Wind Powered Water Pumps Market Outlook, By Type (2024-2032) ($MN)
24 North America Wind Powered Water Pumps Market Outlook, By Electrical Pumps (2024-2032) ($MN)
25 North America Wind Powered Water Pumps Market Outlook, By Mechanical Pumps (2024-2032) ($MN)
26 North America Wind Powered Water Pumps Market Outlook, By Component (2024-2032) ($MN)
27 North America Wind Powered Water Pumps Market Outlook, By Mild Steel Frames (2024-2032) ($MN)
28 North America Wind Powered Water Pumps Market Outlook, By Pneumatic Cylinders (2024-2032) ($MN)
29 North America Wind Powered Water Pumps Market Outlook, By Rotor Blades (2024-2032) ($MN)
30 North America Wind Powered Water Pumps Market Outlook, By Slider Crank Disc (2024-2032) ($MN)
31 North America Wind Powered Water Pumps Market Outlook, By Shafts (2024-2032) ($MN)
32 North America Wind Powered Water Pumps Market Outlook, By Ball Bearings (2024-2032) ($MN)
33 North America Wind Powered Water Pumps Market Outlook, By Other Components (2024-2032) ($MN)
34 North America Wind Powered Water Pumps Market Outlook, By Capacity (2024-2032) ($MN)
35 North America Wind Powered Water Pumps Market Outlook, By Less than 2.5 kWh (2024-2032) ($MN)
36 North America Wind Powered Water Pumps Market Outlook, By 2.5 to 10 kWh (2024-2032) ($MN)
37 North America Wind Powered Water Pumps Market Outlook, By Greater than 10 kWh (2024-2032) ($MN)
38 North America Wind Powered Water Pumps Market Outlook, By End User (2024-2032) ($MN)
39 North America Wind Powered Water Pumps Market Outlook, By Irrigation (2024-2032) ($MN)
40 North America Wind Powered Water Pumps Market Outlook, By Off-grid Water Supply (2024-2032) ($MN)
41 North America Wind Powered Water Pumps Market Outlook, By Water Treatment Plants (2024-2032) ($MN)
42 North America Wind Powered Water Pumps Market Outlook, By Other End Users (2024-2032) ($MN)
43 Europe Wind Powered Water Pumps Market Outlook, By Country (2024-2032) ($MN)
44 Europe Wind Powered Water Pumps Market Outlook, By Type (2024-2032) ($MN)
45 Europe Wind Powered Water Pumps Market Outlook, By Electrical Pumps (2024-2032) ($MN)
46 Europe Wind Powered Water Pumps Market Outlook, By Mechanical Pumps (2024-2032) ($MN)
47 Europe Wind Powered Water Pumps Market Outlook, By Component (2024-2032) ($MN)
48 Europe Wind Powered Water Pumps Market Outlook, By Mild Steel Frames (2024-2032) ($MN)
49 Europe Wind Powered Water Pumps Market Outlook, By Pneumatic Cylinders (2024-2032) ($MN)
50 Europe Wind Powered Water Pumps Market Outlook, By Rotor Blades (2024-2032) ($MN)
51 Europe Wind Powered Water Pumps Market Outlook, By Slider Crank Disc (2024-2032) ($MN)
52 Europe Wind Powered Water Pumps Market Outlook, By Shafts (2024-2032) ($MN)
53 Europe Wind Powered Water Pumps Market Outlook, By Ball Bearings (2024-2032) ($MN)
54 Europe Wind Powered Water Pumps Market Outlook, By Other Components (2024-2032) ($MN)
55 Europe Wind Powered Water Pumps Market Outlook, By Capacity (2024-2032) ($MN)
56 Europe Wind Powered Water Pumps Market Outlook, By Less than 2.5 kWh (2024-2032) ($MN)
57 Europe Wind Powered Water Pumps Market Outlook, By 2.5 to 10 kWh (2024-2032) ($MN)
58 Europe Wind Powered Water Pumps Market Outlook, By Greater than 10 kWh (2024-2032) ($MN)
59 Europe Wind Powered Water Pumps Market Outlook, By End User (2024-2032) ($MN)
60 Europe Wind Powered Water Pumps Market Outlook, By Irrigation (2024-2032) ($MN)
61 Europe Wind Powered Water Pumps Market Outlook, By Off-grid Water Supply (2024-2032) ($MN)
62 Europe Wind Powered Water Pumps Market Outlook, By Water Treatment Plants (2024-2032) ($MN)
63 Europe Wind Powered Water Pumps Market Outlook, By Other End Users (2024-2032) ($MN)
64 Asia Pacific Wind Powered Water Pumps Market Outlook, By Country (2024-2032) ($MN)
65 Asia Pacific Wind Powered Water Pumps Market Outlook, By Type (2024-2032) ($MN)
66 Asia Pacific Wind Powered Water Pumps Market Outlook, By Electrical Pumps (2024-2032) ($MN)
67 Asia Pacific Wind Powered Water Pumps Market Outlook, By Mechanical Pumps (2024-2032) ($MN)
68 Asia Pacific Wind Powered Water Pumps Market Outlook, By Component (2024-2032) ($MN)
69 Asia Pacific Wind Powered Water Pumps Market Outlook, By Mild Steel Frames (2024-2032) ($MN)
70 Asia Pacific Wind Powered Water Pumps Market Outlook, By Pneumatic Cylinders (2024-2032) ($MN)
71 Asia Pacific Wind Powered Water Pumps Market Outlook, By Rotor Blades (2024-2032) ($MN)
72 Asia Pacific Wind Powered Water Pumps Market Outlook, By Slider Crank Disc (2024-2032) ($MN)
73 Asia Pacific Wind Powered Water Pumps Market Outlook, By Shafts (2024-2032) ($MN)
74 Asia Pacific Wind Powered Water Pumps Market Outlook, By Ball Bearings (2024-2032) ($MN)
75 Asia Pacific Wind Powered Water Pumps Market Outlook, By Other Components (2024-2032) ($MN)
76 Asia Pacific Wind Powered Water Pumps Market Outlook, By Capacity (2024-2032) ($MN)
77 Asia Pacific Wind Powered Water Pumps Market Outlook, By Less than 2.5 kWh (2024-2032) ($MN)
78 Asia Pacific Wind Powered Water Pumps Market Outlook, By 2.5 to 10 kWh (2024-2032) ($MN)
79 Asia Pacific Wind Powered Water Pumps Market Outlook, By Greater than 10 kWh (2024-2032) ($MN)
80 Asia Pacific Wind Powered Water Pumps Market Outlook, By End User (2024-2032) ($MN)
81 Asia Pacific Wind Powered Water Pumps Market Outlook, By Irrigation (2024-2032) ($MN)
82 Asia Pacific Wind Powered Water Pumps Market Outlook, By Off-grid Water Supply (2024-2032) ($MN)
83 Asia Pacific Wind Powered Water Pumps Market Outlook, By Water Treatment Plants (2024-2032) ($MN)
84 Asia Pacific Wind Powered Water Pumps Market Outlook, By Other End Users (2024-2032) ($MN)
85 South America Wind Powered Water Pumps Market Outlook, By Country (2024-2032) ($MN)
86 South America Wind Powered Water Pumps Market Outlook, By Type (2024-2032) ($MN)
87 South America Wind Powered Water Pumps Market Outlook, By Electrical Pumps (2024-2032) ($MN)
88 South America Wind Powered Water Pumps Market Outlook, By Mechanical Pumps (2024-2032) ($MN)
89 South America Wind Powered Water Pumps Market Outlook, By Component (2024-2032) ($MN)
90 South America Wind Powered Water Pumps Market Outlook, By Mild Steel Frames (2024-2032) ($MN)
91 South America Wind Powered Water Pumps Market Outlook, By Pneumatic Cylinders (2024-2032) ($MN)
92 South America Wind Powered Water Pumps Market Outlook, By Rotor Blades (2024-2032) ($MN)
93 South America Wind Powered Water Pumps Market Outlook, By Slider Crank Disc (2024-2032) ($MN)
94 South America Wind Powered Water Pumps Market Outlook, By Shafts (2024-2032) ($MN)
95 South America Wind Powered Water Pumps Market Outlook, By Ball Bearings (2024-2032) ($MN)
96 South America Wind Powered Water Pumps Market Outlook, By Other Components (2024-2032) ($MN)
97 South America Wind Powered Water Pumps Market Outlook, By Capacity (2024-2032) ($MN)
98 South America Wind Powered Water Pumps Market Outlook, By Less than 2.5 kWh (2024-2032) ($MN)
99 South America Wind Powered Water Pumps Market Outlook, By 2.5 to 10 kWh (2024-2032) ($MN)
100 South America Wind Powered Water Pumps Market Outlook, By Greater than 10 kWh (2024-2032) ($MN)
101 South America Wind Powered Water Pumps Market Outlook, By End User (2024-2032) ($MN)
102 South America Wind Powered Water Pumps Market Outlook, By Irrigation (2024-2032) ($MN)
103 South America Wind Powered Water Pumps Market Outlook, By Off-grid Water Supply (2024-2032) ($MN)
104 South America Wind Powered Water Pumps Market Outlook, By Water Treatment Plants (2024-2032) ($MN)
105 South America Wind Powered Water Pumps Market Outlook, By Other End Users (2024-2032) ($MN)
106 Middle East & Africa Wind Powered Water Pumps Market Outlook, By Country (2024-2032) ($MN)
107 Middle East & Africa Wind Powered Water Pumps Market Outlook, By Type (2024-2032) ($MN)
108 Middle East & Africa Wind Powered Water Pumps Market Outlook, By Electrical Pumps (2024-2032) ($MN)
109 Middle East & Africa Wind Powered Water Pumps Market Outlook, By Mechanical Pumps (2024-2032) ($MN)
110 Middle East & Africa Wind Powered Water Pumps Market Outlook, By Component (2024-2032) ($MN)
111 Middle East & Africa Wind Powered Water Pumps Market Outlook, By Mild Steel Frames (2024-2032) ($MN)
112 Middle East & Africa Wind Powered Water Pumps Market Outlook, By Pneumatic Cylinders (2024-2032) ($MN)
113 Middle East & Africa Wind Powered Water Pumps Market Outlook, By Rotor Blades (2024-2032) ($MN)
114 Middle East & Africa Wind Powered Water Pumps Market Outlook, By Slider Crank Disc (2024-2032) ($MN)
115 Middle East & Africa Wind Powered Water Pumps Market Outlook, By Shafts (2024-2032) ($MN)
116 Middle East & Africa Wind Powered Water Pumps Market Outlook, By Ball Bearings (2024-2032) ($MN)
117 Middle East & Africa Wind Powered Water Pumps Market Outlook, By Other Components (2024-2032) ($MN)
118 Middle East & Africa Wind Powered Water Pumps Market Outlook, By Capacity (2024-2032) ($MN)
119 Middle East & Africa Wind Powered Water Pumps Market Outlook, By Less than 2.5 kWh (2024-2032) ($MN)
120 Middle East & Africa Wind Powered Water Pumps Market Outlook, By 2.5 to 10 kWh (2024-2032) ($MN)
121 Middle East & Africa Wind Powered Water Pumps Market Outlook, By Greater than 10 kWh (2024-2032) ($MN)
122 Middle East & Africa Wind Powered Water Pumps Market Outlook, By End User (2024-2032) ($MN)
123 Middle East & Africa Wind Powered Water Pumps Market Outlook, By Irrigation (2024-2032) ($MN)
124 Middle East & Africa Wind Powered Water Pumps Market Outlook, By Off-grid Water Supply (2024-2032) ($MN)
125 Middle East & Africa Wind Powered Water Pumps Market Outlook, By Water Treatment Plants (2024-2032) ($MN)
126 Middle East & Africa Wind Powered Water Pumps Market Outlook, By Other End Users (2024-2032) ($MN)
List of Figures
RESEARCH METHODOLOGY

We at ‘Stratistics’ opt for an extensive research approach which involves data mining, data validation, and data analysis. The various research sources include in-house repository, secondary research, competitor’s sources, social media research, client internal data, and primary research.
Our team of analysts prefers the most reliable and authenticated data sources in order to perform the comprehensive literature search. With access to most of the authenticated data bases our team highly considers the best mix of information through various sources to obtain extensive and accurate analysis.
Each report takes an average time of a month and a team of 4 industry analysts. The time may vary depending on the scope and data availability of the desired market report. The various parameters used in the market assessment are standardized in order to enhance the data accuracy.
Data Mining
The data is collected from several authenticated, reliable, paid and unpaid sources and is filtered depending on the scope & objective of the research. Our reports repository acts as an added advantage in this procedure. Data gathering from the raw material suppliers, distributors and the manufacturers is performed on a regular basis, this helps in the comprehensive understanding of the products value chain. Apart from the above mentioned sources the data is also collected from the industry consultants to ensure the objective of the study is in the right direction.
Market trends such as technological advancements, regulatory affairs, market dynamics (Drivers, Restraints, Opportunities and Challenges) are obtained from scientific journals, market related national & international associations and organizations.
Data Analysis
From the data that is collected depending on the scope & objective of the research the data is subjected for the analysis. The critical steps that we follow for the data analysis include:
- Product Lifecycle Analysis
- Competitor analysis
- Risk analysis
- Porters Analysis
- PESTEL Analysis
- SWOT Analysis
The data engineering is performed by the core industry experts considering both the Marketing Mix Modeling and the Demand Forecasting. The marketing mix modeling makes use of multiple-regression techniques to predict the optimal mix of marketing variables. Regression factor is based on a number of variables and how they relate to an outcome such as sales or profits.
Data Validation
The data validation is performed by the exhaustive primary research from the expert interviews. This includes telephonic interviews, focus groups, face to face interviews, and questionnaires to validate our research from all aspects. The industry experts we approach come from the leading firms, involved in the supply chain ranging from the suppliers, distributors to the manufacturers and consumers so as to ensure an unbiased analysis.
We are in touch with more than 15,000 industry experts with the right mix of consultants, CEO's, presidents, vice presidents, managers, experts from both supply side and demand side, executives and so on.
The data validation involves the primary research from the industry experts belonging to:
- Leading Companies
- Suppliers & Distributors
- Manufacturers
- Consumers
- Industry/Strategic Consultants
Apart from the data validation the primary research also helps in performing the fill gap research, i.e. providing solutions for the unmet needs of the research which helps in enhancing the reports quality.
For more details about research methodology, kindly write to us at info@strategymrc.com
Frequently Asked Questions
In case of any queries regarding this report, you can contact the customer service by filing the “Inquiry Before Buy” form available on the right hand side. You may also contact us through email: info@strategymrc.com or phone: +1-301-202-5929
Yes, the samples are available for all the published reports. You can request them by filling the “Request Sample” option available in this page.
Yes, you can request a sample with your specific requirements. All the customized samples will be provided as per the requirement with the real data masked.
All our reports are available in Digital PDF format. In case if you require them in any other formats, such as PPT, Excel etc you can submit a request through “Inquiry Before Buy” form available on the right hand side. You may also contact us through email: info@strategymrc.com or phone: +1-301-202-5929
We offer a free 15% customization with every purchase. This requirement can be fulfilled for both pre and post sale. You may send your customization requirements through email at info@strategymrc.com or call us on +1-301-202-5929.
We have 3 different licensing options available in electronic format.
- Single User Licence: Allows one person, typically the buyer, to have access to the ordered product. The ordered product cannot be distributed to anyone else.
- 2-5 User Licence: Allows the ordered product to be shared among a maximum of 5 people within your organisation.
- Corporate License: Allows the product to be shared among all employees of your organisation regardless of their geographical location.
All our reports are typically be emailed to you as an attachment.
To order any available report you need to register on our website. The payment can be made either through CCAvenue or PayPal payments gateways which accept all international cards.
We extend our support to 6 months post sale. A post sale customization is also provided to cover your unmet needs in the report.
Request Customization
We offer complimentary customization of up to 15% with every purchase. To share your customization requirements, feel free to email us at info@strategymrc.com or call us on +1-301-202-5929. .
Please Note: Customization within the 15% threshold is entirely free of charge. If your request exceeds this limit, we will conduct a feasibility assessment. Following that, a detailed quote and timeline will be provided.
WHY CHOOSE US ?

Assured Quality
Best in class reports with high standard of research integrity

24X7 Research Support
Continuous support to ensure the best customer experience.

Free Customization
Adding more values to your product of interest.

Safe & Secure Access
Providing a secured environment for all online transactions.

Trusted by 600+ Brands
Serving the most reputed brands across the world.