
Airport Bus Market
Airport Bus Market Forecasts to 2032 - Global Analysis By Type (Electric, Fuel and Hybrid), Sales Channel (Direct Sales and Distributor), Seating Capacity, Application and By Geography

|
Years Covered |
2024-2032 |
|
Estimated Year Value (2025) |
US $17.79 BN |
|
Projected Year Value (2032) |
US $43.45 BN |
|
CAGR (2025 - 2032) |
13.6% |
|
Regions Covered |
North America, Europe, Asia Pacific, South America, and Middle East & Africa |
|
Countries Covered |
US, Canada, Mexico, Germany, UK, Italy, France, Spain, Japan, China, India, Australia, New Zealand, South Korea, Rest of Asia Pacific, South America, Argentina, Brazil, Chile, Middle East & Africa, Saudi Arabia, UAE, Qatar, and South Africa |
|
Largest Market |
Europe |
|
Highest Growing Market |
Asia Pacific |
According to Stratistics MRC, the Global Airport Bus Market is accounted for $17.79 billion in 2025 and is expected to reach $43.45 billion by 2032 growing at a CAGR of 13.6% during the forecast period. Airport buses are specialized transportation services that are intended to make it easier for people to move between airport terminals and airplanes or between the airport and neighboring hotels, parking lots, or city centers. Air conditioning, real-time information systems, low floors for easy boarding, and spacious interiors are common features of these buses, which are designed to comfortably carry passengers and their belongings. Moreover, airport buses are essential to the seamless and effective ground transportation of airports, especially in large or crowded hubs where direct access to gates is limited or walking distances may be considerable.
According to the International Air Transport Association (IATA), global air passenger traffic is projected to reach 8.2 billion passengers by 2037, highlighting the growing need for efficient ground transportation solutions.
Market Dynamics:
Driver:
Increase in air passenger volume
One of the main drivers of the airport bus market is the rise in air travel worldwide, which is being driven by urbanization, economic expansion, and the emergence of low-cost carriers. Domestic and international travel is increasing at an especially rapid rate in emerging markets in Asia, Africa, and Latin America, which calls for effective ground handling systems. In airports where direct jet bridge access is restricted or not available for all gates, airport buses provide a scalable way to move passengers across expansive terminals. Additionally, airports can lower gate turnaround times and manage peak traffic volumes with their flexible deployment.
Restraint:
Expensive start-up and ongoing expenses
The purchase, installation of charging infrastructure, and maintenance equipment of airport buses, particularly electric and hybrid models, necessitate a substantial initial investment. Even though these vehicles save money over time, many airports still find the initial outlay prohibitive, especially in developing nations with tight budgets. Expenses for driver education, battery replacement, and specialized service facilities can add significantly to the cost of a vehicle. Furthermore, incorporating smart technologies like automated dispatch systems or real-time tracking adds to the financial complexity, making it harder for smaller airports or privately run terminals to defend the investment.
Opportunity:
Utilizing connected and autonomous vehicle technology
The development of connected and autonomous car technologies offers the airport bus market a game-changing opportunity. Controlled airport settings with fenced perimeters, low speeds, and predictable routes are the perfect setting for testing driverless shuttle buses. The autonomous shuttles that are operated at Changi and Frankfurt airports are two examples. Combining V2X communication can increase efficiency even more by enabling buses to communicate with control towers, gates, and traffic lights. Moreover, smarter and more responsive ground transportation systems are made possible by autonomous buses, which lessen reliance on human drivers, cut operating expenses, and minimizes delays brought on by human error.
Threat:
Competition from other terminal transportation systems
Traditional airport buses are under threat from the rise of alternative intra-airport transportation options like automated people movers (APMs), high-speed rail connections, underground trains, and even moving walkways. These systems provide driverless, continuous, high-capacity services that can be faster, more convenient, and more scalable than buses, especially in major international hubs. Reliance on bus fleets may be lessened or eliminated at airports that give priority to these fixed systems during expansions. Additionally, these systems frequently draw funding from the public or private sectors, hastening their deployment and relegating buses to supporting roles.
Covid-19 Impact:
Due to lockdowns, border closures, and travel restrictions that brought passenger traffic to a near halt, the COVID-19 pandemic had a significant and immediate impact on the airport bus market. Long-term inactivity at several airports resulted in the suspension or drastic cutback of airport shuttle services. Furthermore, airports were also forced to restrict the number of passengers per bus due to increased hygienic concerns and social distancing norms, which further reduced operational efficiency. Even though the market has started to rebound as travel has increased, the pandemic has permanently changed priorities in favor of flexible, hygienic, and contactless transit options, forcing operators to reconsider fleet management and design tactics.
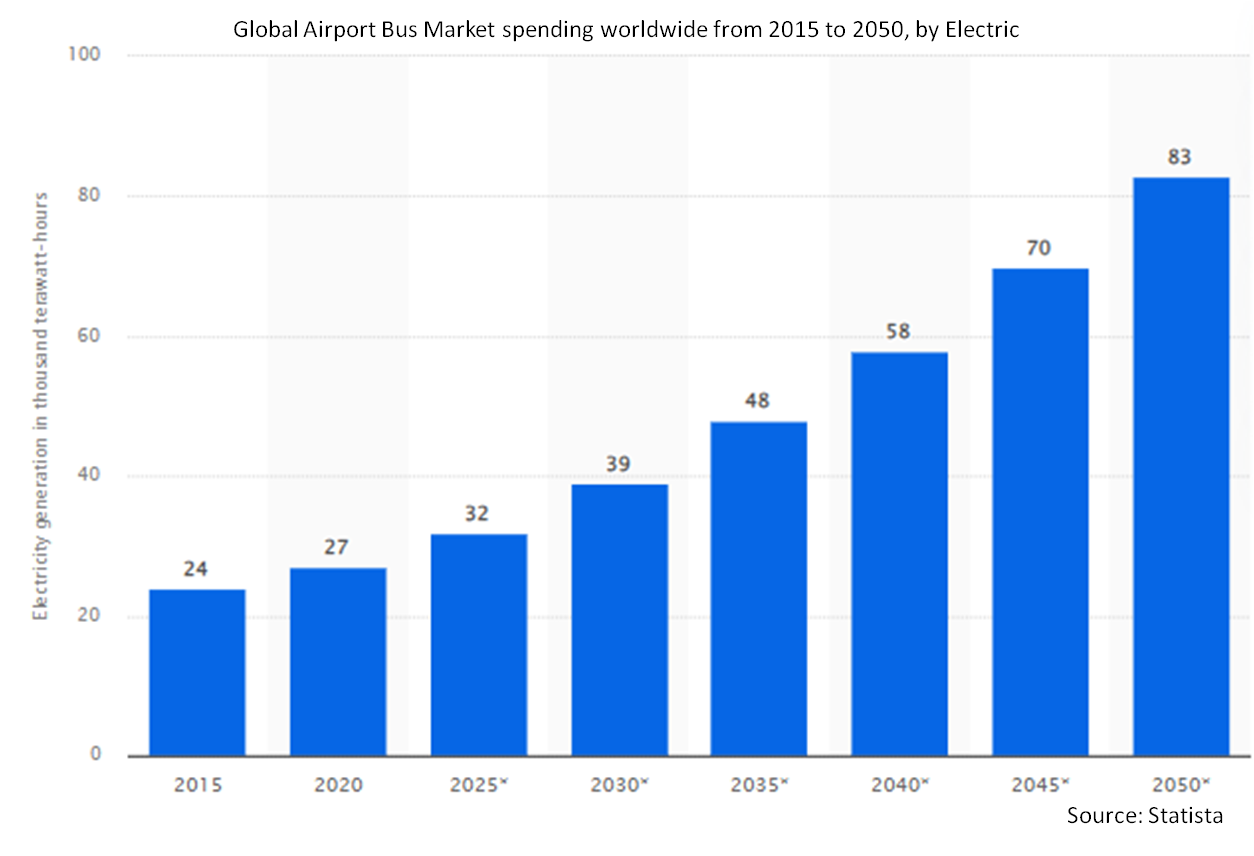
The electric segment is expected to be the largest during the forecast period
The electric segment is expected to account for the largest market share during the forecast period. The growing focus on lowering carbon emissions, noise pollution, and reliance on fossil fuels in airport operations is what is causing this dominance. Significant advantages of electric airport buses include reduced operating costs, silent operation, and adherence to strict environmental regulations. With the help of government incentives, advancements in battery technology, and growing infrastructure for charging, airports are giving priority to electric fleets as part of their green infrastructure plans.
The terminal transfer segment is expected to have the highest CAGR during the forecast period
Over the forecast period, the terminal transfer segment is predicted to witness the highest growth rate, driven by the growing need for smooth and effective passenger transfers between terminals. Because travelers frequently have to switch between terminals for connecting flights, this growth is especially noticeable in major international airports. Reliable and prompt terminal transfer services are now more important than ever due to the growth of airport infrastructure and the increase in air travel. Additionally, the overall travel experience is being improved by the use of contemporary airport buses to make these transfers easier and guarantee that travelers can travel between terminals swiftly and comfortably.
Region with largest share:
During the forecast period, the Europe region is expected to hold the largest market share. A strong public transportation system, a well-established aviation industry, and effective government programs encouraging the use of electric and hybrid buses are the main drivers of this dominance. In order to handle large passenger volumes, the area is home to some of the busiest international airports in the world, which call for effective and environmentally responsible ground transportation options. Furthermore, adoption of electric buses has accelerated due to strict environmental regulations and government incentives, improving passenger experience and supporting sustainability goals.
Region with highest CAGR:
Over the forecast period, the Asia Pacific region is anticipated to exhibit the highest CAGR, driven by nations like China and India's growing demand for air travel, economic growth, and fast urbanization. India's airport network has doubled from 74 in 2014 to 148 in 2023, indicating a notable increase in air travel and the need for improved ground transportation options. The adoption of environmentally friendly airport transportation options is further supported by the region's strong manufacturing base for electric and hybrid buses. Moreover, the region's top growth prospects in the airport bus market are also a result of the development of airport infrastructure and the increased focus on sustainability and passenger convenience.

Key players in the market
Some of the key players in Airport Bus Market include BYD Company Ltd., Kiitokori OY, Yutong Bus Co. Ltd, AB Volvo, Weihai Guangtai Airport Equipment Co. Ltd., Mallaghan Inc, Cobus Industries GmbH, TAM-Europe, BMC Corporation, Ashok Leyland Limited, JCBL Limited, Aeromobiles Pte Ltd and Tata Bus.
Key Developments:
In January 2025, Ashok Leyland has partnered with ESAF Small Finance Bank to provide vehicle financing options to its customers. The memorandum of understanding was signed in Chennai today between Viplav Shah, Head of LCV Business at Ashok Leyland, and George Oommen, Business Head of General and Mobility Loans at ESAF Small Finance Bank.
In October 2024, Volvo Group and Daimler Truck have signed a binding agreement to establish a new 50/50 joint venture to develop a software-defined vehicle platform for heavy duty vehicles and drive the industry transformation. The new company aims to set an industry standard with headquarters in Gothenburg, Sweden.
In September 2024, BYD Automotive GmbH and Hedin Mobility Group have entered into an agreement for the sale of the subsidiary Hedin Electric Mobility GmbH, the appointed Dealer+ of BYD vehicles and spare parts in the German market. The transaction also includes a business transfer of the two pioneer stores in Stuttgart and Frankfurt which are operated by Hedin Mobility Group’s German retail division.
Types Covered:
• Electric
• Fuel
• Hybrid
Sales Channels Covered:
• Direct Sales
• Distributor
Seating Capacities Covered:
• Up to 10 seats
• 11-20 seats
• 21-30 seats
• Over 30 seats
Applications Covered:
• Domestic Airport
• International Airport
• Terminal Transfer
• Airside Transfer
• Car Park Transfer
• Cargo and Logistics Transfer
Regions Covered:
• North America
o US
o Canada
o Mexico
• Europe
o Germany
o UK
o Italy
o France
o Spain
o Rest of Europe
• Asia Pacific
o Japan
o China
o India
o Australia
o New Zealand
o South Korea
o Rest of Asia Pacific
• South America
o Argentina
o Brazil
o Chile
o Rest of South America
• Middle East & Africa
o Saudi Arabia
o UAE
o Qatar
o South Africa
o Rest of Middle East & Africa
What our report offers:
- Market share assessments for the regional and country-level segments
- Strategic recommendations for the new entrants
- Covers Market data for the years 2024, 2025, 2026, 2028, and 2032
- Market Trends (Drivers, Constraints, Opportunities, Threats, Challenges, Investment Opportunities, and recommendations)
- Strategic recommendations in key business segments based on the market estimations
- Competitive landscaping mapping the key common trends
- Company profiling with detailed strategies, financials, and recent developments
- Supply chain trends mapping the latest technological advancements
Free Customization Offerings:
All the customers of this report will be entitled to receive one of the following free customization options:
• Company Profiling
o Comprehensive profiling of additional market players (up to 3)
o SWOT Analysis of key players (up to 3)
• Regional Segmentation
o Market estimations, Forecasts and CAGR of any prominent country as per the client's interest (Note: Depends on feasibility check)
• Competitive Benchmarking
o Benchmarking of key players based on product portfolio, geographical presence, and strategic alliances
Table of Contents
1 Executive Summary
2 Preface
2.1 Abstract
2.2 Stake Holders
2.3 Research Scope
2.4 Research Methodology
2.4.1 Data Mining
2.4.2 Data Analysis
2.4.3 Data Validation
2.4.4 Research Approach
2.5 Research Sources
2.5.1 Primary Research Sources
2.5.2 Secondary Research Sources
2.5.3 Assumptions
3 Market Trend Analysis
3.1 Introduction
3.2 Drivers
3.3 Restraints
3.4 Opportunities
3.5 Threats
3.6 Application Analysis
3.7 Emerging Markets
3.8 Impact of Covid-19
4 Porters Five Force Analysis
4.1 Bargaining power of suppliers
4.2 Bargaining power of buyers
4.3 Threat of substitutes
4.4 Threat of new entrants
4.5 Competitive rivalry
5 Global Airport Bus Market, By Type
5.1 Introduction
5.2 Electric
5.3 Fuel
5.3.1 Diesel
5.3.2 Gasoline
5.4 Hybrid
6 Global Airport Bus Market, By Sales Channel
6.1 Introduction
6.2 Direct Sales
6.3 Distributor
7 Global Airport Bus Market, By Seating Capacity
7.1 Introduction
7.2 Up to 10 seats
7.3 11-20 seats
7.4 21-30 seats
7.5 Over 30 seats
8 Global Airport Bus Market, By Application
8.1 Introduction
8.2 Domestic Airport
8.3 International Airport
8.4 Terminal Transfer
8.5 Airside Transfer
8.6 Car Park Transfer
8.7 Cargo and Logistics Transfer
9 Global Airport Bus Market, By Geography
9.1 Introduction
9.2 North America
9.2.1 US
9.2.2 Canada
9.2.3 Mexico
9.3 Europe
9.3.1 Germany
9.3.2 UK
9.3.3 Italy
9.3.4 France
9.3.5 Spain
9.3.6 Rest of Europe
9.4 Asia Pacific
9.4.1 Japan
9.4.2 China
9.4.3 India
9.4.4 Australia
9.4.5 New Zealand
9.4.6 South Korea
9.4.7 Rest of Asia Pacific
9.5 South America
9.5.1 Argentina
9.5.2 Brazil
9.5.3 Chile
9.5.4 Rest of South America
9.6 Middle East & Africa
9.6.1 Saudi Arabia
9.6.2 UAE
9.6.3 Qatar
9.6.4 South Africa
9.6.5 Rest of Middle East & Africa
10 Key Developments
10.1 Agreements, Partnerships, Collaborations and Joint Ventures
10.2 Acquisitions & Mergers
10.3 New Product Launch
10.4 Expansions
10.5 Other Key Strategies
11 Company Profiling
11.1 BYD Company Ltd.
11.2 Kiitokori OY
11.3 Yutong Bus Co. Ltd
11.4 AB Volvo
11.5 Weihai Guangtai Airport Equipment Co. Ltd.
11.6 Mallaghan Inc
11.7 Cobus Industries GmbH
11.8 TAM-Europe
11.9 BMC Corporation
11.10 Ashok Leyland Limited
11.11 JCBL Limited
11.12 Aeromobiles Pte Ltd
11.13 Tata Bus
List of Tables
1 Global Airport Bus Market Outlook, By Region (2024-2032) ($MN)
2 Global Airport Bus Market Outlook, By Type (2024-2032) ($MN)
3 Global Airport Bus Market Outlook, By Electric (2024-2032) ($MN)
4 Global Airport Bus Market Outlook, By Fuel (2024-2032) ($MN)
5 Global Airport Bus Market Outlook, By Diesel (2024-2032) ($MN)
6 Global Airport Bus Market Outlook, By Gasoline (2024-2032) ($MN)
7 Global Airport Bus Market Outlook, By Hybrid (2024-2032) ($MN)
8 Global Airport Bus Market Outlook, By Sales Channel (2024-2032) ($MN)
9 Global Airport Bus Market Outlook, By Direct Sales (2024-2032) ($MN)
10 Global Airport Bus Market Outlook, By Distributor (2024-2032) ($MN)
11 Global Airport Bus Market Outlook, By Seating Capacity (2024-2032) ($MN)
12 Global Airport Bus Market Outlook, By Up to 10 seats (2024-2032) ($MN)
13 Global Airport Bus Market Outlook, By 11-20 seats (2024-2032) ($MN)
14 Global Airport Bus Market Outlook, By 21-30 seats (2024-2032) ($MN)
15 Global Airport Bus Market Outlook, By Over 30 seats (2024-2032) ($MN)
16 Global Airport Bus Market Outlook, By Application (2024-2032) ($MN)
17 Global Airport Bus Market Outlook, By Domestic Airport (2024-2032) ($MN)
18 Global Airport Bus Market Outlook, By International Airport (2024-2032) ($MN)
19 Global Airport Bus Market Outlook, By Terminal Transfer (2024-2032) ($MN)
20 Global Airport Bus Market Outlook, By Airside Transfer (2024-2032) ($MN)
21 Global Airport Bus Market Outlook, By Car Park Transfer (2024-2032) ($MN)
22 Global Airport Bus Market Outlook, By Cargo and Logistics Transfer (2024-2032) ($MN)
23 North America Airport Bus Market Outlook, By Country (2024-2032) ($MN)
24 North America Airport Bus Market Outlook, By Type (2024-2032) ($MN)
25 North America Airport Bus Market Outlook, By Electric (2024-2032) ($MN)
26 North America Airport Bus Market Outlook, By Fuel (2024-2032) ($MN)
27 North America Airport Bus Market Outlook, By Diesel (2024-2032) ($MN)
28 North America Airport Bus Market Outlook, By Gasoline (2024-2032) ($MN)
29 North America Airport Bus Market Outlook, By Hybrid (2024-2032) ($MN)
30 North America Airport Bus Market Outlook, By Sales Channel (2024-2032) ($MN)
31 North America Airport Bus Market Outlook, By Direct Sales (2024-2032) ($MN)
32 North America Airport Bus Market Outlook, By Distributor (2024-2032) ($MN)
33 North America Airport Bus Market Outlook, By Seating Capacity (2024-2032) ($MN)
34 North America Airport Bus Market Outlook, By Up to 10 seats (2024-2032) ($MN)
35 North America Airport Bus Market Outlook, By 11-20 seats (2024-2032) ($MN)
36 North America Airport Bus Market Outlook, By 21-30 seats (2024-2032) ($MN)
37 North America Airport Bus Market Outlook, By Over 30 seats (2024-2032) ($MN)
38 North America Airport Bus Market Outlook, By Application (2024-2032) ($MN)
39 North America Airport Bus Market Outlook, By Domestic Airport (2024-2032) ($MN)
40 North America Airport Bus Market Outlook, By International Airport (2024-2032) ($MN)
41 North America Airport Bus Market Outlook, By Terminal Transfer (2024-2032) ($MN)
42 North America Airport Bus Market Outlook, By Airside Transfer (2024-2032) ($MN)
43 North America Airport Bus Market Outlook, By Car Park Transfer (2024-2032) ($MN)
44 North America Airport Bus Market Outlook, By Cargo and Logistics Transfer (2024-2032) ($MN)
45 Europe Airport Bus Market Outlook, By Country (2024-2032) ($MN)
46 Europe Airport Bus Market Outlook, By Type (2024-2032) ($MN)
47 Europe Airport Bus Market Outlook, By Electric (2024-2032) ($MN)
48 Europe Airport Bus Market Outlook, By Fuel (2024-2032) ($MN)
49 Europe Airport Bus Market Outlook, By Diesel (2024-2032) ($MN)
50 Europe Airport Bus Market Outlook, By Gasoline (2024-2032) ($MN)
51 Europe Airport Bus Market Outlook, By Hybrid (2024-2032) ($MN)
52 Europe Airport Bus Market Outlook, By Sales Channel (2024-2032) ($MN)
53 Europe Airport Bus Market Outlook, By Direct Sales (2024-2032) ($MN)
54 Europe Airport Bus Market Outlook, By Distributor (2024-2032) ($MN)
55 Europe Airport Bus Market Outlook, By Seating Capacity (2024-2032) ($MN)
56 Europe Airport Bus Market Outlook, By Up to 10 seats (2024-2032) ($MN)
57 Europe Airport Bus Market Outlook, By 11-20 seats (2024-2032) ($MN)
58 Europe Airport Bus Market Outlook, By 21-30 seats (2024-2032) ($MN)
59 Europe Airport Bus Market Outlook, By Over 30 seats (2024-2032) ($MN)
60 Europe Airport Bus Market Outlook, By Application (2024-2032) ($MN)
61 Europe Airport Bus Market Outlook, By Domestic Airport (2024-2032) ($MN)
62 Europe Airport Bus Market Outlook, By International Airport (2024-2032) ($MN)
63 Europe Airport Bus Market Outlook, By Terminal Transfer (2024-2032) ($MN)
64 Europe Airport Bus Market Outlook, By Airside Transfer (2024-2032) ($MN)
65 Europe Airport Bus Market Outlook, By Car Park Transfer (2024-2032) ($MN)
66 Europe Airport Bus Market Outlook, By Cargo and Logistics Transfer (2024-2032) ($MN)
67 Asia Pacific Airport Bus Market Outlook, By Country (2024-2032) ($MN)
68 Asia Pacific Airport Bus Market Outlook, By Type (2024-2032) ($MN)
69 Asia Pacific Airport Bus Market Outlook, By Electric (2024-2032) ($MN)
70 Asia Pacific Airport Bus Market Outlook, By Fuel (2024-2032) ($MN)
71 Asia Pacific Airport Bus Market Outlook, By Diesel (2024-2032) ($MN)
72 Asia Pacific Airport Bus Market Outlook, By Gasoline (2024-2032) ($MN)
73 Asia Pacific Airport Bus Market Outlook, By Hybrid (2024-2032) ($MN)
74 Asia Pacific Airport Bus Market Outlook, By Sales Channel (2024-2032) ($MN)
75 Asia Pacific Airport Bus Market Outlook, By Direct Sales (2024-2032) ($MN)
76 Asia Pacific Airport Bus Market Outlook, By Distributor (2024-2032) ($MN)
77 Asia Pacific Airport Bus Market Outlook, By Seating Capacity (2024-2032) ($MN)
78 Asia Pacific Airport Bus Market Outlook, By Up to 10 seats (2024-2032) ($MN)
79 Asia Pacific Airport Bus Market Outlook, By 11-20 seats (2024-2032) ($MN)
80 Asia Pacific Airport Bus Market Outlook, By 21-30 seats (2024-2032) ($MN)
81 Asia Pacific Airport Bus Market Outlook, By Over 30 seats (2024-2032) ($MN)
82 Asia Pacific Airport Bus Market Outlook, By Application (2024-2032) ($MN)
83 Asia Pacific Airport Bus Market Outlook, By Domestic Airport (2024-2032) ($MN)
84 Asia Pacific Airport Bus Market Outlook, By International Airport (2024-2032) ($MN)
85 Asia Pacific Airport Bus Market Outlook, By Terminal Transfer (2024-2032) ($MN)
86 Asia Pacific Airport Bus Market Outlook, By Airside Transfer (2024-2032) ($MN)
87 Asia Pacific Airport Bus Market Outlook, By Car Park Transfer (2024-2032) ($MN)
88 Asia Pacific Airport Bus Market Outlook, By Cargo and Logistics Transfer (2024-2032) ($MN)
89 South America Airport Bus Market Outlook, By Country (2024-2032) ($MN)
90 South America Airport Bus Market Outlook, By Type (2024-2032) ($MN)
91 South America Airport Bus Market Outlook, By Electric (2024-2032) ($MN)
92 South America Airport Bus Market Outlook, By Fuel (2024-2032) ($MN)
93 South America Airport Bus Market Outlook, By Diesel (2024-2032) ($MN)
94 South America Airport Bus Market Outlook, By Gasoline (2024-2032) ($MN)
95 South America Airport Bus Market Outlook, By Hybrid (2024-2032) ($MN)
96 South America Airport Bus Market Outlook, By Sales Channel (2024-2032) ($MN)
97 South America Airport Bus Market Outlook, By Direct Sales (2024-2032) ($MN)
98 South America Airport Bus Market Outlook, By Distributor (2024-2032) ($MN)
99 South America Airport Bus Market Outlook, By Seating Capacity (2024-2032) ($MN)
100 South America Airport Bus Market Outlook, By Up to 10 seats (2024-2032) ($MN)
101 South America Airport Bus Market Outlook, By 11-20 seats (2024-2032) ($MN)
102 South America Airport Bus Market Outlook, By 21-30 seats (2024-2032) ($MN)
103 South America Airport Bus Market Outlook, By Over 30 seats (2024-2032) ($MN)
104 South America Airport Bus Market Outlook, By Application (2024-2032) ($MN)
105 South America Airport Bus Market Outlook, By Domestic Airport (2024-2032) ($MN)
106 South America Airport Bus Market Outlook, By International Airport (2024-2032) ($MN)
107 South America Airport Bus Market Outlook, By Terminal Transfer (2024-2032) ($MN)
108 South America Airport Bus Market Outlook, By Airside Transfer (2024-2032) ($MN)
109 South America Airport Bus Market Outlook, By Car Park Transfer (2024-2032) ($MN)
110 South America Airport Bus Market Outlook, By Cargo and Logistics Transfer (2024-2032) ($MN)
111 Middle East & Africa Airport Bus Market Outlook, By Country (2024-2032) ($MN)
112 Middle East & Africa Airport Bus Market Outlook, By Type (2024-2032) ($MN)
113 Middle East & Africa Airport Bus Market Outlook, By Electric (2024-2032) ($MN)
114 Middle East & Africa Airport Bus Market Outlook, By Fuel (2024-2032) ($MN)
115 Middle East & Africa Airport Bus Market Outlook, By Diesel (2024-2032) ($MN)
116 Middle East & Africa Airport Bus Market Outlook, By Gasoline (2024-2032) ($MN)
117 Middle East & Africa Airport Bus Market Outlook, By Hybrid (2024-2032) ($MN)
118 Middle East & Africa Airport Bus Market Outlook, By Sales Channel (2024-2032) ($MN)
119 Middle East & Africa Airport Bus Market Outlook, By Direct Sales (2024-2032) ($MN)
120 Middle East & Africa Airport Bus Market Outlook, By Distributor (2024-2032) ($MN)
121 Middle East & Africa Airport Bus Market Outlook, By Seating Capacity (2024-2032) ($MN)
122 Middle East & Africa Airport Bus Market Outlook, By Up to 10 seats (2024-2032) ($MN)
123 Middle East & Africa Airport Bus Market Outlook, By 11-20 seats (2024-2032) ($MN)
124 Middle East & Africa Airport Bus Market Outlook, By 21-30 seats (2024-2032) ($MN)
125 Middle East & Africa Airport Bus Market Outlook, By Over 30 seats (2024-2032) ($MN)
126 Middle East & Africa Airport Bus Market Outlook, By Application (2024-2032) ($MN)
127 Middle East & Africa Airport Bus Market Outlook, By Domestic Airport (2024-2032) ($MN)
128 Middle East & Africa Airport Bus Market Outlook, By International Airport (2024-2032) ($MN)
129 Middle East & Africa Airport Bus Market Outlook, By Terminal Transfer (2024-2032) ($MN)
130 Middle East & Africa Airport Bus Market Outlook, By Airside Transfer (2024-2032) ($MN)
131 Middle East & Africa Airport Bus Market Outlook, By Car Park Transfer (2024-2032) ($MN)
132 Middle East & Africa Airport Bus Market Outlook, By Cargo and Logistics Transfer (2024-2032) ($MN)
List of Figures
RESEARCH METHODOLOGY

We at ‘Stratistics’ opt for an extensive research approach which involves data mining, data validation, and data analysis. The various research sources include in-house repository, secondary research, competitor’s sources, social media research, client internal data, and primary research.
Our team of analysts prefers the most reliable and authenticated data sources in order to perform the comprehensive literature search. With access to most of the authenticated data bases our team highly considers the best mix of information through various sources to obtain extensive and accurate analysis.
Each report takes an average time of a month and a team of 4 industry analysts. The time may vary depending on the scope and data availability of the desired market report. The various parameters used in the market assessment are standardized in order to enhance the data accuracy.
Data Mining
The data is collected from several authenticated, reliable, paid and unpaid sources and is filtered depending on the scope & objective of the research. Our reports repository acts as an added advantage in this procedure. Data gathering from the raw material suppliers, distributors and the manufacturers is performed on a regular basis, this helps in the comprehensive understanding of the products value chain. Apart from the above mentioned sources the data is also collected from the industry consultants to ensure the objective of the study is in the right direction.
Market trends such as technological advancements, regulatory affairs, market dynamics (Drivers, Restraints, Opportunities and Challenges) are obtained from scientific journals, market related national & international associations and organizations.
Data Analysis
From the data that is collected depending on the scope & objective of the research the data is subjected for the analysis. The critical steps that we follow for the data analysis include:
- Product Lifecycle Analysis
- Competitor analysis
- Risk analysis
- Porters Analysis
- PESTEL Analysis
- SWOT Analysis
The data engineering is performed by the core industry experts considering both the Marketing Mix Modeling and the Demand Forecasting. The marketing mix modeling makes use of multiple-regression techniques to predict the optimal mix of marketing variables. Regression factor is based on a number of variables and how they relate to an outcome such as sales or profits.
Data Validation
The data validation is performed by the exhaustive primary research from the expert interviews. This includes telephonic interviews, focus groups, face to face interviews, and questionnaires to validate our research from all aspects. The industry experts we approach come from the leading firms, involved in the supply chain ranging from the suppliers, distributors to the manufacturers and consumers so as to ensure an unbiased analysis.
We are in touch with more than 15,000 industry experts with the right mix of consultants, CEO's, presidents, vice presidents, managers, experts from both supply side and demand side, executives and so on.
The data validation involves the primary research from the industry experts belonging to:
- Leading Companies
- Suppliers & Distributors
- Manufacturers
- Consumers
- Industry/Strategic Consultants
Apart from the data validation the primary research also helps in performing the fill gap research, i.e. providing solutions for the unmet needs of the research which helps in enhancing the reports quality.
For more details about research methodology, kindly write to us at info@strategymrc.com
Frequently Asked Questions
In case of any queries regarding this report, you can contact the customer service by filing the “Inquiry Before Buy” form available on the right hand side. You may also contact us through email: info@strategymrc.com or phone: +1-301-202-5929
Yes, the samples are available for all the published reports. You can request them by filling the “Request Sample” option available in this page.
Yes, you can request a sample with your specific requirements. All the customized samples will be provided as per the requirement with the real data masked.
All our reports are available in Digital PDF format. In case if you require them in any other formats, such as PPT, Excel etc you can submit a request through “Inquiry Before Buy” form available on the right hand side. You may also contact us through email: info@strategymrc.com or phone: +1-301-202-5929
We offer a free 15% customization with every purchase. This requirement can be fulfilled for both pre and post sale. You may send your customization requirements through email at info@strategymrc.com or call us on +1-301-202-5929.
We have 3 different licensing options available in electronic format.
- Single User Licence: Allows one person, typically the buyer, to have access to the ordered product. The ordered product cannot be distributed to anyone else.
- 2-5 User Licence: Allows the ordered product to be shared among a maximum of 5 people within your organisation.
- Corporate License: Allows the product to be shared among all employees of your organisation regardless of their geographical location.
All our reports are typically be emailed to you as an attachment.
To order any available report you need to register on our website. The payment can be made either through CCAvenue or PayPal payments gateways which accept all international cards.
We extend our support to 6 months post sale. A post sale customization is also provided to cover your unmet needs in the report.
Request Customization
We offer complimentary customization of up to 15% with every purchase. To share your customization requirements, feel free to email us at info@strategymrc.com or call us on +1-301-202-5929. .
Please Note: Customization within the 15% threshold is entirely free of charge. If your request exceeds this limit, we will conduct a feasibility assessment. Following that, a detailed quote and timeline will be provided.
WHY CHOOSE US ?

Assured Quality
Best in class reports with high standard of research integrity

24X7 Research Support
Continuous support to ensure the best customer experience.

Free Customization
Adding more values to your product of interest.

Safe & Secure Access
Providing a secured environment for all online transactions.

Trusted by 600+ Brands
Serving the most reputed brands across the world.