
Automatic Ticket Machine Market
Automatic Ticket Machine Market Forecasts to 2028 - Global Analysis By Payment Type (Mobile Payment, Smart Card Payment and Cash Payment), Application (Entertainment and Gaming, Public Transport and Other Applications) and By Geography

|
Years Covered |
2020-2028 |
|
Estimated Year Value (2022) |
US $3.60 BN |
|
Projected Year Value (2028) |
US $8.43 BN |
|
CAGR (2022 - 2028) |
15.2% |
|
Regions Covered |
North America, Europe, Asia Pacific, South America, and Middle East & Africa |
|
Countries Covered |
US, Canada, Mexico, Germany, UK, Italy, France, Spain, Japan, China, India, Australia, New Zealand, South Korea, Rest of Asia Pacific, South America, Argentina, Brazil, Chile, Middle East & Africa, Saudi Arabia, UAE, Qatar, and South Africa |
|
Largest Market |
Asia Pacific |
|
Highest Growing Market |
Europe |
According to Stratistics MRC, the Global Automatic Ticket Machine Market is accounted for $3.60 billion in 2022 and is expected to reach $8.43 billion by 2028 growing at a CAGR of 15.2% during the forecast period. Automatic ticket machines (ATMs) are used to generate tickets automatically in public transport and public access points. These machines can act as urban help by displaying static or dynamic information to the user. The advancement of technology in digital payment methods is an increasing trend. Automatic ticket-generating devices with digital payment options are referred to as ticket friend solutions, which allow the use of a smart card to predetermine the transport parameters.
According to the Association of American Railroads (AAR), rail traffic is experiencing a downfall by nearly 21.9% compared to last year.
Market Dynamics:
Driver:
Increased popularity of automatic ticket machines with digital payment options
To ease the high traffic at ticket counters, prominent firms are merging ATMs with digital payment systems. They are also continually integrating digital payment methods in order to acquire real-time consumer data. The unexpected increase in people travelling by airline and train around the world has contributed to the growing popularity of automated tickets generated by smart cards while travelling. Furthermore, nations such as India, Hungary, South Africa, Malaysia, Indonesia, and others are seeing a surge in the use of E-tickets issued using digital payment methods in the entertainment sector. This is due to the widespread use of touch-screen ticketing kiosks in the public transport, public access, and entertainment and gaming sectors.
Restraint:
Failure of operational network
Due to the large number of daily commuting passengers and a lack of security, the public transport sector is confronting the challenge of investing money in the maintenance of automatic ticket machines. Furthermore, the issue of network connectivity impedes machine installation because they require a powerful internet connection to execute numerous duties at once. Furthermore, the abrupt failure of automated ticket machine units puts commercial store infrastructure, multi-specialty centres, and the transportation industry under strain. Sudden breakdown refers to network connectivity failure and outage caused by improper usage.
Opportunity:
Technological development in digital payment options
Manufacturers compete in the market based on variables such as machine innovation, delivery speed, reliability, and after-sales services. To achieve a competitive advantage, major firms are focusing more on machine innovation employing technical advancements such as radio frequency identification (RFID), Zigbee technology, and near field communication (NFC) technology. These new technologies are said to be critical components in the product offerings. They provide remote monitoring and proactive maintenance help to track the proper operation and discover problems with automated ticket machines. These technological advancements complement automatic ticket creation, attracting a bigger number of passengers.
Threat:
High installation cost
Installation of automatic ticket vending machine companies is expensive and includes installing vending machine equipment and checking devices; setting up communication networks (wired networks) and installing network equipment (all types of networks); fixing installed system hardware, fine-tuning, and testing system hardware; and interaction between system components. Bus transit providers require handheld collection devices, whereas tube and railway systems necessitate much larger infrastructure. This raises overall installation costs, slowing market expansion.
Covid-19 Impact
The COVID-19 pandemic has had a negative impact on the expansion of the automatic ticket machine sector. It has disrupted the operating flow of ATM systems at public transportation and entertainment and gaming hubs around the world. Furthermore, the International Air Transport Association (IATA) predicts that if Covid-19 spreads further, global passenger revenue will decline by around 19%. These variables have an indirect impact on the market, and it will face almost nil operational work in the present year as a result of the partial or entire shutdown of numerous industry verticals, including manufacturing, around the world.
The smart cards segment is expected to be the largest during the forecast period
The smart cards segment is estimated to have a lucrative growth, as it provides advantages such as enhanced convenience, security, and reduced manual cash handling over cash payment type. Smart cards with short-range wireless communication can be utilised in contactless payment systems. In the public transport industry, smart cards with embedded RFID chips are gaining acceptance. Furthermore, smart cards are commonly used in the entertainment and gaming industries because they eliminate the need for cash handling while playing a game or viewing a movie.
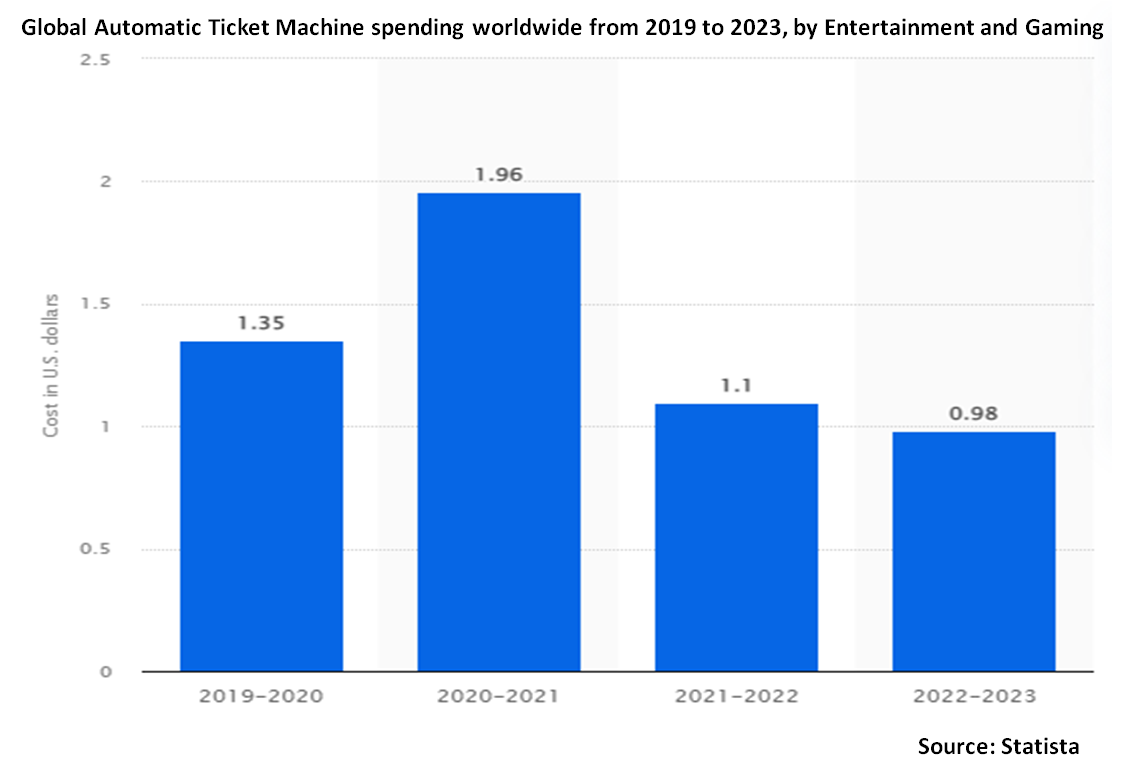
The entertainment and gaming segment is expected to have the highest CAGR during the forecast period
The entertainment and gaming segment is anticipated to witness the highest CAGR growth during the forecast period, which can be attributed to the increase in construction of multi-specialty hubs and commercial stores. This sector provides a just-in-time method for quick ticketing solutions, decreasing the amount of time required. Furthermore, smart ticketing systems have developed dramatically as a result of the use of multimedia, aided by improvements in Artificial Intelligence (AI) technology and IoT implementation.
Region with highest share:
Asia Pacific is projected to hold the largest market share during the forecast period owing to the continually increasing investment in commercial real estate in China and India. Furthermore, the region's growing urbanisation and rising demand for public transport are both favourable indicators for the local market. With increasing train passenger numbers and rising financial support for airport and commercial infrastructure renovations, governmental organisations in this region are making large investments in infrastructure projects and forming alliances to gain a competitive advantage in the market.
Region with highest CAGR:
Europe is projected to have the highest CAGR over the forecast period, due to the presence of the majority of the largest ticket kiosk manufacturers in countries such as Germany and the United Kingdom. In addition, high per capita spending is contributing to market growth in the aforementioned European countries. Furthermore, governmental agencies are giving automatic ticket solutions while travelling via railways, trams, and so on, which has boosted the use of automatic ticket vending machine systems across European Union (EU) countries.

Key players in the market
Some of the key players profiled in the Automatic Ticket Machine Market include Cubic Corporation, Diebold Nixdorf, Incorporated, SBB, Infineon Technologies AG, CPI Card Group Inc., HID Global Corporation/ASSA ABLOY AB, Xerox Corporation, Gemalto NV, NXP Semiconductors, Scheidt & Bachmann GmbH, Gemalto NV and Parkeon.
Key Developments:
In July 2022, NXP Semiconductors collaborated with Hon Hai Technology Group (“Foxconn”) to jointly develop platforms for a new generation of smart connected vehicles.
In May 2019, Infineon Technologies AG collaborated with Rambus.com to provide mobility services in smart ticketing solutions for smart cards and mobiles across the globe. The companies are combining their expertise on ‘CIPURSE’ open standard for smart ticketing and mobile solutions to provide future proof transport ticketing solutions.
Payment Types Covered:
• Mobile Payment
• Smart Card Payment
• Cash Payment
Applications Covered:
• Entertainment and Gaming
• Public Transport
• Other Applications
Regions Covered:
• North America
o US
o Canada
o Mexico
• Europe
o Germany
o UK
o Italy
o France
o Spain
o Rest of Europe
• Asia Pacific
o Japan
o China
o India
o Australia
o New Zealand
o South Korea
o Rest of Asia Pacific
• South America
o Argentina
o Brazil
o Chile
o Rest of South America
• Middle East & Africa
o Saudi Arabia
o UAE
o Qatar
o South Africa
o Rest of Middle East & Africa
What our report offers:
- Market share assessments for the regional and country-level segments
- Strategic recommendations for the new entrants
- Covers Market data for the years 2020, 2021, 2022, 2025, and 2028
- Market Trends (Drivers, Constraints, Opportunities, Threats, Challenges, Investment Opportunities, and recommendations)
- Strategic recommendations in key business segments based on the market estimations
- Competitive landscaping mapping the key common trends
- Company profiling with detailed strategies, financials, and recent developments
- Supply chain trends mapping the latest technological advancements
Free Customization Offerings:
All the customers of this report will be entitled to receive one of the following free customization options:
• Company Profiling
o Comprehensive profiling of additional market players (up to 3)
o SWOT Analysis of key players (up to 3)
• Regional Segmentation
o Market estimations, Forecasts and CAGR of any prominent country as per the client's interest (Note: Depends on feasibility check)
• Competitive Benchmarking
o Benchmarking of key players based on product portfolio, geographical presence, and strategic alliances
Table of Contents
1 Executive Summary
2 Preface
2.1 Abstract
2.2 Stake Holders
2.3 Research Scope
2.4 Research Methodology
2.4.1 Data Mining
2.4.2 Data Analysis
2.4.3 Data Validation
2.4.4 Research Approach
2.5 Research Sources
2.5.1 Primary Research Sources
2.5.2 Secondary Research Sources
2.5.3 Assumptions
3 Market Trend Analysis
3.1 Introduction
3.2 Drivers
3.3 Restraints
3.4 Opportunities
3.5 Threats
3.6 Application Analysis
3.7 Emerging Markets
3.8 Impact of Covid-19
4 Porters Five Force Analysis
4.1 Bargaining power of suppliers
4.2 Bargaining power of buyers
4.3 Threat of substitutes
4.4 Threat of new entrants
4.5 Competitive rivalry
5 Global Automatic Ticket Machine Market, By Payment Type
5.1 Introduction
5.2 Mobile Payment
5.3 Smart Card Payment
5.4 Cash Payment
6 Global Automatic Ticket Machine Market, By Application
6.1 Introduction
6.2 Entertainment and Gaming
6.3 Public Transport
6.4 Other Applications
7 Global Automatic Ticket Machine Market, By Geography
7.1 Introduction
7.2 North America
7.2.1 US
7.2.2 Canada
7.2.3 Mexico
7.3 Europe
7.3.1 Germany
7.3.2 UK
7.3.3 Italy
7.3.4 France
7.3.5 Spain
7.3.6 Rest of Europe
7.4 Asia Pacific
7.4.1 Japan
7.4.2 China
7.4.3 India
7.4.4 Australia
7.4.5 New Zealand
7.4.6 South Korea
7.4.7 Rest of Asia Pacific
7.5 South America
7.5.1 Argentina
7.5.2 Brazil
7.5.3 Chile
7.5.4 Rest of South America
7.6 Middle East & Africa
7.6.1 Saudi Arabia
7.6.2 UAE
7.6.3 Qatar
7.6.4 South Africa
7.6.5 Rest of Middle East & Africa
8 Key Developments
8.1 Agreements, Partnerships, Collaborations and Joint Ventures
8.2 Acquisitions & Mergers
8.3 New Product Launch
8.4 Expansions
8.5 Other Key Strategies
9 Company Profiling
9.1 Cubic Corporation
9.2 Diebold Nixdorf, Incorporated
9.3 SBB
9.4 Infineon Technologies AG
9.5 CPI Card Group Inc.
9.6 HID Global Corporation/ASSA ABLOY AB
9.7 Xerox Corporation
9.8 Gemalto NV
9.9 NXP Semiconductors
9.10 Scheidt & Bachmann GmbH
9.11 Gemalto NV
9.12 Parkeon
List of Tables
1 Global Automatic Ticket Machine Market Outlook, By Region (2020-2028) ($MN)
2 Global Automatic Ticket Machine Market Outlook, By Payment Type (2020-2028) ($MN)
3 Global Automatic Ticket Machine Market Outlook, By Mobile Payment (2020-2028) ($MN)
4 Global Automatic Ticket Machine Market Outlook, By Smart Card Payment (2020-2028) ($MN)
5 Global Automatic Ticket Machine Market Outlook, By Cash Payment (2020-2028) ($MN)
6 Global Automatic Ticket Machine Market Outlook, By Application (2020-2028) ($MN)
7 Global Automatic Ticket Machine Market Outlook, By Entertainment and Gaming (2020-2028) ($MN)
8 Global Automatic Ticket Machine Market Outlook, By Public Transport (2020-2028) ($MN)
9 Global Automatic Ticket Machine Market Outlook, By Other Applications (2020-2028) ($MN)
10 North America Automatic Ticket Machine Market Outlook, By Country (2020-2028) ($MN)
11 North America Automatic Ticket Machine Market Outlook, By Payment Type (2020-2028) ($MN)
12 North America Automatic Ticket Machine Market Outlook, By Mobile Payment (2020-2028) ($MN)
13 North America Automatic Ticket Machine Market Outlook, By Smart Card Payment (2020-2028) ($MN)
14 North America Automatic Ticket Machine Market Outlook, By Cash Payment (2020-2028) ($MN)
15 North America Automatic Ticket Machine Market Outlook, By Application (2020-2028) ($MN)
16 North America Automatic Ticket Machine Market Outlook, By Entertainment and Gaming (2020-2028) ($MN)
17 North America Automatic Ticket Machine Market Outlook, By Public Transport (2020-2028) ($MN)
18 North America Automatic Ticket Machine Market Outlook, By Other Applications (2020-2028) ($MN)
19 Europe Automatic Ticket Machine Market Outlook, By Country (2020-2028) ($MN)
20 Europe Automatic Ticket Machine Market Outlook, By Payment Type (2020-2028) ($MN)
21 Europe Automatic Ticket Machine Market Outlook, By Mobile Payment (2020-2028) ($MN)
22 Europe Automatic Ticket Machine Market Outlook, By Smart Card Payment (2020-2028) ($MN)
23 Europe Automatic Ticket Machine Market Outlook, By Cash Payment (2020-2028) ($MN)
24 Europe Automatic Ticket Machine Market Outlook, By Application (2020-2028) ($MN)
25 Europe Automatic Ticket Machine Market Outlook, By Entertainment and Gaming (2020-2028) ($MN)
26 Europe Automatic Ticket Machine Market Outlook, By Public Transport (2020-2028) ($MN)
27 Europe Automatic Ticket Machine Market Outlook, By Other Applications (2020-2028) ($MN)
28 Asia Pacific Automatic Ticket Machine Market Outlook, By Country (2020-2028) ($MN)
29 Asia Pacific Automatic Ticket Machine Market Outlook, By Payment Type (2020-2028) ($MN)
30 Asia Pacific Automatic Ticket Machine Market Outlook, By Mobile Payment (2020-2028) ($MN)
31 Asia Pacific Automatic Ticket Machine Market Outlook, By Smart Card Payment (2020-2028) ($MN)
32 Asia Pacific Automatic Ticket Machine Market Outlook, By Cash Payment (2020-2028) ($MN)
33 Asia Pacific Automatic Ticket Machine Market Outlook, By Application (2020-2028) ($MN)
34 Asia Pacific Automatic Ticket Machine Market Outlook, By Entertainment and Gaming (2020-2028) ($MN)
35 Asia Pacific Automatic Ticket Machine Market Outlook, By Public Transport (2020-2028) ($MN)
36 Asia Pacific Automatic Ticket Machine Market Outlook, By Other Applications (2020-2028) ($MN)
37 South America Automatic Ticket Machine Market Outlook, By Country (2020-2028) ($MN)
38 South America Automatic Ticket Machine Market Outlook, By Payment Type (2020-2028) ($MN)
39 South America Automatic Ticket Machine Market Outlook, By Mobile Payment (2020-2028) ($MN)
40 South America Automatic Ticket Machine Market Outlook, By Smart Card Payment (2020-2028) ($MN)
41 South America Automatic Ticket Machine Market Outlook, By Cash Payment (2020-2028) ($MN)
42 South America Automatic Ticket Machine Market Outlook, By Application (2020-2028) ($MN)
43 South America Automatic Ticket Machine Market Outlook, By Entertainment and Gaming (2020-2028) ($MN)
44 South America Automatic Ticket Machine Market Outlook, By Public Transport (2020-2028) ($MN)
45 South America Automatic Ticket Machine Market Outlook, By Other Applications (2020-2028) ($MN)
46 Middle East & Africa Automatic Ticket Machine Market Outlook, By Country (2020-2028) ($MN)
47 Middle East & Africa Automatic Ticket Machine Market Outlook, By Payment Type (2020-2028) ($MN)
48 Middle East & Africa Automatic Ticket Machine Market Outlook, By Mobile Payment (2020-2028) ($MN)
49 Middle East & Africa Automatic Ticket Machine Market Outlook, By Smart Card Payment (2020-2028) ($MN)
50 Middle East & Africa Automatic Ticket Machine Market Outlook, By Cash Payment (2020-2028) ($MN)
51 Middle East & Africa Automatic Ticket Machine Market Outlook, By Application (2020-2028) ($MN)
52 Middle East & Africa Automatic Ticket Machine Market Outlook, By Entertainment and Gaming (2020-2028) ($MN)
53 Middle East & Africa Automatic Ticket Machine Market Outlook, By Public Transport (2020-2028) ($MN)
54 Middle East & Africa Automatic Ticket Machine Market Outlook, By Other Applications (2020-2028) ($MN)
List of Figures
RESEARCH METHODOLOGY

We at ‘Stratistics’ opt for an extensive research approach which involves data mining, data validation, and data analysis. The various research sources include in-house repository, secondary research, competitor’s sources, social media research, client internal data, and primary research.
Our team of analysts prefers the most reliable and authenticated data sources in order to perform the comprehensive literature search. With access to most of the authenticated data bases our team highly considers the best mix of information through various sources to obtain extensive and accurate analysis.
Each report takes an average time of a month and a team of 4 industry analysts. The time may vary depending on the scope and data availability of the desired market report. The various parameters used in the market assessment are standardized in order to enhance the data accuracy.
Data Mining
The data is collected from several authenticated, reliable, paid and unpaid sources and is filtered depending on the scope & objective of the research. Our reports repository acts as an added advantage in this procedure. Data gathering from the raw material suppliers, distributors and the manufacturers is performed on a regular basis, this helps in the comprehensive understanding of the products value chain. Apart from the above mentioned sources the data is also collected from the industry consultants to ensure the objective of the study is in the right direction.
Market trends such as technological advancements, regulatory affairs, market dynamics (Drivers, Restraints, Opportunities and Challenges) are obtained from scientific journals, market related national & international associations and organizations.
Data Analysis
From the data that is collected depending on the scope & objective of the research the data is subjected for the analysis. The critical steps that we follow for the data analysis include:
- Product Lifecycle Analysis
- Competitor analysis
- Risk analysis
- Porters Analysis
- PESTEL Analysis
- SWOT Analysis
The data engineering is performed by the core industry experts considering both the Marketing Mix Modeling and the Demand Forecasting. The marketing mix modeling makes use of multiple-regression techniques to predict the optimal mix of marketing variables. Regression factor is based on a number of variables and how they relate to an outcome such as sales or profits.
Data Validation
The data validation is performed by the exhaustive primary research from the expert interviews. This includes telephonic interviews, focus groups, face to face interviews, and questionnaires to validate our research from all aspects. The industry experts we approach come from the leading firms, involved in the supply chain ranging from the suppliers, distributors to the manufacturers and consumers so as to ensure an unbiased analysis.
We are in touch with more than 15,000 industry experts with the right mix of consultants, CEO's, presidents, vice presidents, managers, experts from both supply side and demand side, executives and so on.
The data validation involves the primary research from the industry experts belonging to:
- Leading Companies
- Suppliers & Distributors
- Manufacturers
- Consumers
- Industry/Strategic Consultants
Apart from the data validation the primary research also helps in performing the fill gap research, i.e. providing solutions for the unmet needs of the research which helps in enhancing the reports quality.
For more details about research methodology, kindly write to us at info@strategymrc.com
Frequently Asked Questions
In case of any queries regarding this report, you can contact the customer service by filing the “Inquiry Before Buy” form available on the right hand side. You may also contact us through email: info@strategymrc.com or phone: +1-301-202-5929
Yes, the samples are available for all the published reports. You can request them by filling the “Request Sample” option available in this page.
Yes, you can request a sample with your specific requirements. All the customized samples will be provided as per the requirement with the real data masked.
All our reports are available in Digital PDF format. In case if you require them in any other formats, such as PPT, Excel etc you can submit a request through “Inquiry Before Buy” form available on the right hand side. You may also contact us through email: info@strategymrc.com or phone: +1-301-202-5929
We offer a free 15% customization with every purchase. This requirement can be fulfilled for both pre and post sale. You may send your customization requirements through email at info@strategymrc.com or call us on +1-301-202-5929.
We have 3 different licensing options available in electronic format.
- Single User Licence: Allows one person, typically the buyer, to have access to the ordered product. The ordered product cannot be distributed to anyone else.
- 2-5 User Licence: Allows the ordered product to be shared among a maximum of 5 people within your organisation.
- Corporate License: Allows the product to be shared among all employees of your organisation regardless of their geographical location.
All our reports are typically be emailed to you as an attachment.
To order any available report you need to register on our website. The payment can be made either through CCAvenue or PayPal payments gateways which accept all international cards.
We extend our support to 6 months post sale. A post sale customization is also provided to cover your unmet needs in the report.
Request Customization
We offer complimentary customization of up to 15% with every purchase. To share your customization requirements, feel free to email us at info@strategymrc.com or call us on +1-301-202-5929. .
Please Note: Customization within the 15% threshold is entirely free of charge. If your request exceeds this limit, we will conduct a feasibility assessment. Following that, a detailed quote and timeline will be provided.
WHY CHOOSE US ?

Assured Quality
Best in class reports with high standard of research integrity

24X7 Research Support
Continuous support to ensure the best customer experience.

Free Customization
Adding more values to your product of interest.

Safe & Secure Access
Providing a secured environment for all online transactions.

Trusted by 600+ Brands
Serving the most reputed brands across the world.