
Automotive Logistics Market
Automotive Logistics Market Forecasts to 2028 - Global Analysis By Type (Automobile Parts, Finished Vehicle), Transportation Mode, (Roadways, Railways) and By Geography

|
Years Covered |
2020-2028 |
|
Estimated Year Value (2022) |
US $393.50 BN |
|
Projected Year Value (2028) |
US $678.58 BN |
|
CAGR (2022 - 2028) |
9.5% |
|
Regions Covered |
North America, Europe, Asia Pacific, South America, and Middle East & Africa |
|
Countries Covered |
US, Canada, Mexico, Germany, UK, Italy, France, Spain, Japan, China, India, Australia, New Zealand, South Korea, Rest of Asia Pacific, South America, Argentina, Brazil, Chile, Middle East & Africa, Saudi Arabia, UAE, Qatar, and South Africa |
|
Largest Market |
North America |
|
Fastest Growing Market |
Asia Pacific |
According to Stratistics MRC, the Global Automotive Logistics Market is accounted for $393.50 billion in 2022 and is expected to reach $678.58 billion by 2028 growing at a CAGR of 9.5% during the forecast period. Automotive logistics is the entity flow of the automotive producer's vehicles, components, spare parts, and raw materials in the process of automotive purchase, production, and sales.
The United States light vehicle sales peaked in 2016 with 17.46 million-unit sales, and 2018 marked the fourth consecutive year with over 17 million-unit sales. According to industry sources, global light vehicle production unit sales have been remarkable and continue to grow. APAC is expected to register the highest growth rates in terms of production volumes followed by North America. Furthermore, electric vehicles production and sales are increasing at a record pace, which need specialized logistics.
Market Dynamics:
Driver:
Growing effectiveness in finished vehicle logistics (FVL) operations
Growing operational competence, fewer trucks will be essential. For instance, NVD, an Irish vehicle distributor, optimized its logistical process with intelligent solutions. NVD has condensed customer lead times and doubled up its productivity as they can now load 8-10 cars on a truck within 45 minutes. In comparison, more than 3 hours are consumed in this process across Eastern European facilities. Hence, the increasing efficiency in FVL will motivate the market growth rate over the prediction period.
Restraint:
Lack of truck drivers
Freight charges have augmented promptly over the last few years. The unavailability of truck drivers is a significant factor for the higher costs. The trend of decreased driver supply and growing transport demand from automakers is predictable to continue during the forecast period. For instance, according to the German Freight Forwarding and Logistics Association (DSLV), in Germany, 30,000 drivers on average retire every year. However, only around 2,000 fully trained truck drivers are available for replacement which amounts to a shortage of 45,000 drivers in Germany alone.. Hence, these factors may restrain the market growth.
Opportunity:
Digitalization of operations to augment market
The growing application of software-based systems by automakers to achieve the logistical processes has been providing considerable benefits, such as the surging supply chain transparency and operational efficiency. General Motors was an early adopter of the Outbound Logistics Software. The software has provided noticeably better visibility in-vehicle delivery, better truck utilization and is being used to ramp up deliveries to companies’ dealers. Hence, the digitalization of operations will positively influence the growth of the market during the forecast period.
Threat:
Cost and Location
As the intensity of manufacturing upsurges owing to innovation, consumer demand, and technology, vehicle manufacturers will want to see their suppliers working locally. Automotive companies will want their suppliers to be available in every jurisdiction where they have a manufacturing president. Each business location must be evaluated by the following factors: financing, relocation or recruitment of the workforce, rules and regulations of a new jurisdiction, maintaining client production output quotas and quality, optimizing production lines during the transition, closing down one facility and setting up the other, etc., considering cost and location requires effective financial planning, otherwise companies can miss out on profits.
Impact of Covid- 19
The COVID-19 epidemic has caused disorder on the automotive supply chain and manufacturers. Lockdown scenarios as a result of the crisis have encouraged specialists in the automotive sector to estimate that the industry would experience at least a quarter of a lag in the supply chain of automotive equipment. COVID-19 is being explored in light of shifts in consumer demand, consumer behaviour, as well as supply chain re-routing, purchasing power, government involvement, and market dynamics.
The finished vehicles segment is expected to be the largest during the forecast period
The finished vehicles segment is expected to be the largest during the forecast period, owing to increasing demand for electric vehicles and low emission vehicles. Numerous government enterprises to limit the harmful emission are endorsing the sale of electric and battery-powered vehicles across numerous provinces. Furthermore, governments of diverse areas are proposing tax credits and other various profits on the purchase of electric cars. These factors projected to fuel the growth of segment during the forecast period.
The Domestic segment is expected to have the highest CAGR during the forecast period
The Domestic segment is expected to have the highest CAGR during the forecast period. This growth is attributed to government policies in nations like China, India, and Brazil that subsidize manufacturing. Technology transfer, job creation, and GDP contribution are the main reasons for pursuing this method. The key reason behind executing this strategy is technology transfer, creation of employment, and contribution to the GDP. Additionally, another benefit for the economy was the direct injection of cash and the creation of additional jobs for local suppliers of automotive accessories and spare parts.
Region with highest share:
North America is projected to hold the largest market share during the forecast period. The US market is held by the existence of large vehicle manufacturing companies; increased investments by numerous companies in the country; and advancements in technology, which are gaining prominence among automotive logistics market trends. Stringent emission regulations leading to light-weighting/engine downsizing has also fuelled the growth of the markets in the province. The increasing demand for light-duty vehicles in North America, stringent emission regulations leading to light-weighting/engine downsizing, and infrastructure growth has led to an increase in passenger car production, which in turn motivate the market growth.
Region with highest CAGR:
Asia Pacific is projected to have the highest CAGR over the forecast period, owing to economic growth in India and China has knowingly boosted the market growth in the province. Moreover, economic renewal and increasing e-commerce penetration significantly contributes for the industry growth in India and China. Furthermore, growing investments in railways, roadways, airways, and maritime trade across emerging nations, such as India, China, and Japan, are anticipated to bolster the demand for warehousing and logistics over the forecast period.

Key players in the market
Some of the key players profiled in the Automotive Logistics Market include CEVA Logistics, BLG LOGISTICS GROUP AG & Co. KG, Hellmann Worldwide Logistics, Ryder System, Inc., GEFCO, CFR Rinkens, Penske Automotive Group, Inc., Imperial Logistics, Expeditors International of Washington, Inc., Nippon Express Co. Ltd., Kerry Logistics Network, Schnellecke group ag& co. Kg .
Key Developments:
In February 2021: CEVA Logistics announced that it completed a full RORO charter for nearly 4,000 cars between Libya and South Korea. These two companies employed a specialist carcarrying RORO vessel as part of a cross-selling initiative.
In April 2021: GEFCO partnered through its subsidiary in the UAE with the leading smart trade enabler, DP World, UAE Region, for new car solutions. It now offers automotive customers a flexible, integrated solution for vehicle storage and handling in covered parking DP World, UAE Region’s flagship, Jebel Ali Port.
Types Covered:
• Automobile Parts
• Finished Vehicle
Transportation Modes Covered:
• Roadways
• Railways
• Maritime
• Airways
Sectors Covered:
• Tire
• Passenger Vehicle
• Component
• Commercial Vehicle
Stages Covered:
• Sub-Assembly Modules
• Raw Materials Stage
Activity’s Covered:
• Warehousing & Handling
• Transportation & Handling
• Integrated Service
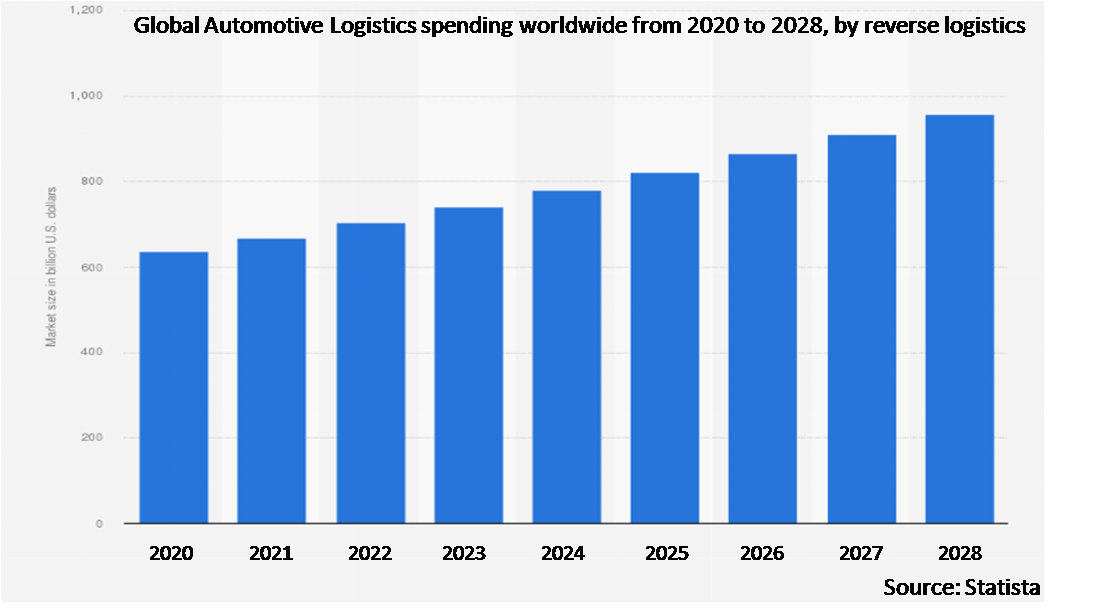
• Reverse Logistics
Distribution Channels Covered:
• Domestic
• International
Regions Covered:
• North America
o US
o Canada
o Mexico
• Europe
o Germany
o UK
o Italy
o France
o Spain
o Rest of Europe
• Asia Pacific
o Japan
o China
o India
o Australia
o New Zealand
o South Korea
o Rest of Asia Pacific
• South America
o Argentina
o Brazil
o Chile
o Rest of South America
• Middle East & Africa
o Saudi Arabia
o UAE
o Qatar
o South Africa
o Rest of Middle East & Africa
What our report offers:
- Market share assessments for the regional and country-level segments
- Strategic recommendations for the new entrants
- Covers Market data for the years 2020, 2021, 2022, 2025 and 2028
- Market Trends (Drivers, Constraints, Opportunities, Threats, Challenges, Investment Opportunities, and recommendations)
- Strategic recommendations in key business segments based on the market estimations
- Competitive landscaping mapping the key common trends
- Company profiling with detailed strategies, financials, and recent developments
- Supply chain trends mapping the latest technological advancements
Free Customization Offerings:
All the customers of this report will be entitled to receive one of the following free customization options:
• Company Profiling
o Comprehensive profiling of additional market players (up to 3)
o SWOT Analysis of key players (up to 3)
• Regional Segmentation
o Market estimations, Forecasts and CAGR of any prominent country as per the client's interest (Note: Depends on feasibility check)
• Competitive Benchmarking
o Benchmarking of key players based on product portfolio, geographical presence, and strategic alliances
Table of Contents
1 Executive Summary
2 Preface
2.1 Abstract
2.2 Stake Holders
2.3 Research Scope
2.4 Research Methodology
2.4.1 Data Mining
2.4.2 Data Analysis
2.4.3 Data Validation
2.4.4 Research Approach
2.5 Research Sources
2.5.1 Primary Research Sources
2.5.2 Secondary Research Sources
2.5.3 Assumptions
3 Market Trend Analysis
3.1 Introduction
3.2 Drivers
3.3 Restraints
3.4 Opportunities
3.5 Threats
3.6 Emerging Markets
3.7 Impact of Covid-19
4 Porters Five Force Analysis
4.1 Bargaining power of suppliers
4.2 Bargaining power of buyers
4.3 Threat of substitutes
4.4 Threat of new entrants
4.5 Competitive rivalry
5 Global Automotive Logistics Market, By Type
5.1 Introduction
5.2 Automobile Parts
5.3 Finished Vehicle
6 Global Automotive Logistics Market, By Transportation Mode
6.1 Introduction
6.2 Roadways
6.3 Railways
6.4 Maritime
6.5 Airways
7 Global Automotive Logistics Market, By Sector
7.1 Introduction
7.2 Tire
7.3 Passenger Vehicle
7.4 Component
7.5 Commercial Vehicle
8 Global Automotive Logistics Market, By Stage
8.1 Introduction
8.2 Sub-Assembly Modules
8.3 Raw Materials Stage
9 Global Automotive Logistics Market, By Activity
9.1 Introduction
9.2 Warehousing & Handling
9.3 Transportation & Handling
9.3.1 Roadways
9.3.2 Railways
9.3.3 Maritime
9.3.4 Airways
9.4 Integrated Service
9.5 Reverse Logistics
10 Global Automotive Logistics Market, By Distribution Channel
10.1 Introduction
10.2 Domestic
10.3 International
11 Global Automotive Logistics Market, By Geography
11.1 Introduction
11.2 North America
11.2.1 US
11.2.2 Canada
11.2.3 Mexico
11.3 Europe
11.3.1 Germany
11.3.2 UK
11.3.3 Italy
11.3.4 France
11.3.5 Spain
11.3.6 Rest of Europe
11.4 Asia Pacific
11.4.1 Japan
11.4.2 China
11.4.3 India
11.4.4 Australia
11.4.5 New Zealand
11.4.6 South Korea
11.4.7 Rest of Asia Pacific
11.5 South America
11.5.1 Argentina
11.5.2 Brazil
11.5.3 Chile
11.5.4 Rest of South America
11.6 Middle East & Africa
11.6.1 Saudi Arabia
11.6.2 UAE
11.6.3 Qatar
11.6.4 South Africa
11.6.5 Rest of Middle East & Africa
12 Key Developments
12.1 Agreements, Partnerships, Collaborations and Joint Ventures
12.2 Acquisitions & Mergers
12.3 New Product Launch
12.4 Expansions
12.5 Other Key Strategies
13 Company Profiling
13.1 CEVA Logistics
13.2 BLG LOGISTICS GROUP AG & Co. KG
13.3 Hellmann Worldwide Logistics
13.4 Ryder System, Inc.
13.5 GEFCO
13.6 CFR Rinkens
13.7 Penske Automotive Group, Inc.
13.8 Imperial Logistics
13.9 Expeditors International of Washington, Inc.
13.10 Nippon Express Co. Ltd.
13.11 Kerry Logistics Network
13.12 Schnellecke group ag& co. Kg
List of Tables
1 Global Automotive Logistics Market Outlook, By Region (2020-2028) ($MN)
2 Global Automotive Logistics Market Outlook, By Type (2020-2028) ($MN)
3 Global Automotive Logistics Market Outlook, By Automobile Parts (2020-2028) ($MN)
4 Global Automotive Logistics Market Outlook, By Finished Vehicle (2020-2028) ($MN)
5 Global Automotive Logistics Market Outlook, By Transportation Mode (2020-2028) ($MN)
6 Global Automotive Logistics Market Outlook, By Roadways (2020-2028) ($MN)
7 Global Automotive Logistics Market Outlook, By Railways (2020-2028) ($MN)
8 Global Automotive Logistics Market Outlook, By Maritime (2020-2028) ($MN)
9 Global Automotive Logistics Market Outlook, By Airways (2020-2028) ($MN)
10 Global Automotive Logistics Market Outlook, By Sector (2020-2028) ($MN)
11 Global Automotive Logistics Market Outlook, By Tire (2020-2028) ($MN)
12 Global Automotive Logistics Market Outlook, By Passenger Vehicle (2020-2028) ($MN)
13 Global Automotive Logistics Market Outlook, By Component (2020-2028) ($MN)
14 Global Automotive Logistics Market Outlook, By Commercial Vehicle (2020-2028) ($MN)
15 Global Automotive Logistics Market Outlook, By Stage (2020-2028) ($MN)
16 Global Automotive Logistics Market Outlook, By Sub-Assembly Modules (2020-2028) ($MN)
17 Global Automotive Logistics Market Outlook, By Raw Materials Stage (2020-2028) ($MN)
18 Global Automotive Logistics Market Outlook, By Activity (2020-2028) ($MN)
19 Global Automotive Logistics Market Outlook, By Warehousing & Handling (2020-2028) ($MN)
20 Global Automotive Logistics Market Outlook, By Transportation & Handling (2020-2028) ($MN)
21 Global Automotive Logistics Market Outlook, By Roadways (2020-2028) ($MN)
22 Global Automotive Logistics Market Outlook, By Railways (2020-2028) ($MN)
23 Global Automotive Logistics Market Outlook, By Maritime (2020-2028) ($MN)
24 Global Automotive Logistics Market Outlook, By Airways (2020-2028) ($MN)
25 Global Automotive Logistics Market Outlook, By Integrated Service (2020-2028) ($MN)
26 Global Automotive Logistics Market Outlook, By Reverse Logistics (2020-2028) ($MN)
27 Global Automotive Logistics Market Outlook, By Distribution Channel (2020-2028) ($MN)
28 Global Automotive Logistics Market Outlook, By Domestic (2020-2028) ($MN)
29 Global Automotive Logistics Market Outlook, By International (2020-2028) ($MN)
30 North America Automotive Logistics Market Outlook, By Country (2020-2028) ($MN)
31 North America Automotive Logistics Market Outlook, By Type (2020-2028) ($MN)
32 North America Automotive Logistics Market Outlook, By Automobile Parts (2020-2028) ($MN)
33 North America Automotive Logistics Market Outlook, By Finished Vehicle (2020-2028) ($MN)
34 North America Automotive Logistics Market Outlook, By Transportation Mode (2020-2028) ($MN)
35 North America Automotive Logistics Market Outlook, By Roadways (2020-2028) ($MN)
36 North America Automotive Logistics Market Outlook, By Railways (2020-2028) ($MN)
37 North America Automotive Logistics Market Outlook, By Maritime (2020-2028) ($MN)
38 North America Automotive Logistics Market Outlook, By Airways (2020-2028) ($MN)
39 North America Automotive Logistics Market Outlook, By Sector (2020-2028) ($MN)
40 North America Automotive Logistics Market Outlook, By Tire (2020-2028) ($MN)
41 North America Automotive Logistics Market Outlook, By Passenger Vehicle (2020-2028) ($MN)
42 North America Automotive Logistics Market Outlook, By Component (2020-2028) ($MN)
43 North America Automotive Logistics Market Outlook, By Commercial Vehicle (2020-2028) ($MN)
44 North America Automotive Logistics Market Outlook, By Stage (2020-2028) ($MN)
45 North America Automotive Logistics Market Outlook, By Sub-Assembly Modules (2020-2028) ($MN)
46 North America Automotive Logistics Market Outlook, By Raw Materials Stage (2020-2028) ($MN)
47 North America Automotive Logistics Market Outlook, By Activity (2020-2028) ($MN)
48 North America Automotive Logistics Market Outlook, By Warehousing & Handling (2020-2028) ($MN)
49 North America Automotive Logistics Market Outlook, By Transportation & Handling (2020-2028) ($MN)
50 North America Automotive Logistics Market Outlook, By Roadways (2020-2028) ($MN)
51 North America Automotive Logistics Market Outlook, By Railways (2020-2028) ($MN)
52 North America Automotive Logistics Market Outlook, By Maritime (2020-2028) ($MN)
53 North America Automotive Logistics Market Outlook, By Airways (2020-2028) ($MN)
54 North America Automotive Logistics Market Outlook, By Integrated Service (2020-2028) ($MN)
55 North America Automotive Logistics Market Outlook, By Reverse Logistics (2020-2028) ($MN)
56 North America Automotive Logistics Market Outlook, By Distribution Channel (2020-2028) ($MN)
57 North America Automotive Logistics Market Outlook, By Domestic (2020-2028) ($MN)
58 North America Automotive Logistics Market Outlook, By International (2020-2028) ($MN)
59 Europe Automotive Logistics Market Outlook, By Country (2020-2028) ($MN)
60 Europe Automotive Logistics Market Outlook, By Type (2020-2028) ($MN)
61 Europe Automotive Logistics Market Outlook, By Automobile Parts (2020-2028) ($MN)
62 Europe Automotive Logistics Market Outlook, By Finished Vehicle (2020-2028) ($MN)
63 Europe Automotive Logistics Market Outlook, By Transportation Mode (2020-2028) ($MN)
64 Europe Automotive Logistics Market Outlook, By Roadways (2020-2028) ($MN)
65 Europe Automotive Logistics Market Outlook, By Railways (2020-2028) ($MN)
66 Europe Automotive Logistics Market Outlook, By Maritime (2020-2028) ($MN)
67 Europe Automotive Logistics Market Outlook, By Airways (2020-2028) ($MN)
68 Europe Automotive Logistics Market Outlook, By Sector (2020-2028) ($MN)
69 Europe Automotive Logistics Market Outlook, By Tire (2020-2028) ($MN)
70 Europe Automotive Logistics Market Outlook, By Passenger Vehicle (2020-2028) ($MN)
71 Europe Automotive Logistics Market Outlook, By Component (2020-2028) ($MN)
72 Europe Automotive Logistics Market Outlook, By Commercial Vehicle (2020-2028) ($MN)
73 Europe Automotive Logistics Market Outlook, By Stage (2020-2028) ($MN)
74 Europe Automotive Logistics Market Outlook, By Sub-Assembly Modules (2020-2028) ($MN)
75 Europe Automotive Logistics Market Outlook, By Raw Materials Stage (2020-2028) ($MN)
76 Europe Automotive Logistics Market Outlook, By Activity (2020-2028) ($MN)
77 Europe Automotive Logistics Market Outlook, By Warehousing & Handling (2020-2028) ($MN)
78 Europe Automotive Logistics Market Outlook, By Transportation & Handling (2020-2028) ($MN)
79 Europe Automotive Logistics Market Outlook, By Roadways (2020-2028) ($MN)
80 Europe Automotive Logistics Market Outlook, By Railways (2020-2028) ($MN)
81 Europe Automotive Logistics Market Outlook, By Maritime (2020-2028) ($MN)
82 Europe Automotive Logistics Market Outlook, By Airways (2020-2028) ($MN)
83 Europe Automotive Logistics Market Outlook, By Integrated Service (2020-2028) ($MN)
84 Europe Automotive Logistics Market Outlook, By Reverse Logistics (2020-2028) ($MN)
85 Europe Automotive Logistics Market Outlook, By Distribution Channel (2020-2028) ($MN)
86 Europe Automotive Logistics Market Outlook, By Domestic (2020-2028) ($MN)
87 Europe Automotive Logistics Market Outlook, By International (2020-2028) ($MN)
88 Asia Pacific Automotive Logistics Market Outlook, By Country (2020-2028) ($MN)
89 Asia Pacific Automotive Logistics Market Outlook, By Type (2020-2028) ($MN)
90 Asia Pacific Automotive Logistics Market Outlook, By Automobile Parts (2020-2028) ($MN)
91 Asia Pacific Automotive Logistics Market Outlook, By Finished Vehicle (2020-2028) ($MN)
92 Asia Pacific Automotive Logistics Market Outlook, By Transportation Mode (2020-2028) ($MN)
93 Asia Pacific Automotive Logistics Market Outlook, By Roadways (2020-2028) ($MN)
94 Asia Pacific Automotive Logistics Market Outlook, By Railways (2020-2028) ($MN)
95 Asia Pacific Automotive Logistics Market Outlook, By Maritime (2020-2028) ($MN)
96 Asia Pacific Automotive Logistics Market Outlook, By Airways (2020-2028) ($MN)
97 Asia Pacific Automotive Logistics Market Outlook, By Sector (2020-2028) ($MN)
98 Asia Pacific Automotive Logistics Market Outlook, By Tire (2020-2028) ($MN)
99 Asia Pacific Automotive Logistics Market Outlook, By Passenger Vehicle (2020-2028) ($MN)
100 Asia Pacific Automotive Logistics Market Outlook, By Component (2020-2028) ($MN)
101 Asia Pacific Automotive Logistics Market Outlook, By Commercial Vehicle (2020-2028) ($MN)
102 Asia Pacific Automotive Logistics Market Outlook, By Stage (2020-2028) ($MN)
103 Asia Pacific Automotive Logistics Market Outlook, By Sub-Assembly Modules (2020-2028) ($MN)
104 Asia Pacific Automotive Logistics Market Outlook, By Raw Materials Stage (2020-2028) ($MN)
105 Asia Pacific Automotive Logistics Market Outlook, By Activity (2020-2028) ($MN)
106 Asia Pacific Automotive Logistics Market Outlook, By Warehousing & Handling (2020-2028) ($MN)
107 Asia Pacific Automotive Logistics Market Outlook, By Transportation & Handling (2020-2028) ($MN)
108 Asia Pacific Automotive Logistics Market Outlook, By Roadways (2020-2028) ($MN)
109 Asia Pacific Automotive Logistics Market Outlook, By Railways (2020-2028) ($MN)
110 Asia Pacific Automotive Logistics Market Outlook, By Maritime (2020-2028) ($MN)
111 Asia Pacific Automotive Logistics Market Outlook, By Airways (2020-2028) ($MN)
112 Asia Pacific Automotive Logistics Market Outlook, By Integrated Service (2020-2028) ($MN)
113 Asia Pacific Automotive Logistics Market Outlook, By Reverse Logistics (2020-2028) ($MN)
114 Asia Pacific Automotive Logistics Market Outlook, By Distribution Channel (2020-2028) ($MN)
115 Asia Pacific Automotive Logistics Market Outlook, By Domestic (2020-2028) ($MN)
116 Asia Pacific Automotive Logistics Market Outlook, By International (2020-2028) ($MN)
117 South America Automotive Logistics Market Outlook, By Country (2020-2028) ($MN)
118 South America Automotive Logistics Market Outlook, By Type (2020-2028) ($MN)
119 South America Automotive Logistics Market Outlook, By Automobile Parts (2020-2028) ($MN)
120 South America Automotive Logistics Market Outlook, By Finished Vehicle (2020-2028) ($MN)
121 South America Automotive Logistics Market Outlook, By Transportation Mode (2020-2028) ($MN)
122 South America Automotive Logistics Market Outlook, By Roadways (2020-2028) ($MN)
123 South America Automotive Logistics Market Outlook, By Railways (2020-2028) ($MN)
124 South America Automotive Logistics Market Outlook, By Maritime (2020-2028) ($MN)
125 South America Automotive Logistics Market Outlook, By Airways (2020-2028) ($MN)
126 South America Automotive Logistics Market Outlook, By Sector (2020-2028) ($MN)
127 South America Automotive Logistics Market Outlook, By Tire (2020-2028) ($MN)
128 South America Automotive Logistics Market Outlook, By Passenger Vehicle (2020-2028) ($MN)
129 South America Automotive Logistics Market Outlook, By Component (2020-2028) ($MN)
130 South America Automotive Logistics Market Outlook, By Commercial Vehicle (2020-2028) ($MN)
131 South America Automotive Logistics Market Outlook, By Stage (2020-2028) ($MN)
132 South America Automotive Logistics Market Outlook, By Sub-Assembly Modules (2020-2028) ($MN)
133 South America Automotive Logistics Market Outlook, By Raw Materials Stage (2020-2028) ($MN)
134 South America Automotive Logistics Market Outlook, By Activity (2020-2028) ($MN)
135 South America Automotive Logistics Market Outlook, By Warehousing & Handling (2020-2028) ($MN)
136 South America Automotive Logistics Market Outlook, By Transportation & Handling (2020-2028) ($MN)
137 South America Automotive Logistics Market Outlook, By Roadways (2020-2028) ($MN)
138 South America Automotive Logistics Market Outlook, By Railways (2020-2028) ($MN)
139 South America Automotive Logistics Market Outlook, By Maritime (2020-2028) ($MN)
140 South America Automotive Logistics Market Outlook, By Airways (2020-2028) ($MN)
141 South America Automotive Logistics Market Outlook, By Integrated Service (2020-2028) ($MN)
142 South America Automotive Logistics Market Outlook, By Reverse Logistics (2020-2028) ($MN)
143 South America Automotive Logistics Market Outlook, By Distribution Channel (2020-2028) ($MN)
144 South America Automotive Logistics Market Outlook, By Domestic (2020-2028) ($MN)
145 South America Automotive Logistics Market Outlook, By International (2020-2028) ($MN)
146 Middle East & Africa Automotive Logistics Market Outlook, By Country (2020-2028) ($MN)
147 Middle East & Africa Automotive Logistics Market Outlook, By Type (2020-2028) ($MN)
148 Middle East & Africa Automotive Logistics Market Outlook, By Automobile Parts (2020-2028) ($MN)
149 Middle East & Africa Automotive Logistics Market Outlook, By Finished Vehicle (2020-2028) ($MN)
150 Middle East & Africa Automotive Logistics Market Outlook, By Transportation Mode (2020-2028) ($MN)
151 Middle East & Africa Automotive Logistics Market Outlook, By Roadways (2020-2028) ($MN)
152 Middle East & Africa Automotive Logistics Market Outlook, By Railways (2020-2028) ($MN)
153 Middle East & Africa Automotive Logistics Market Outlook, By Maritime (2020-2028) ($MN)
154 Middle East & Africa Automotive Logistics Market Outlook, By Airways (2020-2028) ($MN)
155 Middle East & Africa Automotive Logistics Market Outlook, By Sector (2020-2028) ($MN)
156 Middle East & Africa Automotive Logistics Market Outlook, By Tire (2020-2028) ($MN)
157 Middle East & Africa Automotive Logistics Market Outlook, By Passenger Vehicle (2020-2028) ($MN)
158 Middle East & Africa Automotive Logistics Market Outlook, By Component (2020-2028) ($MN)
159 Middle East & Africa Automotive Logistics Market Outlook, By Commercial Vehicle (2020-2028) ($MN)
160 Middle East & Africa Automotive Logistics Market Outlook, By Stage (2020-2028) ($MN)
161 Middle East & Africa Automotive Logistics Market Outlook, By Sub-Assembly Modules (2020-2028) ($MN)
162 Middle East & Africa Automotive Logistics Market Outlook, By Raw Materials Stage (2020-2028) ($MN)
163 Middle East & Africa Automotive Logistics Market Outlook, By Activity (2020-2028) ($MN)
164 Middle East & Africa Automotive Logistics Market Outlook, By Warehousing & Handling (2020-2028) ($MN)
165 Middle East & Africa Automotive Logistics Market Outlook, By Transportation & Handling (2020-2028) ($MN)
166 Middle East & Africa Automotive Logistics Market Outlook, By Roadways (2020-2028) ($MN)
167 Middle East & Africa Automotive Logistics Market Outlook, By Railways (2020-2028) ($MN)
168 Middle East & Africa Automotive Logistics Market Outlook, By Maritime (2020-2028) ($MN)
169 Middle East & Africa Automotive Logistics Market Outlook, By Airways (2020-2028) ($MN)
170 Middle East & Africa Automotive Logistics Market Outlook, By Integrated Service (2020-2028) ($MN)
171 Middle East & Africa Automotive Logistics Market Outlook, By Reverse Logistics (2020-2028) ($MN)
172 Middle East & Africa Automotive Logistics Market Outlook, By Distribution Channel (2020-2028) ($MN)
173 Middle East & Africa Automotive Logistics Market Outlook, By Domestic (2020-2028) ($MN)
174 Middle East & Africa Automotive Logistics Market Outlook, By International (2020-2028) ($MN)
List of Figures
RESEARCH METHODOLOGY

We at ‘Stratistics’ opt for an extensive research approach which involves data mining, data validation, and data analysis. The various research sources include in-house repository, secondary research, competitor’s sources, social media research, client internal data, and primary research.
Our team of analysts prefers the most reliable and authenticated data sources in order to perform the comprehensive literature search. With access to most of the authenticated data bases our team highly considers the best mix of information through various sources to obtain extensive and accurate analysis.
Each report takes an average time of a month and a team of 4 industry analysts. The time may vary depending on the scope and data availability of the desired market report. The various parameters used in the market assessment are standardized in order to enhance the data accuracy.
Data Mining
The data is collected from several authenticated, reliable, paid and unpaid sources and is filtered depending on the scope & objective of the research. Our reports repository acts as an added advantage in this procedure. Data gathering from the raw material suppliers, distributors and the manufacturers is performed on a regular basis, this helps in the comprehensive understanding of the products value chain. Apart from the above mentioned sources the data is also collected from the industry consultants to ensure the objective of the study is in the right direction.
Market trends such as technological advancements, regulatory affairs, market dynamics (Drivers, Restraints, Opportunities and Challenges) are obtained from scientific journals, market related national & international associations and organizations.
Data Analysis
From the data that is collected depending on the scope & objective of the research the data is subjected for the analysis. The critical steps that we follow for the data analysis include:
- Product Lifecycle Analysis
- Competitor analysis
- Risk analysis
- Porters Analysis
- PESTEL Analysis
- SWOT Analysis
The data engineering is performed by the core industry experts considering both the Marketing Mix Modeling and the Demand Forecasting. The marketing mix modeling makes use of multiple-regression techniques to predict the optimal mix of marketing variables. Regression factor is based on a number of variables and how they relate to an outcome such as sales or profits.
Data Validation
The data validation is performed by the exhaustive primary research from the expert interviews. This includes telephonic interviews, focus groups, face to face interviews, and questionnaires to validate our research from all aspects. The industry experts we approach come from the leading firms, involved in the supply chain ranging from the suppliers, distributors to the manufacturers and consumers so as to ensure an unbiased analysis.
We are in touch with more than 15,000 industry experts with the right mix of consultants, CEO's, presidents, vice presidents, managers, experts from both supply side and demand side, executives and so on.
The data validation involves the primary research from the industry experts belonging to:
- Leading Companies
- Suppliers & Distributors
- Manufacturers
- Consumers
- Industry/Strategic Consultants
Apart from the data validation the primary research also helps in performing the fill gap research, i.e. providing solutions for the unmet needs of the research which helps in enhancing the reports quality.
For more details about research methodology, kindly write to us at info@strategymrc.com
Frequently Asked Questions
In case of any queries regarding this report, you can contact the customer service by filing the “Inquiry Before Buy” form available on the right hand side. You may also contact us through email: info@strategymrc.com or phone: +1-301-202-5929
Yes, the samples are available for all the published reports. You can request them by filling the “Request Sample” option available in this page.
Yes, you can request a sample with your specific requirements. All the customized samples will be provided as per the requirement with the real data masked.
All our reports are available in Digital PDF format. In case if you require them in any other formats, such as PPT, Excel etc you can submit a request through “Inquiry Before Buy” form available on the right hand side. You may also contact us through email: info@strategymrc.com or phone: +1-301-202-5929
We offer a free 15% customization with every purchase. This requirement can be fulfilled for both pre and post sale. You may send your customization requirements through email at info@strategymrc.com or call us on +1-301-202-5929.
We have 3 different licensing options available in electronic format.
- Single User Licence: Allows one person, typically the buyer, to have access to the ordered product. The ordered product cannot be distributed to anyone else.
- 2-5 User Licence: Allows the ordered product to be shared among a maximum of 5 people within your organisation.
- Corporate License: Allows the product to be shared among all employees of your organisation regardless of their geographical location.
All our reports are typically be emailed to you as an attachment.
To order any available report you need to register on our website. The payment can be made either through CCAvenue or PayPal payments gateways which accept all international cards.
We extend our support to 6 months post sale. A post sale customization is also provided to cover your unmet needs in the report.
Request Customization
We offer complimentary customization of up to 15% with every purchase. To share your customization requirements, feel free to email us at info@strategymrc.com or call us on +1-301-202-5929. .
Please Note: Customization within the 15% threshold is entirely free of charge. If your request exceeds this limit, we will conduct a feasibility assessment. Following that, a detailed quote and timeline will be provided.
WHY CHOOSE US ?

Assured Quality
Best in class reports with high standard of research integrity

24X7 Research Support
Continuous support to ensure the best customer experience.

Free Customization
Adding more values to your product of interest.

Safe & Secure Access
Providing a secured environment for all online transactions.

Trusted by 600+ Brands
Serving the most reputed brands across the world.