
Blockchain Energy Market
Blockchain Energy Market Forecasts to 2034 – Global Analysis By Platform Type (Public Blockchain Platforms, Private and Permissioned Blockchain Platforms, Consortium and Federated Platforms, and Hybrid and Distributed Ledger Platforms), Application, Offering, End User, and By Geography

Market Dynamics:
Driver:
Energy attribute markets require reliable records across many counterparties
Renewable electricity procurement and distributed energy transactions create records that move between generators, registries, intermediaries and final buyers. When these participants maintain separate databases, reconciling ownership, eligibility and retirement can be slow and costly. A shared ledger can provide a common transaction history and support automated checks before settlement. This is particularly useful where buyers need auditable evidence of environmental attributes across multiple suppliers. Demand therefore arises from practical coordination problems rather than blockchain adoption for its own sake. Platforms that integrate with recognized registries and existing financial processes have a clearer route to commercial use.
Restraint:
Market rules and legacy integration constrain platform deployment
Energy trading is governed by licensing, settlement and consumer protection arrangements that cannot be replaced simply by deploying software. A peer-to-peer platform must still account for network charges, balancing responsibilities and the role of the licensed supplier. Integration with meters, registries and enterprise systems also requires consistent identifiers and data formats. These requirements can make a pilot technically functional yet difficult to expand commercially. Utilities may prefer established databases when a single trusted operator already coordinates the process. Blockchain providers must therefore demonstrate measurable operational benefits after integration and governance costs are included in the evaluation.
Opportunity:
Granular renewable matching and automated certificate workflows
Corporate energy buyers increasingly seek more detailed information about when and where renewable electricity was produced. Digital platforms can connect generation records with consumption data and automate the transfer or retirement of appropriate attributes. A ledger can preserve the audit trail across these steps, while privacy controls limit disclosure of commercially sensitive information. The opportunity extends to smaller buyers that lack the staff to manage several registry accounts. Providers that combine usable procurement interfaces with verified data and interoperable records can expand access to environmental attribute markets, provided their methodology remains compatible with the applicable accounting and certification rules.
Threat:
Faulty source data and weak governance can invalidate trusted records
A permanent transaction record is only as useful as the information and rules attached to it. Compromised meter credentials, incorrect asset registration or duplicate claims outside the platform can undermine environmental assertions even when the ledger itself operates as designed. Smart contract defects and insecure interfaces create additional routes for loss or disruption. Public networks may also expose operators to changes in fees or governance beyond their control. A prominent failure could reduce confidence across the sector and encourage customers to revert to conventional systems. Ongoing data verification, access management and dispute resolution are therefore critical commercial requirements.
Covid-19 Impact:
During COVID-19, energy organizations relied more heavily on remote collaboration and digital transaction processes, making manual reconciliation and paper-based records less convenient. This created interest in automated workflows that blockchain platforms could support, but did not establish a universal need for distributed ledgers. Utility priorities also shifted toward continuity of service, cybersecurity and customer support, delaying some experimental projects. Reduced access to physical sites slowed meter integration and field trials. The longer-term effect was to sharpen the business case: platforms needed to demonstrate reliable remote operation and identifiable administrative savings to compete for limited digital investment budgets.
The Private and Permissioned Blockchain Platforms segment is expected to be the largest during the forecast period
Private and Permissioned Blockchain Platforms are expected to hold the largest platform share because energy companies usually require controlled participation, identifiable counterparties and defined responsibility for sensitive operational data. Permissioned systems can align validation roles with contractual relationships and allow operators to manage access across utilities, traders and registry participants. They also offer a practical framework for compliance reviews and dispute handling. Enterprise procurement favors governance that participants can negotiate directly, with defined rules for data access, transaction validation and dispute handling. Adoption should be strongest where multiple organizations need shared records but cannot expose all transaction details publicly.
The Renewable Energy Certificate Tracking segment is expected to have the highest CAGR during the forecast period
Renewable Energy Certificate Tracking is anticipated to achieve the highest CAGR because it addresses an identifiable transaction and reporting process with established buyers and issuers. Certificate ownership, transfer and retirement can be digitized without requiring immediate changes to physical electricity dispatch. Registry integration also lets platforms build on recognized instruments rather than creating entirely new trading rights. Features such as automated settlement, forward procurement and simplified retirement can reduce administrative effort for corporate buyers. Growth will depend on the credibility of the underlying certificate rules and interoperability between systems, but the application offers a comparatively direct path from software deployment to customer value.
Region with largest share:
Europe is expected to hold the largest regional share, supported by active energy communities, corporate renewable procurement and collaboration among utilities, technology developers and environmental attribute platforms. Powerledger's work with Energie Steiermark in Austria demonstrates practical deployment of customer energy trading interfaces, while Energy Web has developed verification frameworks serving multiple energy-related markets. This environment offers opportunities to test governance and data interoperability across organizations. The regional outlook reflects the breadth of applications and institutional participation rather than assumed universal acceptance of blockchain. Commercial expansion still requires each platform to satisfy local electricity market rules and customer privacy expectations.
Region with highest CAGR:
Asia Pacific is projected to record the highest CAGR as distributed solar, expanding digital services and interest in local energy trading create more potential participants in transaction platforms. Powerledger's documented Tata Power-DDL trial in India and Energy Web's work supporting a Thai certificate marketplace illustrate different routes into the regional market. These examples establish practical learning, while large-scale adoption remains dependent on regulation and integration with incumbent utilities. Growth should favor solutions that simplify settlement and customer participation without requiring users to understand blockchain mechanics. The varied regional policy environment makes adaptable commercial models especially important for sustained expansion.
Key players in the market
Some of the key players in the Blockchain Energy Market include Power Ledger Pty Ltd., Energy Web Foundation, LO3 Energy, Inc., Grid Singularity GmbH, Electron (ElectronX), WePower UAB, IBM Corporation, Siemens AG, Accenture plc, Oracle Corporation, SAP SE, Microsoft Corporation, TenneT TSO GmbH, ENGIE SA, and The Mobility House GmbH.
Key Developments:
In December 2025, Energy Web launched an alpha deployment of its Verified Compute Cloud on Energy Web X. Its initial commercial pilot validated public Sustainable Aviation Fuel Certificate data through multiple participants, providing an adjacent energy-attribute example of how distributed verification can support auditable issuance and retirement processes.
In July 2025, Powerledger announced that TraceX had integrated with ERCOT's renewable energy certificate system. The integration enabled customers to access and compare eligible certificates through the platform and use simplified purchasing and retirement workflows, connecting blockchain-supported transaction records with an established electricity market registry.
In February 2025, Powerledger introduced the Forwards feature on its TraceX renewable certificate marketplace. The functionality supported advance pricing agreements, participant verification and automated settlement steps, extending the platform from spot transactions toward more structured procurement workflows for buyers, generators and intermediaries.
Platform Types Covered:
• Public Blockchain Platforms
• Private and Permissioned Blockchain Platforms
• Consortium and Federated Platforms
• Hybrid and Distributed Ledger Platforms
Applications Covered:
• Peer-to-Peer Energy Trading
• Wholesale Electricity Trading and Settlement
• Renewable Energy Certificate Tracking
• Grid Management and Demand Response
• Carbon Credit and Emissions Tracking
• EV Charging and Billing
Offerings Covered:
• Trading and Transaction Platforms
• Smart Contracts and Automated Settlement
• Energy Attribute and Asset Tracking
• Tokenization and Digital Energy Services
End Users Covered:
• Utilities and Grid Operators
• Energy Producers and Traders
• Commercial and Industrial Energy Buyers
• Prosumers and Energy Communities
• EV Charging Network Operators
Regions Covered:
• North America
o United States
o Canada
o Mexico
• Europe
o United Kingdom
o Germany
o France
o Italy
o Spain
o Netherlands
o Belgium
o Sweden
o Switzerland
o Poland
o Rest of Europe
• Asia Pacific
o China
o Japan
o India
o South Korea
o Australia
o Indonesia
o Thailand
o Malaysia
o Singapore
o Vietnam
o Rest of Asia Pacific
• South America
o Brazil
o Argentina
o Colombia
o Chile
o Peru
o Rest of South America
• Rest of the World (RoW)
o Middle East
Saudi Arabia
United Arab Emirates
Qatar
Israel
Rest of Middle East
o Africa
South Africa
Egypt
Morocco
Rest of Africa
What our report offers:
- Market share assessments for regional and country-level segments
- Strategic recommendations for new entrants in the blockchain energy industry
- Market data for the years 2023, 2024, 2025, 2026, 2027, 2028, 2030, 2032 and 2034
- Analysis of market trends, drivers, constraints, opportunities, threats, challenges and investment opportunities, with recommendations
- Strategic recommendations in key business segments based on market estimations
- Competitive landscape mapping of the main industry trends
- Company profiling covering detailed strategies, financials and recent developments
- Supply chain trends and the latest technological advancements
Free Customization Offerings:
All customers of this report are entitled to receive one of the following free customization options:
• Company Profiling
o Comprehensive profiling of additional market players (up to 3)
o SWOT Analysis of key players (up to 3)
• Regional Segmentation
o Market estimations, forecasts and CAGR for any prominent country of interest to the client (Note: Depends on feasibility check)
• Competitive Benchmarking
o Benchmarking of key players based on product portfolio, geographical presence and strategic alliances
Table of Contents
1 Executive Summary1.1 Market Snapshot and Key Highlights
1.2 Growth Drivers, Challenges, and Opportunities
1.3 Competitive Landscape Overview
1.4 Strategic Insights and Recommendations
2 Research Framework
2.1 Study Objectives and Scope
2.2 Stakeholder Analysis
2.3 Research Assumptions and Limitations
2.4 Research Methodology
2.4.1 Data Collection (Primary and Secondary)
2.4.2 Data Modeling and Estimation Techniques
2.4.3 Data Validation and Triangulation
2.4.4 Analytical and Forecasting Approach
3 Market Dynamics and Trend Analysis
3.1 Market Definition and Structure
3.2 Key Market Drivers
3.3 Market Restraints and Challenges
3.4 Growth Opportunities and Investment Hotspots
3.5 Industry Threats and Risk Assessment
3.6 Technology and Innovation Landscape
3.7 Emerging and High-Growth Markets
3.8 Regulatory and Policy Environment
3.9 Impact of COVID-19 and Recovery Outlook
4 Competitive and Strategic Assessment
4.1 Porter's Five Forces Analysis
4.1.1 Supplier Bargaining Power
4.1.2 Buyer Bargaining Power
4.1.3 Threat of Substitutes
4.1.4 Threat of New Entrants
4.1.5 Competitive Rivalry
4.2 Market Share Analysis of Key Players
4.3 Product Benchmarking and Performance Comparison
5 Global Blockchain Energy Market, By Platform Type
5.1 Public Blockchain Platforms
5.2 Private and Permissioned Blockchain Platforms
5.3 Consortium and Federated Platforms
5.4 Hybrid and Distributed Ledger Platforms
6 Global Blockchain Energy Market, By Application
6.1 Peer-to-Peer Energy Trading
6.2 Wholesale Electricity Trading and Settlement
6.3 Renewable Energy Certificate Tracking
6.4 Grid Management and Demand Response
6.5 Carbon Credit and Emissions Tracking
6.6 EV Charging and Billing
7 Global Blockchain Energy Market, By Offering
7.1 Trading and Transaction Platforms
7.2 Smart Contracts and Automated Settlement
7.3 Energy Attribute and Asset Tracking
7.4 Tokenization and Digital Energy Services
8 Global Blockchain Energy Market, By End User
8.1 Utilities and Grid Operators
8.2 Energy Producers and Traders
8.3 Commercial and Industrial Energy Buyers
8.4 Prosumers and Energy Communities
8.5 EV Charging Network Operators
9 Global Blockchain Energy Market, By Geography
9.1 North America
9.1.1 United States
9.1.2 Canada
9.1.3 Mexico
9.2 Europe
9.2.1 United Kingdom
9.2.2 Germany
9.2.3 France
9.2.4 Italy
9.2.5 Spain
9.2.6 Netherlands
9.2.7 Belgium
9.2.8 Sweden
9.2.9 Switzerland
9.2.10 Poland
9.2.11 Rest of Europe
9.3 Asia Pacific
9.3.1 China
9.3.2 Japan
9.3.3 India
9.3.4 South Korea
9.3.5 Australia
9.3.6 Indonesia
9.3.7 Thailand
9.3.8 Malaysia
9.3.9 Singapore
9.3.10 Vietnam
9.3.11 Rest of Asia Pacific
9.4 South America
9.4.1 Brazil
9.4.2 Argentina
9.4.3 Colombia
9.4.4 Chile
9.4.5 Peru
9.4.6 Rest of South America
9.5 Rest of the World (RoW)
9.5.1 Middle East
9.5.1.1 Saudi Arabia
9.5.1.2 United Arab Emirates
9.5.1.3 Qatar
9.5.1.4 Israel
9.5.1.5 Rest of Middle East
9.5.2 Africa
9.5.2.1 South Africa
9.5.2.2 Egypt
9.5.2.3 Morocco
9.5.2.4 Rest of Africa
10 Strategic Market Intelligence
10.1 Industry Value Network and Supply Chain Assessment
10.2 White-Space and Opportunity Mapping
10.3 Product Evolution and Market Life Cycle Analysis
10.4 Channel, Distributor, and Go-to-Market Assessment
11 Industry Developments and Strategic Initiatives
11.1 Mergers and Acquisitions
11.2 Partnerships, Alliances, and Joint Ventures
11.3 New Product Launches and Certifications
11.4 Capacity Expansion and Investments
11.5 Other Strategic Initiatives
12 Company Profiles
12.1 Power Ledger Pty Ltd.
12.2 Energy Web Foundation
12.3 LO3 Energy, Inc.
12.4 Grid Singularity GmbH
12.5 Electron (ElectronX)
12.6 WePower UAB
12.7 IBM Corporation
12.8 Siemens AG
12.9 Accenture plc
12.10 Oracle Corporation
12.11 SAP SE
12.12 Microsoft Corporation
12.13 TenneT TSO GmbH
12.14 ENGIE SA
12.15 The Mobility House GmbH
List of Tables
1 Global Blockchain Energy Market Outlook, By Region (2023–2034) ($MN)
2 Global Blockchain Energy Market Outlook, By Platform Type (2023–2034) ($MN)
3 Global Blockchain Energy Market Outlook, By Public Blockchain Platforms (2023–2034) ($MN)
4 Global Blockchain Energy Market Outlook, By Private and Permissioned Blockchain Platforms (2023–2034) ($MN)
5 Global Blockchain Energy Market Outlook, By Consortium and Federated Platforms (2023–2034) ($MN)
6 Global Blockchain Energy Market Outlook, By Hybrid and Distributed Ledger Platforms (2023–2034) ($MN)
7 Global Blockchain Energy Market Outlook, By Application (2023–2034) ($MN)
8 Global Blockchain Energy Market Outlook, By Peer-to-Peer Energy Trading (2023–2034) ($MN)
9 Global Blockchain Energy Market Outlook, By Wholesale Electricity Trading and Settlement (2023–2034) ($MN)
10 Global Blockchain Energy Market Outlook, By Renewable Energy Certificate Tracking (2023–2034) ($MN)
11 Global Blockchain Energy Market Outlook, By Grid Management and Demand Response (2023–2034) ($MN)
12 Global Blockchain Energy Market Outlook, By Carbon Credit and Emissions Tracking (2023–2034) ($MN)
13 Global Blockchain Energy Market Outlook, By EV Charging and Billing (2023–2034) ($MN)
14 Global Blockchain Energy Market Outlook, By Offering (2023–2034) ($MN)
15 Global Blockchain Energy Market Outlook, By Trading and Transaction Platforms (2023–2034) ($MN)
16 Global Blockchain Energy Market Outlook, By Smart Contracts and Automated Settlement (2023–2034) ($MN)
17 Global Blockchain Energy Market Outlook, By Energy Attribute and Asset Tracking (2023–2034) ($MN)
18 Global Blockchain Energy Market Outlook, By Tokenization and Digital Energy Services (2023–2034) ($MN)
19 Global Blockchain Energy Market Outlook, By End User (2023–2034) ($MN)
20 Global Blockchain Energy Market Outlook, By Utilities and Grid Operators (2023–2034) ($MN)
21 Global Blockchain Energy Market Outlook, By Energy Producers and Traders (2023–2034) ($MN)
22 Global Blockchain Energy Market Outlook, By Commercial and Industrial Energy Buyers (2023–2034) ($MN)
23 Global Blockchain Energy Market Outlook, By Prosumers and Energy Communities (2023–2034) ($MN)
24 Global Blockchain Energy Market Outlook, By EV Charging Network Operators (2023–2034) ($MN)
Note: Tables for North America, Europe, APAC, South America, and Rest of the World (RoW) Regions are also represented in the same manner as above.
List of Figures
RESEARCH METHODOLOGY
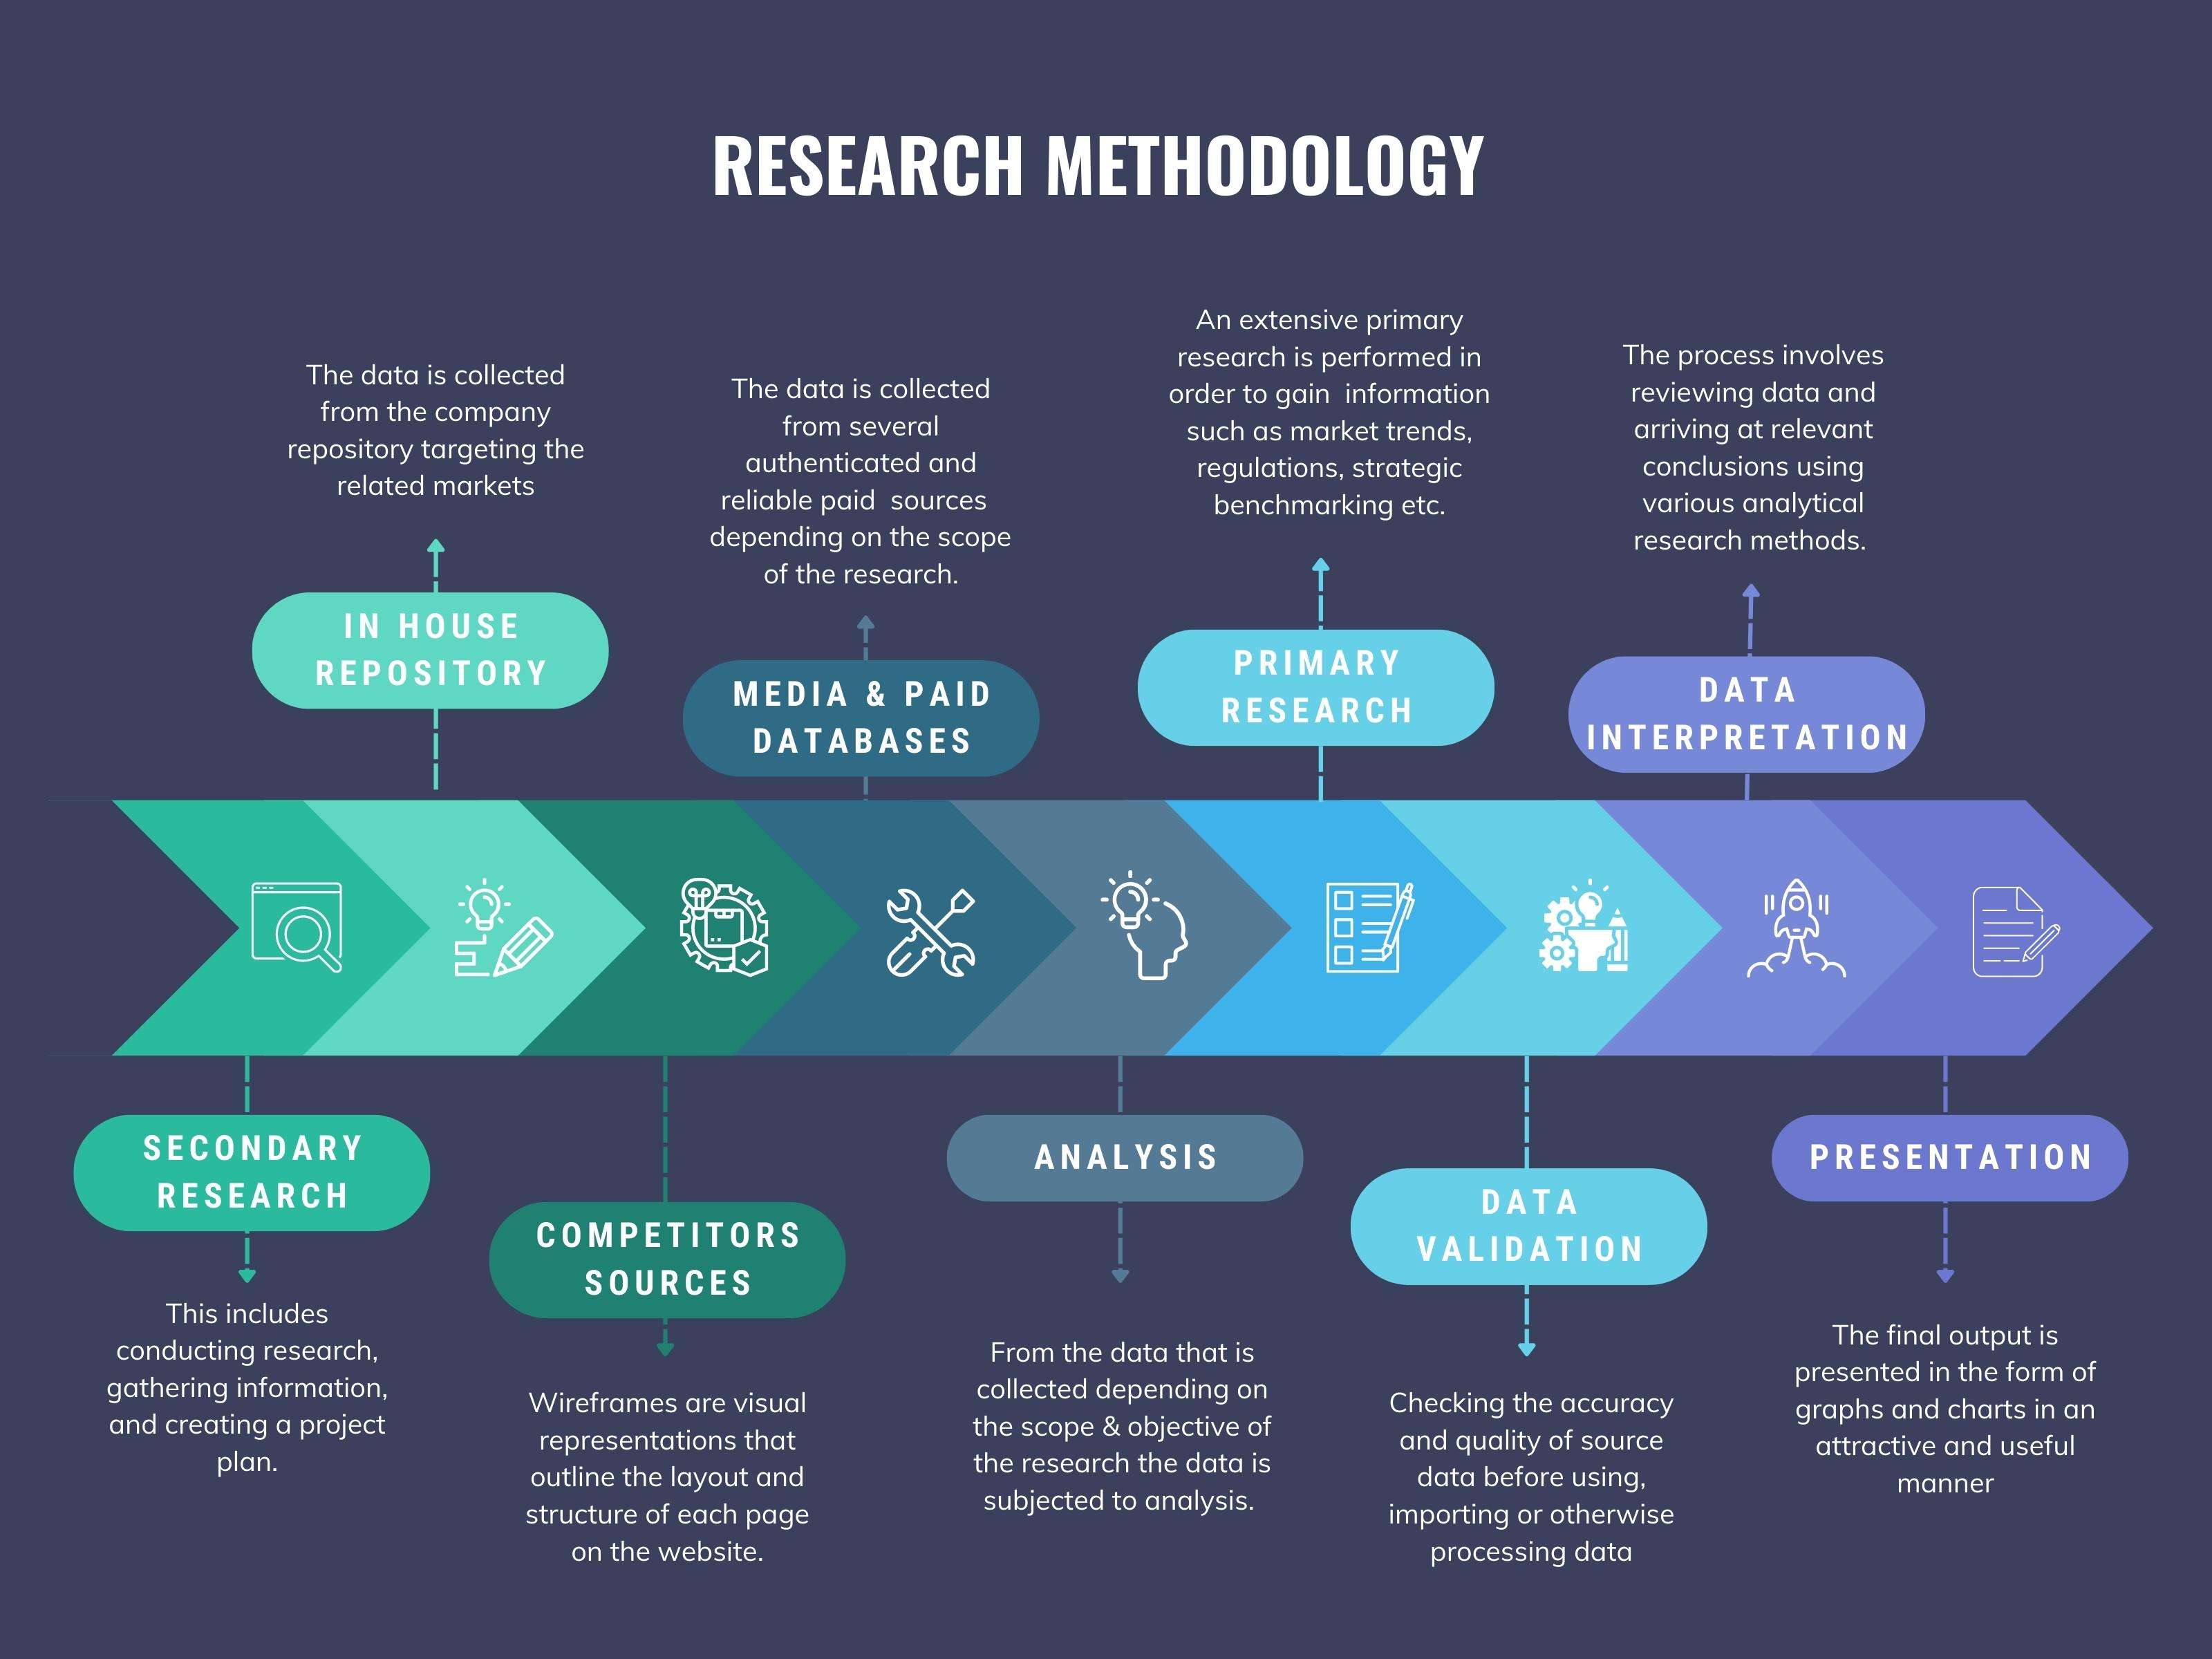
We at ‘Stratistics’ opt for an extensive research approach which involves data mining, data validation, and data analysis. The various research sources include in-house repository, secondary research, competitor’s sources, social media research, client internal data, and primary research.
Our team of analysts prefers the most reliable and authenticated data sources in order to perform the comprehensive literature search. With access to most of the authenticated data bases our team highly considers the best mix of information through various sources to obtain extensive and accurate analysis.
Each report takes an average time of a month and a team of 4 industry analysts. The time may vary depending on the scope and data availability of the desired market report. The various parameters used in the market assessment are standardized in order to enhance the data accuracy.
Data Mining
The data is collected from several authenticated, reliable, paid and unpaid sources and is filtered depending on the scope & objective of the research. Our reports repository acts as an added advantage in this procedure. Data gathering from the raw material suppliers, distributors and the manufacturers is performed on a regular basis, this helps in the comprehensive understanding of the products value chain. Apart from the above mentioned sources the data is also collected from the industry consultants to ensure the objective of the study is in the right direction.
Market trends such as technological advancements, regulatory affairs, market dynamics (Drivers, Restraints, Opportunities and Challenges) are obtained from scientific journals, market related national & international associations and organizations.
Data Analysis
From the data that is collected depending on the scope & objective of the research the data is subjected for the analysis. The critical steps that we follow for the data analysis include:
- Product Lifecycle Analysis
- Competitor analysis
- Risk analysis
- Porters Analysis
- PESTEL Analysis
- SWOT Analysis
The data engineering is performed by the core industry experts considering both the Marketing Mix Modeling and the Demand Forecasting. The marketing mix modeling makes use of multiple-regression techniques to predict the optimal mix of marketing variables. Regression factor is based on a number of variables and how they relate to an outcome such as sales or profits.
Data Validation
The data validation is performed by the exhaustive primary research from the expert interviews. This includes telephonic interviews, focus groups, face to face interviews, and questionnaires to validate our research from all aspects. The industry experts we approach come from the leading firms, involved in the supply chain ranging from the suppliers, distributors to the manufacturers and consumers so as to ensure an unbiased analysis.
We are in touch with more than 15,000 industry experts with the right mix of consultants, CEO's, presidents, vice presidents, managers, experts from both supply side and demand side, executives and so on.
The data validation involves the primary research from the industry experts belonging to:
- Leading Companies
- Suppliers & Distributors
- Manufacturers
- Consumers
- Industry/Strategic Consultants
Apart from the data validation the primary research also helps in performing the fill gap research, i.e. providing solutions for the unmet needs of the research which helps in enhancing the reports quality.
For more details about research methodology, kindly write to us at info@strategymrc.com
Frequently Asked Questions
In case of any queries regarding this report, you can contact the customer service by filing the “Inquiry Before Buy” form available on the right hand side. You may also contact us through email: info@strategymrc.com or phone: +1-301-202-5929
Yes, the samples are available for all the published reports. You can request them by filling the “Request Sample” option available in this page.
Yes, you can request a sample with your specific requirements. All the customized samples will be provided as per the requirement with the real data masked.
All our reports are available in Digital PDF format. In case if you require them in any other formats, such as PPT, Excel etc you can submit a request through “Inquiry Before Buy” form available on the right hand side. You may also contact us through email: info@strategymrc.com or phone: +1-301-202-5929
We offer a free 15% customization with every purchase. This requirement can be fulfilled for both pre and post sale. You may send your customization requirements through email at info@strategymrc.com or call us on +1-301-202-5929.
We have 3 different licensing options available in electronic format.
- Single User Licence: Allows one person, typically the buyer, to have access to the ordered product. The ordered product cannot be distributed to anyone else.
- 2-5 User Licence: Allows the ordered product to be shared among a maximum of 5 people within your organisation.
- Corporate License: Allows the product to be shared among all employees of your organisation regardless of their geographical location.
All our reports are typically be emailed to you as an attachment.
To order any available report you need to register on our website. The payment can be made either through CCAvenue or PayPal payments gateways which accept all international cards.
We extend our support to 6 months post sale. A post sale customization is also provided to cover your unmet needs in the report.
Request Customization
We offer complimentary customization of up to 15% with every purchase. To share your customization requirements, feel free to email us at info@strategymrc.com or call us on +1-301-202-5929. .
Please Note: Customization within the 15% threshold is entirely free of charge. If your request exceeds this limit, we will conduct a feasibility assessment. Following that, a detailed quote and timeline will be provided.
WHY CHOOSE US ?

Assured Quality
Best in class reports with high standard of research integrity

24X7 Research Support
Continuous support to ensure the best customer experience.

Free Customization
Adding more values to your product of interest.

Safe & Secure Access
Providing a secured environment for all online transactions.

Trusted by 600+ Brands
Serving the most reputed brands across the world.