
Circular Fuel Additives Market
Circular Fuel Additives Market Forecasts to 2034 - Global Analysis By Additive Type (Detergents, Antioxidants, Corrosion Inhibitors, Lubricity Improvers, Cetane Improvers and Other Additive Types), Fuel Type, Application and By Geography

|
Years Covered |
2023-2034 |
|
Estimated Year Value (2026) |
US $0.69 BN |
|
Projected Year Value (2034) |
US $1.21 BN |
|
CAGR (2026-2034) |
7.2% |
|
Regions Covered |
North America, Europe, Asia Pacific, South America, and Rest of the World (RoW) |
|
Countries Covered |
United States, Canada, Mexico, United Kingdom, Germany, France, Italy, Spain, Netherlands, Belgium, Sweden, Switzerland, Poland, Rest of Europe, China, Japan, India, South Korea, Australia, Indonesia, Thailand, Malaysia, Singapore, Vietnam, Rest of Asia Pacific, Brazil, Argentina, Colombia, Chile, Peru, Rest of South America, Saudi Arabia, United Arab Emirates, Qatar, Israel, Rest of Middle East, South Africa, Egypt, Morocco, and Rest of Africa. |
|
Largest Market |
North America |
|
Highest Growing Market |
Asia Pacific |
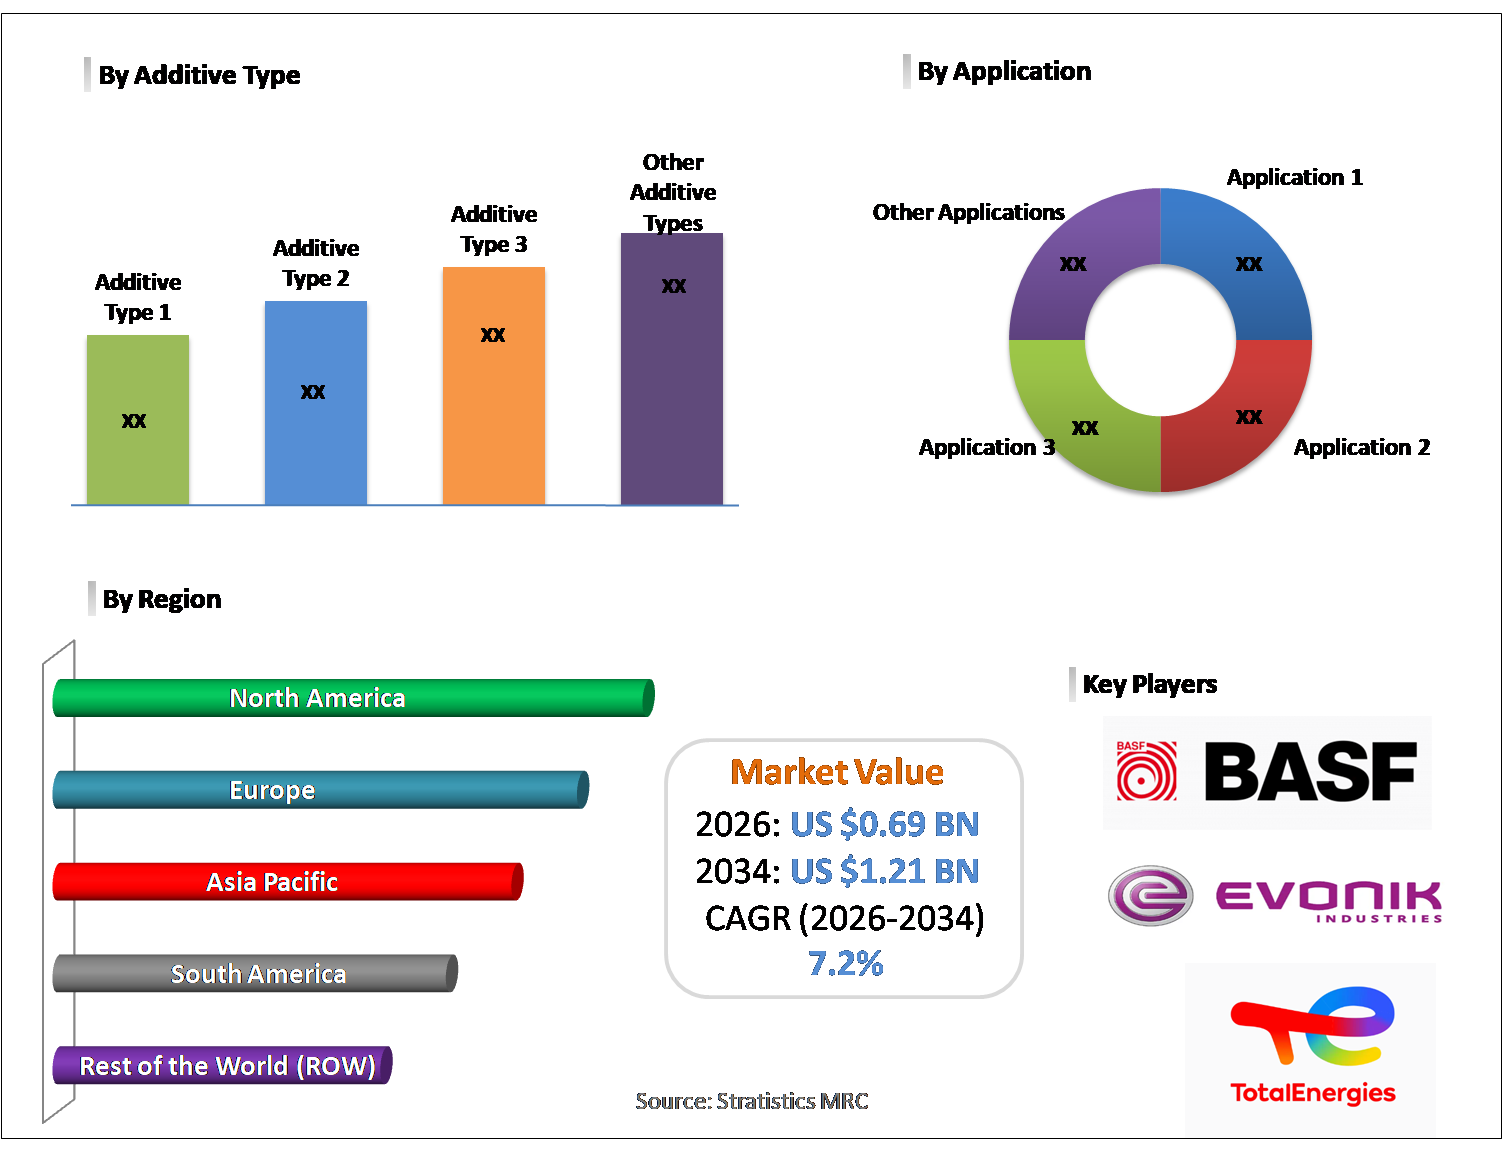
According to Stratistics MRC, the Global Circular Fuel Additives Market is accounted for $0.69 billion in 2026 and is expected to reach $1.21 billion by 2034 growing at a CAGR of 7.2% during the forecast period. Circular fuel additives represent a sustainable approach to fuel enhancement, focusing on recycling and repurposing waste materials for cleaner energy production. They optimize combustion efficiency, reduce harmful emissions, and contribute to longer engine durability. Utilizing renewable or recycled components, these additives diminish reliance on conventional fossil fuels and lower carbon footprints. By aligning with circular economy principles, they provide both environmental and financial advantages. With rising awareness of sustainable energy solutions and stricter regulatory frameworks, the use of circular fuel additives is expanding worldwide, supporting greener energy practices and advancing industrial efforts toward eco-friendly fuel technologies.
According to the International Energy Agency (IEA), the transport sector accounts for about 37% of global final oil demand, making it the single largest consumer of oil worldwide. This underscores the importance of innovations in fuel chemistry to reduce emissions and improve efficiency.
Market Dynamics:
Driver:
Growing demand for sustainable fuels
Rising consumer and industrial preference for green energy solutions is driving the circular fuel additives market. Circular fuel additives allow fuel producers to enhance fuel quality while integrating recycled or renewable materials, promoting cleaner and more sustainable fuels. The shift away from traditional fossil fuels toward environmentally responsible alternatives has heightened interest in these additives. Greater public and industrial awareness of climate change and ecological preservation is prompting innovation in additive technologies. Consequently, circular fuel additives are increasingly adopted to meet the growing need for sustainable fuels, supporting global energy transition goals and minimizing the environmental footprint of fuel consumption.
Restraint:
High production costs
Elevated production costs are a significant barrier to the widespread adoption of circular fuel additives. Their manufacturing involves sophisticated technologies, specialized ingredients, and intensive research efforts, all contributing to higher expenses. Incorporating bio-based or recycled materials adds further processing costs, making these additives less competitive against conventional alternatives. Smaller fuel producers may find adoption economically challenging despite environmental advantages. Consequently, high production costs hinder market expansion and slow the implementation of circular fuel additives, limiting their potential in promoting sustainable fuel practices and delaying the global shift toward environmentally friendly fuel solutions.
Opportunity:
Adoption in aviation and marine fuels
Aviation and marine fuel applications offer substantial growth opportunities for circular fuel additives. These industries face increasing pressure to lower emissions and improve efficiency amid regulatory constraints and high fuel costs. Circular additives can optimize performance in jet fuel, marine diesel, and other specialized fuels while minimizing environmental impact. Tailored formulations can meet the distinct operational needs of aircraft and ships. With airlines and shipping companies prioritizing sustainability, these high-consumption sectors present a promising market for circular additives. Expanding into aviation and marine fuels enables manufacturers to tap lucrative opportunities and promote eco-friendly fuel practices across global transportation networks.
Threat:
Competition from conventional additives
Circular fuel additives are threatened by competition from traditional fuel additives, which are cost-efficient, widely accessible, and have established reliability. Many fuel producers prefer conventional options due to familiarity and proven performance, limiting the adoption of sustainable alternatives. Concerns over cost, compatibility with engines, and performance of circular additives make producers cautious. Strong customer loyalty and entrenched supply chains for conventional additives further restrict market penetration. Consequently, despite offering environmental and efficiency benefits, circular fuel additives risk slow uptake, highlighting the challenge of competing with well-established traditional additive products in a competitive fuel industry.
Covid-19 Impact:
The COVID‑19 pandemic adversely affected the circular fuel additives market, causing disruptions in production and supply chains due to lockdowns and restricted industrial activity. Reduced operations in automotive, aviation, and marine sectors lowered demand for fuel additives. Procurement of recycled and bio-based raw materials faced delays, while investments in new technologies were deferred as companies focused on financial resilience. Despite these challenges, the crisis emphasized the need for sustainable and adaptable fuel solutions, prompting increased interest in circular fuel additives. As transportation and industrial activities resume, market recovery is underway, with renewed focus on environmentally friendly and efficient fuel technologies.
The detergents segment is expected to be the largest during the forecast period
The detergents segment is expected to account for the largest market share during the forecast period because they play a critical role in keeping engines clean and operating efficiently. By minimizing deposits, reducing carbon accumulation, and promoting better fuel combustion, they ensure superior engine performance and longevity. Their widespread application across automotive, industrial, and marine sectors highlights their importance. Increasing emphasis on high-quality fuels and compliance with stringent emission norms further boosts their adoption. Manufacturers prioritize detergent additives to achieve fuel performance and regulatory standards, establishing this segment as the leading contributor to the market and reinforcing its central role in sustainable and efficient fuel solutions.
The biofuels segment is expected to have the highest CAGR during the forecast period
Over the forecast period, the biofuels segment is predicted to witness the highest growth rate, driven by rising global demand for sustainable and renewable energy solutions. Circular fuel additives improve biofuel combustion, fuel efficiency, and emission reduction, enhancing their viability compared to traditional fuels. Supportive government policies, environmental initiatives, and incentives to curb carbon emissions encourage the adoption of biofuels with such additives. As industries prioritize eco-friendly energy alternatives, the use of circular fuel additives in biofuel formulations is expanding rapidly. This trend positions biofuels as the fastest-growing segment, fueling substantial market growth and highlighting the transition toward greener fuel technologies.
Region with largest share:
During the forecast period, the North America region is expected to hold the largest market share, owing to its mature automotive, industrial, and fuel production industries. Strong environmental policies and strict emission standards drive the implementation of sustainable fuel technologies, including circular additives. Consumers’ growing awareness of eco-friendly practices and fuel efficiency also fuels market expansion. Advanced research facilities, efficient supply chains, and government support facilitate the development and adoption of circular fuel additives across the region. Combined, these factors make North America the dominant market in terms of share, demonstrating high integration of circular fuel additives in fuels and reinforcing its position as a key leader in sustainable fuel solutions.
Region with highest CAGR:
Over the forecast period, the Asia Pacific region is anticipated to exhibit the highest CAGR, fueled by accelerated industrialization, rising automotive manufacturing, and higher fuel demand. Heightened environmental awareness and stringent emission norms in nations like China, India, and Japan are encouraging the use of circular fuel additives. Government programs supporting clean energy and renewable fuel adoption further enhance market opportunities. The region also benefits from increasing R&D efforts and the emergence of new additive manufacturers, facilitating quicker adoption. Together, these factors position Asia Pacific as the region with the highest growth rate, driving rapid expansion and widespread use of circular fuel additives.

Key players in the market
Some of the key players in Circular Fuel Additives Market include BASF SE, Evonik Industries AG, Innospec Inc., TotalEnergies SE, Lubrizol Corporation, Dow Inc., Clariant, Afton Chemical, Dorf Ketal Chemicals, Chevron Corporation, Exxon Mobil Corporation, Infineum International Limited, Baker Hughes Company, Cargill Incorporated, Croda International Plc, LANXESS, Eni SpA and Royal Dutch Shell plc.
Key Developments:
In October 2025, BASF SE and ANDRITZ Group have signed a license agreement for the use of BASF’s proprietary gas treatment technology, OASE® blue, in a carbon capture project planned to be implemented in the city of Aarhus, Denmark. The project aims to capture approximately 435,000 tons of CO2 annually from the flue gases of a waste-to-energy plant for sequestration; the city of Aarhus has set itself the goal of becoming CO2-neutral by 2030.
In October 2025, Dow and MEGlobal have finalized an agreement for Dow to supply an additional equivalent to 100 KTA of ethylene from its Gulf Coast operations. The ethylene will serve as a key feedstock for MEGlobal’s ethylene glycol (EG) manufacturing facility co-located at Dow’s and MEGlobal’s Oyster Creek site.
In March 2025, Evonik has entered into an exclusive agreement with the Cleveland-based Sea-Land Chemical Company for the distribution of its cleaning solutions in the U.S. The agreement builds on a long-standing relationship with the distributor and expands the reach of Evonik’s cleaning solutions to the entire U.S. region.
Additive Types Covered:
• Detergents
• Antioxidants
• Corrosion Inhibitors
• Lubricity Improvers
• Cetane Improvers
• Other Additive Types
Fuel Types Covered:
• Fossil Fuels
• Biofuels
• Synthetic Fuels
Applications Covered:
• Transportation
• Aviation
• Marine
• Industrial
Regions Covered:
• North America
o United States
o Canada
o Mexico
• Europe
o United Kingdom
o Germany
o France
o Italy
o Spain
o Netherlands
o Belgium
o Sweden
o Switzerland
o Poland
o Rest of Europe
• Asia Pacific
o China
o Japan
o India
o South Korea
o Australia
o Indonesia
o Thailand
o Malaysia
o Singapore
o Vietnam
o Rest of Asia Pacific
• South America
o Brazil
o Argentina
o Colombia
o Chile
o Peru
o Rest of South America
• Rest of the World (RoW)
o Middle East
§ Saudi Arabia
§ United Arab Emirates
§ Qatar
§ Israel
§ Rest of Middle East
o Africa
§ South Africa
§ Egypt
§ Morocco
§ Rest of Africa
What our report offers:
- Market share assessments for the regional and country-level segments
- Strategic recommendations for the new entrants
- Covers Market data for the years 2023, 2024, 2025, 2026, 2027, 2028, 2030, 2032 and 2034
- Market Trends (Drivers, Constraints, Opportunities, Threats, Challenges, Investment Opportunities, and recommendations)
- Strategic recommendations in key business segments based on the market estimations
- Competitive landscaping mapping the key common trends
- Company profiling with detailed strategies, financials, and recent developments
- Supply chain trends mapping the latest technological advancements
Free Customization Offerings:
All the customers of this report will be entitled to receive one of the following free customization options:
• Company Profiling
o Comprehensive profiling of additional market players (up to 3)
o SWOT Analysis of key players (up to 3)
• Regional Segmentation
o Market estimations, Forecasts and CAGR of any prominent country as per the client's interest (Note: Depends on feasibility check)
• Competitive Benchmarking
o Benchmarking of key players based on product portfolio, geographical presence, and strategic alliance
Table of Contents
1 Executive Summary
1.1 Market Snapshot and Key Highlights
1.2 Growth Drivers, Challenges, and Opportunities
1.3 Competitive Landscape Overview
1.4 Strategic Insights and Recommendations
2 Research Framework
2.1 Study Objectives and Scope
2.2 Stakeholder Analysis
2.3 Research Assumptions and Limitations
2.4 Research Methodology
2.4.1 Data Collection (Primary and Secondary)
2.4.2 Data Modeling and Estimation Techniques
2.4.3 Data Validation and Triangulation
2.4.4 Analytical and Forecasting Approach
3 Market Dynamics and Trend Analysis
3.1 Market Definition and Structure
3.2 Key Market Drivers
3.3 Market Restraints and Challenges
3.4 Growth Opportunities and Investment Hotspots
3.5 Industry Threats and Risk Assessment
3.6 Technology and Innovation Landscape
3.7 Emerging and High-Growth Markets
3.8 Regulatory and Policy Environment
3.9 Impact of COVID-19 and Recovery Outlook
4 Competitive and Strategic Assessment
4.1 Porter's Five Forces Analysis
4.1.1 Supplier Bargaining Power
4.1.2 Buyer Bargaining Power
4.1.3 Threat of Substitutes
4.1.4 Threat of New Entrants
4.1.5 Competitive Rivalry
4.2 Market Share Analysis of Key Players
4.3 Product Benchmarking and Performance Comparison
5 Global Circular Fuel Additives Market, By Additive Type
5.1 Detergents
5.2 Antioxidants
5.3 Corrosion Inhibitors
5.4 Lubricity Improvers
5.5 Cetane Improvers
5.6 Other Additive Types
6 Global Circular Fuel Additives Market, By Fuel Type
6.1 Fossil Fuels
6.2 Biofuels
6.3 Synthetic Fuels
7 Global Circular Fuel Additives Market, By Application
7.1 Transportation
7.2 Aviation
7.3 Marine
7.4 Industrial
8 Global Circular Fuel Additives Market, By Geography
8.1 North America
8.1.1 United States
8.1.2 Canada
8.1.3 Mexico
8.2 Europe
8.2.1 United Kingdom
8.2.2 Germany
8.2.3 France
8.2.4 Italy
8.2.5 Spain
8.2.6 Netherlands
8.2.7 Belgium
8.2.8 Sweden
8.2.9 Switzerland
8.2.10 Poland
8.2.11 Rest of Europe
8.3 Asia Pacific
8.3.1 China
8.3.2 Japan
8.3.3 India
8.3.4 South Korea
8.3.5 Australia
8.3.6 Indonesia
8.3.7 Thailand
8.3.8 Malaysia
8.3.9 Singapore
8.3.10 Vietnam
8.3.11 Rest of Asia Pacific
8.4 South America
8.4.1 Brazil
8.4.2 Argentina
8.4.3 Colombia
8.4.4 Chile
8.4.5 Peru
8.4.6 Rest of South America
8.5 Rest of the World (RoW)
8.5.1 Middle East
8.5.1.1 Saudi Arabia
8.5.1.2 United Arab Emirates
8.5.1.3 Qatar
8.5.1.4 Israel
8.5.1.5 Rest of Middle East
8.5.2 Africa
8.5.2.1 South Africa
8.5.2.2 Egypt
8.5.2.3 Morocco
8.5.2.4 Rest of Africa
9 Strategic Market Intelligence
9.1 Industry Value Network and Supply Chain Assessment
9.2 White-Space and Opportunity Mapping
9.3 Product Evolution and Market Life Cycle Analysis
9.4 Channel, Distributor, and Go-to-Market Assessment
10 Industry Developments and Strategic Initiatives
10.1 Mergers and Acquisitions
10.2 Partnerships, Alliances, and Joint Ventures
10.3 New Product Launches and Certifications
10.4 Capacity Expansion and Investments
10.5 Other Strategic Initiatives
11 Company Profiles
11.1 BASF SE
11.2 Evonik Industries AG
11.3 Innospec Inc.
11.4 TotalEnergies SE
11.5 Lubrizol Corporation
11.6 Dow Inc.
11.7 Clariant
11.8 Afton Chemical
11.9 Dorf Ketal Chemicals
11.10 Chevron Corporation
11.11 Exxon Mobil Corporation
11.12 Infineum International Limited
11.13 Baker Hughes Company
11.14 Cargill Incorporated
11.15 Croda International Plc
11.16 LANXESS
11.17 Eni SpA
11.18 Royal Dutch Shell plc
List of Tables
1 Global Circular Fuel Additives Market Outlook, By Region (2023-2034) ($MN)
2 Global Circular Fuel Additives Market Outlook, By Additive Type (2023-2034) ($MN)
3 Global Circular Fuel Additives Market Outlook, By Detergents (2023-2034) ($MN)
4 Global Circular Fuel Additives Market Outlook, By Antioxidants (2023-2034) ($MN)
5 Global Circular Fuel Additives Market Outlook, By Corrosion Inhibitors (2023-2034) ($MN)
6 Global Circular Fuel Additives Market Outlook, By Lubricity Improvers (2023-2034) ($MN)
7 Global Circular Fuel Additives Market Outlook, By Cetane Improvers (2023-2034) ($MN)
8 Global Circular Fuel Additives Market Outlook, By Other Additive Types (2023-2034) ($MN)
9 Global Circular Fuel Additives Market Outlook, By Fuel Type (2023-2034) ($MN)
10 Global Circular Fuel Additives Market Outlook, By Fossil Fuels (2023-2034) ($MN)
11 Global Circular Fuel Additives Market Outlook, By Biofuels (2023-2034) ($MN)
12 Global Circular Fuel Additives Market Outlook, By Synthetic Fuels (2023-2034) ($MN)
13 Global Circular Fuel Additives Market Outlook, By Application (2023-2034) ($MN)
14 Global Circular Fuel Additives Market Outlook, By Transportation (2023-2034) ($MN)
15 Global Circular Fuel Additives Market Outlook, By Aviation (2023-2034) ($MN)
16 Global Circular Fuel Additives Market Outlook, By Marine (2023-2034) ($MN)
17 Global Circular Fuel Additives Market Outlook, By Industrial (2023-2034) ($MN)
Note: Tables for North America, Europe, APAC, South America, and Rest of the World (RoW) Regions are also represented in the same manner as above.
List of Figures
RESEARCH METHODOLOGY

We at ‘Stratistics’ opt for an extensive research approach which involves data mining, data validation, and data analysis. The various research sources include in-house repository, secondary research, competitor’s sources, social media research, client internal data, and primary research.
Our team of analysts prefers the most reliable and authenticated data sources in order to perform the comprehensive literature search. With access to most of the authenticated data bases our team highly considers the best mix of information through various sources to obtain extensive and accurate analysis.
Each report takes an average time of a month and a team of 4 industry analysts. The time may vary depending on the scope and data availability of the desired market report. The various parameters used in the market assessment are standardized in order to enhance the data accuracy.
Data Mining
The data is collected from several authenticated, reliable, paid and unpaid sources and is filtered depending on the scope & objective of the research. Our reports repository acts as an added advantage in this procedure. Data gathering from the raw material suppliers, distributors and the manufacturers is performed on a regular basis, this helps in the comprehensive understanding of the products value chain. Apart from the above mentioned sources the data is also collected from the industry consultants to ensure the objective of the study is in the right direction.
Market trends such as technological advancements, regulatory affairs, market dynamics (Drivers, Restraints, Opportunities and Challenges) are obtained from scientific journals, market related national & international associations and organizations.
Data Analysis
From the data that is collected depending on the scope & objective of the research the data is subjected for the analysis. The critical steps that we follow for the data analysis include:
- Product Lifecycle Analysis
- Competitor analysis
- Risk analysis
- Porters Analysis
- PESTEL Analysis
- SWOT Analysis
The data engineering is performed by the core industry experts considering both the Marketing Mix Modeling and the Demand Forecasting. The marketing mix modeling makes use of multiple-regression techniques to predict the optimal mix of marketing variables. Regression factor is based on a number of variables and how they relate to an outcome such as sales or profits.
Data Validation
The data validation is performed by the exhaustive primary research from the expert interviews. This includes telephonic interviews, focus groups, face to face interviews, and questionnaires to validate our research from all aspects. The industry experts we approach come from the leading firms, involved in the supply chain ranging from the suppliers, distributors to the manufacturers and consumers so as to ensure an unbiased analysis.
We are in touch with more than 15,000 industry experts with the right mix of consultants, CEO's, presidents, vice presidents, managers, experts from both supply side and demand side, executives and so on.
The data validation involves the primary research from the industry experts belonging to:
- Leading Companies
- Suppliers & Distributors
- Manufacturers
- Consumers
- Industry/Strategic Consultants
Apart from the data validation the primary research also helps in performing the fill gap research, i.e. providing solutions for the unmet needs of the research which helps in enhancing the reports quality.
For more details about research methodology, kindly write to us at info@strategymrc.com
Frequently Asked Questions
In case of any queries regarding this report, you can contact the customer service by filing the “Inquiry Before Buy” form available on the right hand side. You may also contact us through email: info@strategymrc.com or phone: +1-301-202-5929
Yes, the samples are available for all the published reports. You can request them by filling the “Request Sample” option available in this page.
Yes, you can request a sample with your specific requirements. All the customized samples will be provided as per the requirement with the real data masked.
All our reports are available in Digital PDF format. In case if you require them in any other formats, such as PPT, Excel etc you can submit a request through “Inquiry Before Buy” form available on the right hand side. You may also contact us through email: info@strategymrc.com or phone: +1-301-202-5929
We offer a free 15% customization with every purchase. This requirement can be fulfilled for both pre and post sale. You may send your customization requirements through email at info@strategymrc.com or call us on +1-301-202-5929.
We have 3 different licensing options available in electronic format.
- Single User Licence: Allows one person, typically the buyer, to have access to the ordered product. The ordered product cannot be distributed to anyone else.
- 2-5 User Licence: Allows the ordered product to be shared among a maximum of 5 people within your organisation.
- Corporate License: Allows the product to be shared among all employees of your organisation regardless of their geographical location.
All our reports are typically be emailed to you as an attachment.
To order any available report you need to register on our website. The payment can be made either through CCAvenue or PayPal payments gateways which accept all international cards.
We extend our support to 6 months post sale. A post sale customization is also provided to cover your unmet needs in the report.
Request Customization
We offer complimentary customization of up to 15% with every purchase. To share your customization requirements, feel free to email us at info@strategymrc.com or call us on +1-301-202-5929. .
Please Note: Customization within the 15% threshold is entirely free of charge. If your request exceeds this limit, we will conduct a feasibility assessment. Following that, a detailed quote and timeline will be provided.
WHY CHOOSE US ?

Assured Quality
Best in class reports with high standard of research integrity

24X7 Research Support
Continuous support to ensure the best customer experience.

Free Customization
Adding more values to your product of interest.

Safe & Secure Access
Providing a secured environment for all online transactions.

Trusted by 600+ Brands
Serving the most reputed brands across the world.