
Commercial Vehicle Tires Market
Commercial Vehicle Tires Market Forecasts to 2028 – Global Analysis By Product (Bias Tyre, Radial Tyre), Terrain (Off-Road, On-Road), Sales Channel (Online, Offline), Application (Construction, Transport, Agriculture, Mining), End User (Aftermarket, Original Equipment Manufacturer (OEM)), and By Geography
|
Years Covered |
2020-2028 |
|
CAGR (2021 - 2028) |
5.6% |
|
Regions Covered |
North America, Europe, Asia Pacific, South America, and Middle East & Africa |
|
Countries Covered |
US, Canada, Mexico, Germany, UK, Italy, France, Spain, Japan, China, India, Australia, New Zealand, South Korea, Rest of Asia Pacific, South America, Argentina, Brazil, Chile, Middle East & Africa, Saudi Arabia, UAE, Qatar, and South Africa |
|
Largest Market |
North America |
|
Fastest Growing Market |
Asia Pacific |
According to Stratistics MRC, the Global Commercial Vehicle Tires Market is expected to growing at a CAGR of 5.6% during the forecast period. The tires are the only module of a vehicle which comes in direct contact with the road. Tires in commercial vehicles are equipped to handle all sort of rough conditions including sand, unpaved roads, dirt and rocks can even be the norm in some places. They are exposed to numerous inappropriate environments and road conditions that involve the manufacturers to manufacture specific tires for a meticulous environment and whether conditions such as winter, all-season, and summer tires.
Market Dynamics:
Driver:
Advancement of technology in the manufacturing process of the tires
Advancements in tire manufacturing technology, such as the exploit of nanotechnology, are aimed at dropping the rate of wear and tear of tires. The use of such higher manufacturing technologies makes the tires more durable, gives them superior performance, and provides enhanced comfort to the vehicle. Nanotechnology is used in the manufacturing of high-performance tires as well as normal tires. Thus, the tires can purpose in a wide range of temperatures and have advanced heat resistance. Moreover, a slick racing tire with abridged stride is used on dry tracks as it guarantees the slightest traction by providing the most considerable contact casing to the road. An additional development in the manufacturing process of the tire is with the lower-tech development in the tire, and it could lead to a more considerable impact on the market. The threads of tire are baked during the manufacturing process; the color recognition lets you know when it’s time to replace the tires, providing additional safety to the end-users.
Restraint:
Volatility in raw material pricing
Volatility in raw material pricing is expected to continue to dampen commercial vehicle tire market growth. The prerequisite for achieving a duty-free procedure poses commercial and conformity challenges for both vehicle and parts manufacturers. Price instability and the demand-supply gap in the raw materials required for production of commercial vehicle tires. Surging prices of butadiene and EPDM rubber due to a limited production is expected to cause a trickle-down effect in the commercial vehicle tire market. Although tire manufacturing companies are continuously investing in developing sustainable materials, the volume of waste produced due to tires currently is mounting. Stringent government guidelines involving tire manufacturing companies for investing in research and development of effective and sustainable waste management solutions are anticipated to incur additional costs for manufacturers.
Opportunity:
Increasing demand for construction machinery tires
Over the last few years, the demand for construction machineries such as wheel loaders, cranes, bulldozers, and others has been primarily driven by an increase in the volume of construction projects and expanding construction budgets, particularly in developing countries around the world. This is providing the enormous opportunities to the market for commercial vehicle tires. The demand for tire retreads has also been increasing for these vehicles, as fleet managers/operators continue to leverage retread programs to reduce the operating costs. Moreover, continued economic growth in several developed and developing countries, combined with attractive financing conditions fueled by low-interest rates, is expected to boost average global construction industry revenues, propelling the commercial vehicle tires market.
Threat:
Increasing preference for 6x2 axles
The increasing preference for fuel efficiency, as well as the growing strictness of vehicle emission systems, drives the predilection for commercial fuel-efficient trucks that do not compromise on load pulling capacity. As a result, vehicle manufacturers have resorted to produce more truck models with 6x2 axle driveline configurations. Though, a 6x2 axle driveline reduces the number of axles used in a truck and, as a result, the number of commercial vehicle tires required. For this reason, the market will face challenges due to the increasing preference for 6x2 axle drivelines in heavy commercial vehicles during the forecast period.
The agriculture segment is expected to be the largest during the forecast period
The agriculture segment is estimated to have a lucrative growth owing to increasing investments in agriculture and increasing demand for the supply of genetically modified seeds, advanced fertilizers, and other Agri-commodities to farmers in remote regions and providing transportation trucks to bring crops & products from farmers to the local & regional markets is further substantiating the growth of the commercial vehicle tire market in the forecast years. To boost the productivity on the lands of agriculturally deprived economies and to meet the food need of growing population, OEMs are trying to build machineries installed with IoT, GPS and Automation techniques to gain more from the land.
The light commercial vehicle (LCVs) segment is expected to have the highest CAGR during the forecast period
The light commercial vehicle (LCVs) segment is anticipated to witness the fastest CAGR growth during the forecast period, due to the increased usage of these vehicles in developing countries has played a major role in boosting sales of LCV tires. Light trucks and vans are used extensively by small businesses to transport goods, people, etc., across various regions. They require good driving comfort as well as superior traction on different terrains such as mud, sand, or snowy roads.
Region with highest share:
North America is projected to hold the largest market share during the forecast period owing to growing awareness about the importance & benefits of timely inspection & maintenance of vehicles & tires and the large number of commercial vehicles are used to transport goods across various locations in North America, hence enhancing demand for better-designed tires that provide superior traction and stability over uneven terrains. The US leads the commercial vehicle tires market with the largest share. It owes principally to the extensive presence of prominent automakers & tire manufacturers in the country, indulged actively in the production & distribution of new vehicles & tires and stimulating the market growth.
Region with highest CAGR:
Asia Pacific is projected to have the highest CAGR over the forecast period owing to the increased population and rising disposable income coupled with an intense focus on development activities by most companies. The sales of heavy trucks in Asia Pacific region grew by 1.4% to 27872 units in 2019 compared to 27493 units in 2018. Growing electrification of commercial vehicles in countries such as China is also expected to drive the growth of commercial vehicle tire market in the country. China has a fleet of more than 425,000 electric buses.

Key players in the market
Some of the key players profiled in the Commercial Vehicle Tires Market include Continental AG, Trelleborg Corporation, Bridgestone Corporation, Hankook Tire and Technology Group, Sumitomo Corporation, The Michelin Group, Goodyear Tyre and Rubber Company, Balkrishna Industries Limited, Pirelli & C. S.p.A, Cooper Tire & Rubber, ATG Tires Private Limited, The Yokohama Rubber, McLaren Industries, MRF Limited, JK Tyre & Industries, and Apollo Tyres.
Key Developments:
In July 2021, Hankook has announced that it will be supplying tires for the first electric SUV from Volkswagen, the ID.4, which will be fitted with the Ventus S1 Evo 3 EV, designed especially for electric vehicles & the demands of their drive systems.
In Jan, 2021, Michelin North America, Inc., announced that Purcell Tire & Rubber Company would join the MICHELIN Commercial Service Network (MCSN), Michelin Retread Technologies, Inc. (MRTI), and Oliver Rubber Company, LLC (Oliver) retreading networks. The partnership would enable Michelin to secure a relationship across our entire line of business-to-business on- and off-road products and services.
In Oct, 2020, Continental AG announced winning tire technology award for its CARE tire concept for electric robotaxis. The "Journey to Automation" award was presented by the European Rubber Journal (ERJ). Conti CARE tire concept is cloud-based connectivity that offers fleet operators particularly efficient solutions for electric mobility management.
Classifications Covered:
• Rim Diameter (<20 Inch)
• Rim Diameter (20 to 45 Inch)
• Rim Diameter (45 to 65 Inch)
Products Covered:
• Bias Tyre
• Radial Tyre
Tire Positions Covered:
• Drive
• Steer
• Trailer
Vehicle Weights Covered:
• Less Than 3.5 Tons
• 3.5 Tons To 16 Tons
• More Than 16 Tons
Materials Covered:
• Natural Rubber
• Nylon Cord Fabric and Wire
• Styrene Butadiene Rubber
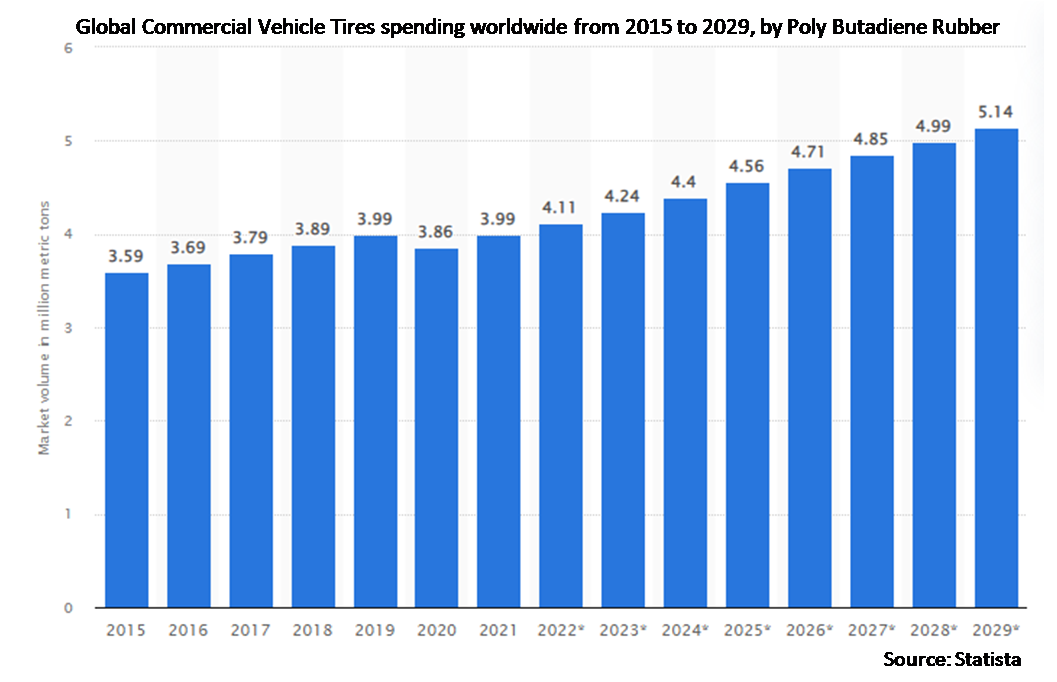
• Poly Butadiene Rubber
Terrains Covered:
• Off-Road
• On-Road
Vehicle Types Covered:
• Light Commercial Vehicle (LCVs)
• Medium and Heavy Commercial Vehicle (M&HCVs)
Sales Channels Covered:
• Online
• Offline
Applications Covered:
• Construction
• Transport
• Agriculture
• Mining
End Users Covered:
• Aftermarket
• Original Equipment Manufacturer (OEM)
Regions Covered:
• North America
o US
o Canada
o Mexico
• Europe
o Germany
o UK
o Italy
o France
o Spain
o Rest of Europe
• Asia Pacific
o Japan
o China
o India
o Australia
o New Zealand
o South Korea
o Rest of Asia Pacific
• South America
o Argentina
o Brazil
o Chile
o Rest of South America
• Middle East & Africa
o Saudi Arabia
o UAE
o Qatar
o South Africa
o Rest of Middle East & Africa
What our report offers:
- Market share assessments for the regional and country-level segments
- Strategic recommendations for the new entrants
- Covers Market data for the years 2020, 2021, 2022, 2025, and 2028
- Market Trends (Drivers, Constraints, Opportunities, Threats, Challenges, Investment Opportunities, and recommendations)
- Strategic recommendations in key business segments based on the market estimations
- Competitive landscaping mapping the key common trends
- Company profiling with detailed strategies, financials, and recent developments
- Supply chain trends mapping the latest technological advancements
Free Customization Offerings:
All the customers of this report will be entitled to receive one of the following free customization options:
• Company Profiling
o Comprehensive profiling of additional market players (up to 3)
o SWOT Analysis of key players (up to 3)
• Regional Segmentation
o Market estimations, Forecasts and CAGR of any prominent country as per the client's interest (Note: Depends on feasibility check)
• Competitive Benchmarking
o Benchmarking of key players based on product portfolio, geographical presence, and strategic alliances
Table of Contents
1 Executive Summary
2 Preface
2.1 Abstract
2.2 Stake Holders
2.3 Research Scope
2.4 Research Methodology
2.4.1 Data Mining
2.4.2 Data Analysis
2.4.3 Data Validation
2.4.4 Research Approach
2.5 Research Sources
2.5.1 Primary Research Sources
2.5.2 Secondary Research Sources
2.5.3 Assumptions
3 Market Trend Analysis
3.1 Introduction
3.2 Drivers
3.3 Restraints
3.4 Opportunities
3.5 Threats
3.6 Product Analysis
3.7 Application Analysis
3.8 End User Analysis
3.9 Emerging Markets
3.10 Impact of Covid-19
4 Porters Five Force Analysis
4.1 Bargaining power of suppliers
4.2 Bargaining power of buyers
4.3 Threat of substitutes
4.4 Threat of new entrants
4.5 Competitive rivalry
5 Global Commercial Vehicle Tires Market, By Classification
5.1 Introduction
5.2 Rim Diameter (<20 Inch)
5.3 Rim Diameter (20 to 45 Inch)
5.4 Rim Diameter (45 to 65 Inch)
6 Global Commercial Vehicle Tires Market, By Product
6.1 Introduction
6.2 Bias Tyre
6.3 Radial Tyre
7 Global Commercial Vehicle Tires Market, By Tire Position
7.1 Introduction
7.2 Drive
7.3 Steer
7.4 Trailer
8 Global Commercial Vehicle Tires Market, By Vehicle Weight
8.1 Introduction
8.2 Less Than 3.5 Tons
8.3 3.5 Tons To 16 Tons
8.4 More Than 16 Tons
9 Global Commercial Vehicle Tires Market, By Material
9.1 Introduction
9.2 Natural Rubber
9.3 Nylon Cord Fabric and Wire
9.4 Styrene Butadiene Rubber
9.5 Poly Butadiene Rubber
10 Global Commercial Vehicle Tires Market, By Terrain
10.1 Introduction
10.2 Off-Road
10.3 On-Road
11 Global Commercial Vehicle Tires Market, By Vehicle Type
11.1 Introduction
11.2 Light Commercial Vehicle (LCVs)
11.3 Medium and Heavy Commercial Vehicle (M&HCVs)
12 Global Commercial Vehicle Tires Market, By Sales Channel
12.1 Introduction
12.2 Online
12.3 Offline
13 Global Commercial Vehicle Tires Market, By Application
13.1 Introduction
13.2 Construction
13.3 Transport
13.4 Agriculture
13.5 Mining
14 Global Commercial Vehicle Tires Market, By End User
14.1 Introduction
14.2 Aftermarket
14.3 Original Equipment Manufacturer (OEM)
15 Global Commercial Vehicle Tires Market, By Geography
15.1 Introduction
15.2 North America
15.2.1 US
15.2.2 Canada
15.2.3 Mexico
15.3 Europe
15.3.1 Germany
15.3.2 UK
15.3.3 Italy
15.3.4 France
15.3.5 Spain
15.3.6 Rest of Europe
15.4 Asia Pacific
15.4.1 Japan
15.4.2 China
15.4.3 India
15.4.4 Australia
15.4.5 New Zealand
15.4.6 South Korea
15.4.7 Rest of Asia Pacific
15.5 South America
15.5.1 Argentina
15.5.2 Brazil
15.5.3 Chile
15.5.4 Rest of South America
15.6 Middle East & Africa
15.6.1 Saudi Arabia
15.6.2 UAE
15.6.3 Qatar
15.6.4 South Africa
15.6.5 Rest of Middle East & Africa
16 Key Developments
16.1 Agreements, Partnerships, Collaborations and Joint Ventures
16.2 Acquisitions & Mergers
16.3 New Product Launch
16.4 Expansions
16.5 Other Key Strategies
17 Company Profiling
17.1 Continental AG
17.2 Trelleborg Corporation
17.3 Bridgestone Corporation
17.4 Hankook Tire and Technology Group
17.5 Sumitomo Corporation
17.6 The Michelin Group
17.7 Goodyear Tyre and Rubber Company
17.8 Balkrishna Industries Limited
17.9 Pirelli & C. S.p.A
17.10 Cooper Tire & Rubber
17.11 ATG Tires Private Limited
17.12 The Yokohama Rubber
17.13 McLaren Industries
17.14 MRF Limited
17.15 JK Tyre & Industries
17.16 Apollo Tyres
List of Tables
1 Global Commercial Vehicle Tires Market Outlook, By Region (2020-2028) ($MN)
2 Global Commercial Vehicle Tires Market Outlook, By Classification (2020-2028) ($MN)
3 Global Commercial Vehicle Tires Market Outlook, By Rim Diameter (<20 Inch) (2020-2028) ($MN)
4 Global Commercial Vehicle Tires Market Outlook, By Rim Diameter (20 to 45 Inch) (2020-2028) ($MN)
5 Global Commercial Vehicle Tires Market Outlook, By Rim Diameter (45 to 65 Inch) (2020-2028) ($MN)
6 Global Commercial Vehicle Tires Market Outlook, By Product (2020-2028) ($MN)
7 Global Commercial Vehicle Tires Market Outlook, By Bias Tyre (2020-2028) ($MN)
8 Global Commercial Vehicle Tires Market Outlook, By Radial Tyre (2020-2028) ($MN)
9 Global Commercial Vehicle Tires Market Outlook, By Tire Position (2020-2028) ($MN)
10 Global Commercial Vehicle Tires Market Outlook, By Drive (2020-2028) ($MN)
11 Global Commercial Vehicle Tires Market Outlook, By Steer (2020-2028) ($MN)
12 Global Commercial Vehicle Tires Market Outlook, By Trailer (2020-2028) ($MN)
13 Global Commercial Vehicle Tires Market Outlook, By Vehicle Weight (2020-2028) ($MN)
14 Global Commercial Vehicle Tires Market Outlook, By Less Than 3.5 Tons (2020-2028) ($MN)
15 Global Commercial Vehicle Tires Market Outlook, By 3.5 Tons To 16 Tons (2020-2028) ($MN)
16 Global Commercial Vehicle Tires Market Outlook, By More Than 16 Tons (2020-2028) ($MN)
17 Global Commercial Vehicle Tires Market Outlook, By Material (2020-2028) ($MN)
18 Global Commercial Vehicle Tires Market Outlook, By Natural Rubber (2020-2028) ($MN)
19 Global Commercial Vehicle Tires Market Outlook, By Nylon Cord Fabric and Wire (2020-2028) ($MN)
20 Global Commercial Vehicle Tires Market Outlook, By Styrene Butadiene Rubber (2020-2028) ($MN)
21 Global Commercial Vehicle Tires Market Outlook, By Poly Butadiene Rubber (2020-2028) ($MN)
22 Global Commercial Vehicle Tires Market Outlook, By Terrain (2020-2028) ($MN)
23 Global Commercial Vehicle Tires Market Outlook, By Off-Road (2020-2028) ($MN)
24 Global Commercial Vehicle Tires Market Outlook, By On-Road (2020-2028) ($MN)
25 Global Commercial Vehicle Tires Market Outlook, By Vehicle Type (2020-2028) ($MN)
26 Global Commercial Vehicle Tires Market Outlook, By Light Commercial Vehicle (LCVs) (2020-2028) ($MN)
27 Global Commercial Vehicle Tires Market Outlook, By Medium and Heavy Commercial Vehicle (M&HCVs) (2020-2028) ($MN)
28 Global Commercial Vehicle Tires Market Outlook, By Sales Channel (2020-2028) ($MN)
29 Global Commercial Vehicle Tires Market Outlook, By Online (2020-2028) ($MN)
30 Global Commercial Vehicle Tires Market Outlook, By Offline (2020-2028) ($MN)
31 Global Commercial Vehicle Tires Market Outlook, By Application (2020-2028) ($MN)
32 Global Commercial Vehicle Tires Market Outlook, By Construction (2020-2028) ($MN)
33 Global Commercial Vehicle Tires Market Outlook, By Transport (2020-2028) ($MN)
34 Global Commercial Vehicle Tires Market Outlook, By Agriculture (2020-2028) ($MN)
35 Global Commercial Vehicle Tires Market Outlook, By Mining (2020-2028) ($MN)
36 Global Commercial Vehicle Tires Market Outlook, By End User (2020-2028) ($MN)
37 Global Commercial Vehicle Tires Market Outlook, By Aftermarket (2020-2028) ($MN)
38 Global Commercial Vehicle Tires Market Outlook, By Original Equipment Manufacturer (OEM) (2020-2028) ($MN)
Note: Tables for North America, Europe, APAC, South America, and Middle East & Africa Regions are also represented in the same manner as above.
List of Figures
RESEARCH METHODOLOGY

We at ‘Stratistics’ opt for an extensive research approach which involves data mining, data validation, and data analysis. The various research sources include in-house repository, secondary research, competitor’s sources, social media research, client internal data, and primary research.
Our team of analysts prefers the most reliable and authenticated data sources in order to perform the comprehensive literature search. With access to most of the authenticated data bases our team highly considers the best mix of information through various sources to obtain extensive and accurate analysis.
Each report takes an average time of a month and a team of 4 industry analysts. The time may vary depending on the scope and data availability of the desired market report. The various parameters used in the market assessment are standardized in order to enhance the data accuracy.
Data Mining
The data is collected from several authenticated, reliable, paid and unpaid sources and is filtered depending on the scope & objective of the research. Our reports repository acts as an added advantage in this procedure. Data gathering from the raw material suppliers, distributors and the manufacturers is performed on a regular basis, this helps in the comprehensive understanding of the products value chain. Apart from the above mentioned sources the data is also collected from the industry consultants to ensure the objective of the study is in the right direction.
Market trends such as technological advancements, regulatory affairs, market dynamics (Drivers, Restraints, Opportunities and Challenges) are obtained from scientific journals, market related national & international associations and organizations.
Data Analysis
From the data that is collected depending on the scope & objective of the research the data is subjected for the analysis. The critical steps that we follow for the data analysis include:
- Product Lifecycle Analysis
- Competitor analysis
- Risk analysis
- Porters Analysis
- PESTEL Analysis
- SWOT Analysis
The data engineering is performed by the core industry experts considering both the Marketing Mix Modeling and the Demand Forecasting. The marketing mix modeling makes use of multiple-regression techniques to predict the optimal mix of marketing variables. Regression factor is based on a number of variables and how they relate to an outcome such as sales or profits.
Data Validation
The data validation is performed by the exhaustive primary research from the expert interviews. This includes telephonic interviews, focus groups, face to face interviews, and questionnaires to validate our research from all aspects. The industry experts we approach come from the leading firms, involved in the supply chain ranging from the suppliers, distributors to the manufacturers and consumers so as to ensure an unbiased analysis.
We are in touch with more than 15,000 industry experts with the right mix of consultants, CEO's, presidents, vice presidents, managers, experts from both supply side and demand side, executives and so on.
The data validation involves the primary research from the industry experts belonging to:
- Leading Companies
- Suppliers & Distributors
- Manufacturers
- Consumers
- Industry/Strategic Consultants
Apart from the data validation the primary research also helps in performing the fill gap research, i.e. providing solutions for the unmet needs of the research which helps in enhancing the reports quality.
For more details about research methodology, kindly write to us at info@strategymrc.com
Frequently Asked Questions
In case of any queries regarding this report, you can contact the customer service by filing the “Inquiry Before Buy” form available on the right hand side. You may also contact us through email: info@strategymrc.com or phone: +1-301-202-5929
Yes, the samples are available for all the published reports. You can request them by filling the “Request Sample” option available in this page.
Yes, you can request a sample with your specific requirements. All the customized samples will be provided as per the requirement with the real data masked.
All our reports are available in Digital PDF format. In case if you require them in any other formats, such as PPT, Excel etc you can submit a request through “Inquiry Before Buy” form available on the right hand side. You may also contact us through email: info@strategymrc.com or phone: +1-301-202-5929
We offer a free 15% customization with every purchase. This requirement can be fulfilled for both pre and post sale. You may send your customization requirements through email at info@strategymrc.com or call us on +1-301-202-5929.
We have 3 different licensing options available in electronic format.
- Single User Licence: Allows one person, typically the buyer, to have access to the ordered product. The ordered product cannot be distributed to anyone else.
- 2-5 User Licence: Allows the ordered product to be shared among a maximum of 5 people within your organisation.
- Corporate License: Allows the product to be shared among all employees of your organisation regardless of their geographical location.
All our reports are typically be emailed to you as an attachment.
To order any available report you need to register on our website. The payment can be made either through CCAvenue or PayPal payments gateways which accept all international cards.
We extend our support to 6 months post sale. A post sale customization is also provided to cover your unmet needs in the report.
Request Customization
We offer complimentary customization of up to 15% with every purchase. To share your customization requirements, feel free to email us at info@strategymrc.com or call us on +1-301-202-5929. .
Please Note: Customization within the 15% threshold is entirely free of charge. If your request exceeds this limit, we will conduct a feasibility assessment. Following that, a detailed quote and timeline will be provided.
WHY CHOOSE US ?

Assured Quality
Best in class reports with high standard of research integrity

24X7 Research Support
Continuous support to ensure the best customer experience.

Free Customization
Adding more values to your product of interest.

Safe & Secure Access
Providing a secured environment for all online transactions.

Trusted by 600+ Brands
Serving the most reputed brands across the world.