
Compostable Paper Tray Market
Compostable Paper Tray Market Forecasts to 2028 - Global Analysis By Source Type (Recycled Fiber Paper Trays, Virgin Fiber Paper Trays and Other Source Types), Material Type (Molded Pulp, Corrugated Boards and Boxboards/Cartons), End User and By Geography

|
Years Covered |
2020-2028 |
|
Estimated Year Value (2022) |
US $491.17 BN |
|
Projected Year Value (2028) |
US $801.34 BN |
|
CAGR (2022 - 2028) |
8.5% |
|
Regions Covered |
North America, Europe, Asia Pacific, South America, and Middle East & Africa |
|
Countries Covered |
US, Canada, Mexico, Germany, UK, Italy, France, Spain, Japan, China, India, Australia, New Zealand, South Korea, Rest of Asia Pacific, South America, Argentina, Brazil, Chile, Middle East & Africa, Saudi Arabia, UAE, Qatar, and South Africa |
|
Largest Market |
North America |
|
Fastest Growing Market |
Asia Pacific |
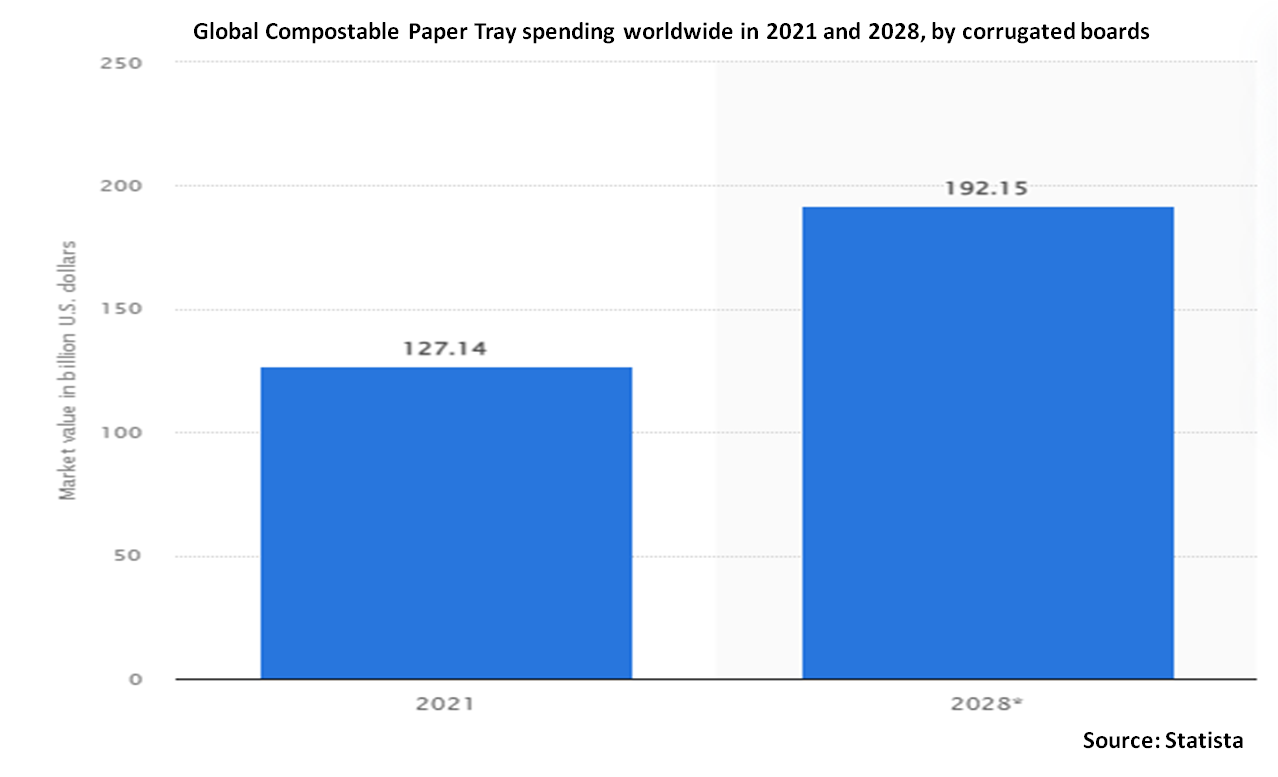
According to Stratistics MRC, the Global Compostable Paper Tray Market is accounted for $491.17 billion in 2022 and is expected to reach $801.34 billion by 2028 growing at a CAGR of 8.5% during the forecast period. Compostable Paper trays are produced utilizing corrugated boards, molded pulp, boxboards, and other materials, and have many uses in various end-user industries such as food and beverage, personal care, retail, and healthcare sectors, among others.
According to the Association for Packaging and Processing Technologies, the US food industry is expected to increase at a steady rate of 2.9% CAGR through 2022.
Market Dynamics:
Driver:
Rising environmental concern among consumers
The growing consumer awareness of environmental pollution and the damaging effects of conventional plastic on the environment are providing manufacturers in the global compostable paper tray market with many prospects. Moreover, it requires less energy to produce compostable packaging materials. Additionally, because they are created organically without the use of chemicals, they are non-toxic. In addition, depending on the materials used to create the bio plastic, compostable plastic degrades more quickly and is absorbed by the soil or turned into compost.
Restraint:
Concerns about use of degradable additives in packaging
There are various environmental problems about packaging solutions, such as the usage of compostable and biodegradable materials, as well as recycling challenges. For instance, in 2017, the Institute of Scrap Recycling Industries (ISRI) issued many clarifications and new policy statements regarding the use of biodegradable chemicals in packaging. The research underlined that the degradable compounds have not undergone extensive testing and that it is not quite clear how much damage they may pose to the environment and to human health.
Opportunity:
Zero waste edible trays creating buzz and turning up sales
Customers are looking for sustainable and environmentally friendly packaging solutions despite the many benefits that plastic trays provide. Because they create no waste and can be enjoyed right away, edible trays are growing in popularity lately. The introduction of edible trays made of sugarcane, palm leaves, corn starch, bagasse, and other materials has raised demand for compostable paper trays. It is projected that these edible trays will prove to be successful packaging alternative to traditional trays given that they satisfy all of the consumer's packaging criteria.
Threat:
Cost-effectiveness and lack of sufficient technology
Cost-effectiveness and a lack of adequate technology are the main issues that are anticipated to slow the market's growth. Change in consumer mindset, which has been linked to more expensive costs than traditional items, is anticipated to be a significant problem for the end user industry. It is projected that other issues, such as shorter life and the inability to recycle some components that are not entirely biodegradable, may somewhat restrain the market growth.
Covid-19 Impact
The COVID-19 pandemic had an effect on economics and enterprises in various countries as a result of lockdowns, travel restrictions, and business closures. The capacity for production, the timing of deliveries, and the sales of various items had all been significantly impacted by the disruption to the global supply chain. Numerous manufacturing sites in regions like North America, Europe, Asia Pacific, South America, and the Middle East & Africa were shut down as a result of this. The pandemic had a direct impact on supply and demand, which in turn disrupted supply chains and marketplaces and had an impact on the health of the global economy and enterprises.
The molded pulp segment is expected to be the largest during the forecast period
The molded pulp segment is estimated to have lucrative growth due to rising product demand in end-user sectors and customer demand for transparent, biodegradable packaging options. These packaging materials are also lightweight, shockproof, strong, and convenient to carry, making them a popular choice for packaging in the food and beverage sector. The microporous structure of the molded pulp packaging material enables for aeration and water absorption capabilities. This ensures that perishable food products remain fresh for a long time.
The food and beverage industry segment is expected to have the highest CAGR during the forecast period
The food and beverage industry segment is anticipated to witness the fastest CAGR growth during the forecast period, due to its ability to protect the food from contamination and odor, further ensuring food safety. Some of the main products that use worldwide compostable paper trays for packaging are eggs, fresh fruits and vegetables, salad, and other culinary items. These trays cushion the delicate surfaces of the items, guaranteeing their safety throughout shipping. With enough air inside the container, compostable paper trays ensure that the food products are kept fresh. They are among the most often used types of packaging in the food and beverage sector since they also adhere to food safety regulations.
Region with highest share:
North America is projected to hold the largest market share during the forecast period, owing to the increasing usage of compostable paper tray packaging in the healthcare segment and food and beverage industry. Tier 1 firms have a tight hold on the industry due to their dominance of the compostable paper tray market in North America. Additionally, they are expanding their production facilities, forming strategic alliances, and launching new goods to take advantage of the enormous development potential in emerging markets.
Region with highest CAGR:
Asia Pacific is projected to have the highest CAGR over the forecast period, owing to the expansion of both the food packaging and retail sectors. Manufacturers are focusing on expanding their presence in the Asia-Pacific regions' expanding economies, particularly China and India, in order to enhance their market share. Supermarkets and hypermarkets are common in the area, thus the sales of compostable paper trays have a significant opportunity to increase in these markets.

Key players in the market
Some of the key players profiled in the Compostable Paper Tray Market include Athena Superpack Private Limited, BillerudKorsnas, Brodrene Hartmann, CS Packaging, Inc., Huhtamaki, Henry Molded Products, International Paper, Mondi Group, Novolex, Pactiv, Stora Enso, UFP Technologies
Key Developments:
In March 2021, International Paper bought two state-of-the-art corrugated box plants located in Spain. It has grown its production capabilities in areas of Madrid and Catalonia to offer high-quality packaging solutions for applications in industrial and e-commerce segments.
Source Types Covered:
• Recycled Fiber Paper Trays
• Virgin Fiber Paper Trays
• Other Source Types
Material Types Covered:
• Molded Pulp
• Corrugated Boards
• Boxboards/Cartons
End Users Covered:
• Consumer Durables and Electronics Industry
• Food & Beverage Industry
• Healthcare Industry
• Personal Care & Cosmetics Industry
• Retail Industry
• Other End Users
Regions Covered:
• North America
o US
o Canada
o Mexico
• Europe
o Germany
o UK
o Italy
o France
o Spain
o Rest of Europe
• Asia Pacific
o Japan
o China
o India
o Australia
o New Zealand
o South Korea
o Rest of Asia Pacific
• South America
o Argentina
o Brazil
o Chile
o Rest of South America
• Middle East & Africa
o Saudi Arabia
o UAE
o Qatar
o South Africa
o Rest of Middle East & Africa
What our report offers:
- Market share assessments for the regional and country-level segments
- Strategic recommendations for the new entrants
- Covers Market data for the years 2020, 2021, 2022, 2025, and 2028
- Market Trends (Drivers, Constraints, Opportunities, Threats, Challenges, Investment Opportunities, and recommendations)
- Strategic recommendations in key business segments based on the market estimations
- Competitive landscaping mapping the key common trends
- Company profiling with detailed strategies, financials, and recent developments
- Supply chain trends mapping the latest technological advancements
Free Customization Offerings:
All the customers of this report will be entitled to receive one of the following free customization options:
• Company Profiling
o Comprehensive profiling of additional market players (up to 3)
o SWOT Analysis of key players (up to 3)
• Regional Segmentation
o Market estimations, Forecasts and CAGR of any prominent country as per the client's interest (Note: Depends on feasibility check)
• Competitive Benchmarking
o Benchmarking of key players based on product portfolio, geographical presence, and strategic alliances
Table of Contents
1 Executive Summary
2 Preface
2.1 Abstract
2.2 Stake Holders
2.3 Research Scope
2.4 Research Methodology
2.4.1 Data Mining
2.4.2 Data Analysis
2.4.3 Data Validation
2.4.4 Research Approach
2.5 Research Sources
2.5.1 Primary Research Sources
2.5.2 Secondary Research Sources
2.5.3 Assumptions
3 Market Trend Analysis
3.1 Introduction
3.2 Drivers
3.3 Restraints
3.4 Opportunities
3.5 Threats
3.6 End User Analysis
3.7 Emerging Markets
3.8 Impact of Covid-19
4 Porters Five Force Analysis
4.1 Bargaining power of suppliers
4.2 Bargaining power of buyers
4.3 Threat of substitutes
4.4 Threat of new entrants
4.5 Competitive rivalry
5 Global Compostable Paper Tray Market, By Source Type
5.1 Introduction
5.2 Recycled Fiber Paper Trays
5.3 Virgin Fiber Paper Trays
5.4 Other Source Types
6 Global Compostable Paper Tray Market, By Material Type
6.1 Introduction
6.2 Molded Pulp
6.3 Corrugated Boards
6.4 Boxboards/Cartons
7 Global Compostable Paper Tray Market, By End User
7.1 Introduction
7.2 Consumer Durables and Electronics Industry
7.3 Food & Beverage Industry
7.4 Healthcare Industry
7.5 Personal Care & Cosmetics Industry
7.6 Retail Industry
7.7 Other End Users
8 Global Compostable Paper Tray Market, By Geography
8.1 Introduction
8.2 North America
8.2.1 US
8.2.2 Canada
8.2.3 Mexico
8.3 Europe
8.3.1 Germany
8.3.2 UK
8.3.3 Italy
8.3.4 France
8.3.5 Spain
8.3.6 Rest of Europe
8.4 Asia Pacific
8.4.1 Japan
8.4.2 China
8.4.3 India
8.4.4 Australia
8.4.5 New Zealand
8.4.6 South Korea
8.4.7 Rest of Asia Pacific
8.5 South America
8.5.1 Argentina
8.5.2 Brazil
8.5.3 Chile
8.5.4 Rest of South America
8.6 Middle East & Africa
8.6.1 Saudi Arabia
8.6.2 UAE
8.6.3 Qatar
8.6.4 South Africa
8.6.5 Rest of Middle East & Africa
9 Key Developments
9.1 Agreements, Partnerships, Collaborations and Joint Ventures
9.2 Acquisitions & Mergers
9.3 New Product Launch
9.4 Expansions
9.5 Other Key Strategies
10 Company Profiling
10.1 Athena Superpack Private Limited
10.2 BillerudKorsnas
10.3 Brodrene Hartmann
10.4 CS Packaging, Inc.
10.5 Huhtamaki
10.6 Henry Molded Products
10.7 International Paper
10.8 Mondi Group
10.9 Novolex
10.10 Pactiv
10.11 Stora Enso
10.12 UFP Technologies
List of Tables
1 Global Compostable Paper Tray Market Outlook, By Region (2020-2028) ($MN)
2 Global Compostable Paper Tray Market Outlook, By Source Type (2020-2028) ($MN)
3 Global Compostable Paper Tray Market Outlook, By Recycled Fiber Paper Trays (2020-2028) ($MN)
4 Global Compostable Paper Tray Market Outlook, By Virgin Fiber Paper Trays (2020-2028) ($MN)
5 Global Compostable Paper Tray Market Outlook, By Other Source Types (2020-2028) ($MN)
6 Global Compostable Paper Tray Market Outlook, By Material Type (2020-2028) ($MN)
7 Global Compostable Paper Tray Market Outlook, By Molded Pulp (2020-2028) ($MN)
8 Global Compostable Paper Tray Market Outlook, By Corrugated Boards (2020-2028) ($MN)
9 Global Compostable Paper Tray Market Outlook, By Boxboards/Cartons (2020-2028) ($MN)
10 Global Compostable Paper Tray Market Outlook, By End User (2020-2028) ($MN)
11 Global Compostable Paper Tray Market Outlook, By Consumer Durables and Electronics Industry (2020-2028) ($MN)
12 Global Compostable Paper Tray Market Outlook, By Food & Beverage Industry (2020-2028) ($MN)
13 Global Compostable Paper Tray Market Outlook, By Healthcare Industry (2020-2028) ($MN)
14 Global Compostable Paper Tray Market Outlook, By Personal Care & Cosmetics Industry (2020-2028) ($MN)
15 Global Compostable Paper Tray Market Outlook, By Retail Industry (2020-2028) ($MN)
16 Global Compostable Paper Tray Market Outlook, By Other End Users (2020-2028) ($MN)
17 North America Compostable Paper Tray Market Outlook, By Country (2020-2028) ($MN)
18 North America Compostable Paper Tray Market Outlook, By Source Type (2020-2028) ($MN)
19 North America Compostable Paper Tray Market Outlook, By Recycled Fiber Paper Trays (2020-2028) ($MN)
20 North America Compostable Paper Tray Market Outlook, By Virgin Fiber Paper Trays (2020-2028) ($MN)
21 North America Compostable Paper Tray Market Outlook, By Other Source Types (2020-2028) ($MN)
22 North America Compostable Paper Tray Market Outlook, By Material Type (2020-2028) ($MN)
23 North America Compostable Paper Tray Market Outlook, By Molded Pulp (2020-2028) ($MN)
24 North America Compostable Paper Tray Market Outlook, By Corrugated Boards (2020-2028) ($MN)
25 North America Compostable Paper Tray Market Outlook, By Boxboards/Cartons (2020-2028) ($MN)
26 North America Compostable Paper Tray Market Outlook, By End User (2020-2028) ($MN)
27 North America Compostable Paper Tray Market Outlook, By Consumer Durables and Electronics Industry (2020-2028) ($MN)
28 North America Compostable Paper Tray Market Outlook, By Food & Beverage Industry (2020-2028) ($MN)
29 North America Compostable Paper Tray Market Outlook, By Healthcare Industry (2020-2028) ($MN)
30 North America Compostable Paper Tray Market Outlook, By Personal Care & Cosmetics Industry (2020-2028) ($MN)
31 North America Compostable Paper Tray Market Outlook, By Retail Industry (2020-2028) ($MN)
32 North America Compostable Paper Tray Market Outlook, By Other End Users (2020-2028) ($MN)
33 Europe Compostable Paper Tray Market Outlook, By Country (2020-2028) ($MN)
34 Europe Compostable Paper Tray Market Outlook, By Source Type (2020-2028) ($MN)
35 Europe Compostable Paper Tray Market Outlook, By Recycled Fiber Paper Trays (2020-2028) ($MN)
36 Europe Compostable Paper Tray Market Outlook, By Virgin Fiber Paper Trays (2020-2028) ($MN)
37 Europe Compostable Paper Tray Market Outlook, By Other Source Types (2020-2028) ($MN)
38 Europe Compostable Paper Tray Market Outlook, By Material Type (2020-2028) ($MN)
39 Europe Compostable Paper Tray Market Outlook, By Molded Pulp (2020-2028) ($MN)
40 Europe Compostable Paper Tray Market Outlook, By Corrugated Boards (2020-2028) ($MN)
41 Europe Compostable Paper Tray Market Outlook, By Boxboards/Cartons (2020-2028) ($MN)
42 Europe Compostable Paper Tray Market Outlook, By End User (2020-2028) ($MN)
43 Europe Compostable Paper Tray Market Outlook, By Consumer Durables and Electronics Industry (2020-2028) ($MN)
44 Europe Compostable Paper Tray Market Outlook, By Food & Beverage Industry (2020-2028) ($MN)
45 Europe Compostable Paper Tray Market Outlook, By Healthcare Industry (2020-2028) ($MN)
46 Europe Compostable Paper Tray Market Outlook, By Personal Care & Cosmetics Industry (2020-2028) ($MN)
47 Europe Compostable Paper Tray Market Outlook, By Retail Industry (2020-2028) ($MN)
48 Europe Compostable Paper Tray Market Outlook, By Other End Users (2020-2028) ($MN)
49 Asia Pacific Compostable Paper Tray Market Outlook, By Country (2020-2028) ($MN)
50 Asia Pacific Compostable Paper Tray Market Outlook, By Source Type (2020-2028) ($MN)
51 Asia Pacific Compostable Paper Tray Market Outlook, By Recycled Fiber Paper Trays (2020-2028) ($MN)
52 Asia Pacific Compostable Paper Tray Market Outlook, By Virgin Fiber Paper Trays (2020-2028) ($MN)
53 Asia Pacific Compostable Paper Tray Market Outlook, By Other Source Types (2020-2028) ($MN)
54 Asia Pacific Compostable Paper Tray Market Outlook, By Material Type (2020-2028) ($MN)
55 Asia Pacific Compostable Paper Tray Market Outlook, By Molded Pulp (2020-2028) ($MN)
56 Asia Pacific Compostable Paper Tray Market Outlook, By Corrugated Boards (2020-2028) ($MN)
57 Asia Pacific Compostable Paper Tray Market Outlook, By Boxboards/Cartons (2020-2028) ($MN)
58 Asia Pacific Compostable Paper Tray Market Outlook, By End User (2020-2028) ($MN)
59 Asia Pacific Compostable Paper Tray Market Outlook, By Consumer Durables and Electronics Industry (2020-2028) ($MN)
60 Asia Pacific Compostable Paper Tray Market Outlook, By Food & Beverage Industry (2020-2028) ($MN)
61 Asia Pacific Compostable Paper Tray Market Outlook, By Healthcare Industry (2020-2028) ($MN)
62 Asia Pacific Compostable Paper Tray Market Outlook, By Personal Care & Cosmetics Industry (2020-2028) ($MN)
63 Asia Pacific Compostable Paper Tray Market Outlook, By Retail Industry (2020-2028) ($MN)
64 Asia Pacific Compostable Paper Tray Market Outlook, By Other End Users (2020-2028) ($MN)
65 South America Compostable Paper Tray Market Outlook, By Country (2020-2028) ($MN)
66 South America Compostable Paper Tray Market Outlook, By Source Type (2020-2028) ($MN)
67 South America Compostable Paper Tray Market Outlook, By Recycled Fiber Paper Trays (2020-2028) ($MN)
68 South America Compostable Paper Tray Market Outlook, By Virgin Fiber Paper Trays (2020-2028) ($MN)
69 South America Compostable Paper Tray Market Outlook, By Other Source Types (2020-2028) ($MN)
70 South America Compostable Paper Tray Market Outlook, By Material Type (2020-2028) ($MN)
71 South America Compostable Paper Tray Market Outlook, By Molded Pulp (2020-2028) ($MN)
72 South America Compostable Paper Tray Market Outlook, By Corrugated Boards (2020-2028) ($MN)
73 South America Compostable Paper Tray Market Outlook, By Boxboards/Cartons (2020-2028) ($MN)
74 South America Compostable Paper Tray Market Outlook, By End User (2020-2028) ($MN)
75 South America Compostable Paper Tray Market Outlook, By Consumer Durables and Electronics Industry (2020-2028) ($MN)
76 South America Compostable Paper Tray Market Outlook, By Food & Beverage Industry (2020-2028) ($MN)
77 South America Compostable Paper Tray Market Outlook, By Healthcare Industry (2020-2028) ($MN)
78 South America Compostable Paper Tray Market Outlook, By Personal Care & Cosmetics Industry (2020-2028) ($MN)
79 South America Compostable Paper Tray Market Outlook, By Retail Industry (2020-2028) ($MN)
80 South America Compostable Paper Tray Market Outlook, By Other End Users (2020-2028) ($MN)
81 Middle East & Africa Compostable Paper Tray Market Outlook, By Country (2020-2028) ($MN)
82 Middle East & Africa Compostable Paper Tray Market Outlook, By Source Type (2020-2028) ($MN)
83 Middle East & Africa Compostable Paper Tray Market Outlook, By Recycled Fiber Paper Trays (2020-2028) ($MN)
84 Middle East & Africa Compostable Paper Tray Market Outlook, By Virgin Fiber Paper Trays (2020-2028) ($MN)
85 Middle East & Africa Compostable Paper Tray Market Outlook, By Other Source Types (2020-2028) ($MN)
86 Middle East & Africa Compostable Paper Tray Market Outlook, By Material Type (2020-2028) ($MN)
87 Middle East & Africa Compostable Paper Tray Market Outlook, By Molded Pulp (2020-2028) ($MN)
88 Middle East & Africa Compostable Paper Tray Market Outlook, By Corrugated Boards (2020-2028) ($MN)
89 Middle East & Africa Compostable Paper Tray Market Outlook, By Boxboards/Cartons (2020-2028) ($MN)
90 Middle East & Africa Compostable Paper Tray Market Outlook, By End User (2020-2028) ($MN)
91 Middle East & Africa Compostable Paper Tray Market Outlook, By Consumer Durables and Electronics Industry (2020-2028) ($MN)
92 Middle East & Africa Compostable Paper Tray Market Outlook, By Food & Beverage Industry (2020-2028) ($MN)
93 Middle East & Africa Compostable Paper Tray Market Outlook, By Healthcare Industry (2020-2028) ($MN)
94 Middle East & Africa Compostable Paper Tray Market Outlook, By Personal Care & Cosmetics Industry (2020-2028) ($MN)
95 Middle East & Africa Compostable Paper Tray Market Outlook, By Retail Industry (2020-2028) ($MN)
96 Middle East & Africa Compostable Paper Tray Market Outlook, By Other End Users (2020-2028) ($MN)
List of Figures
RESEARCH METHODOLOGY

We at ‘Stratistics’ opt for an extensive research approach which involves data mining, data validation, and data analysis. The various research sources include in-house repository, secondary research, competitor’s sources, social media research, client internal data, and primary research.
Our team of analysts prefers the most reliable and authenticated data sources in order to perform the comprehensive literature search. With access to most of the authenticated data bases our team highly considers the best mix of information through various sources to obtain extensive and accurate analysis.
Each report takes an average time of a month and a team of 4 industry analysts. The time may vary depending on the scope and data availability of the desired market report. The various parameters used in the market assessment are standardized in order to enhance the data accuracy.
Data Mining
The data is collected from several authenticated, reliable, paid and unpaid sources and is filtered depending on the scope & objective of the research. Our reports repository acts as an added advantage in this procedure. Data gathering from the raw material suppliers, distributors and the manufacturers is performed on a regular basis, this helps in the comprehensive understanding of the products value chain. Apart from the above mentioned sources the data is also collected from the industry consultants to ensure the objective of the study is in the right direction.
Market trends such as technological advancements, regulatory affairs, market dynamics (Drivers, Restraints, Opportunities and Challenges) are obtained from scientific journals, market related national & international associations and organizations.
Data Analysis
From the data that is collected depending on the scope & objective of the research the data is subjected for the analysis. The critical steps that we follow for the data analysis include:
- Product Lifecycle Analysis
- Competitor analysis
- Risk analysis
- Porters Analysis
- PESTEL Analysis
- SWOT Analysis
The data engineering is performed by the core industry experts considering both the Marketing Mix Modeling and the Demand Forecasting. The marketing mix modeling makes use of multiple-regression techniques to predict the optimal mix of marketing variables. Regression factor is based on a number of variables and how they relate to an outcome such as sales or profits.
Data Validation
The data validation is performed by the exhaustive primary research from the expert interviews. This includes telephonic interviews, focus groups, face to face interviews, and questionnaires to validate our research from all aspects. The industry experts we approach come from the leading firms, involved in the supply chain ranging from the suppliers, distributors to the manufacturers and consumers so as to ensure an unbiased analysis.
We are in touch with more than 15,000 industry experts with the right mix of consultants, CEO's, presidents, vice presidents, managers, experts from both supply side and demand side, executives and so on.
The data validation involves the primary research from the industry experts belonging to:
- Leading Companies
- Suppliers & Distributors
- Manufacturers
- Consumers
- Industry/Strategic Consultants
Apart from the data validation the primary research also helps in performing the fill gap research, i.e. providing solutions for the unmet needs of the research which helps in enhancing the reports quality.
For more details about research methodology, kindly write to us at info@strategymrc.com
Frequently Asked Questions
In case of any queries regarding this report, you can contact the customer service by filing the “Inquiry Before Buy” form available on the right hand side. You may also contact us through email: info@strategymrc.com or phone: +1-301-202-5929
Yes, the samples are available for all the published reports. You can request them by filling the “Request Sample” option available in this page.
Yes, you can request a sample with your specific requirements. All the customized samples will be provided as per the requirement with the real data masked.
All our reports are available in Digital PDF format. In case if you require them in any other formats, such as PPT, Excel etc you can submit a request through “Inquiry Before Buy” form available on the right hand side. You may also contact us through email: info@strategymrc.com or phone: +1-301-202-5929
We offer a free 15% customization with every purchase. This requirement can be fulfilled for both pre and post sale. You may send your customization requirements through email at info@strategymrc.com or call us on +1-301-202-5929.
We have 3 different licensing options available in electronic format.
- Single User Licence: Allows one person, typically the buyer, to have access to the ordered product. The ordered product cannot be distributed to anyone else.
- 2-5 User Licence: Allows the ordered product to be shared among a maximum of 5 people within your organisation.
- Corporate License: Allows the product to be shared among all employees of your organisation regardless of their geographical location.
All our reports are typically be emailed to you as an attachment.
To order any available report you need to register on our website. The payment can be made either through CCAvenue or PayPal payments gateways which accept all international cards.
We extend our support to 6 months post sale. A post sale customization is also provided to cover your unmet needs in the report.
Request Customization
We offer complimentary customization of up to 15% with every purchase. To share your customization requirements, feel free to email us at info@strategymrc.com or call us on +1-301-202-5929. .
Please Note: Customization within the 15% threshold is entirely free of charge. If your request exceeds this limit, we will conduct a feasibility assessment. Following that, a detailed quote and timeline will be provided.
WHY CHOOSE US ?

Assured Quality
Best in class reports with high standard of research integrity

24X7 Research Support
Continuous support to ensure the best customer experience.

Free Customization
Adding more values to your product of interest.

Safe & Secure Access
Providing a secured environment for all online transactions.

Trusted by 600+ Brands
Serving the most reputed brands across the world.