
District Heating Market
District Heating Market Forecasts to 2030 - Global Analysis By Heat Source (Renewables, Natural Gas, Coal, Oil & Petroleum Products and Other Heat Sources), Component (Insulated Pipeline, Boiler, Heat Exchanger, Pumps, Heat Meters and Other Components), Plant Type, Application and By Geography

|
Years Covered |
2021-2030 |
|
Estimated Year Value (2023) |
US $181.58 BN |
|
Projected Year Value (2030) |
US $315.25 BN |
|
CAGR (2023 - 2030) |
8.2% |
|
Regions Covered |
North America, Europe, Asia Pacific, South America, and Middle East & Africa |
|
Countries Covered |
US, Canada, Mexico, Germany, UK, Italy, France, Spain, Japan, China, India, Australia, New Zealand, South Korea, Rest of Asia Pacific, South America, Argentina, Brazil, Chile, Middle East & Africa, Saudi Arabia, UAE, Qatar, and South Africa |
|
Largest Market |
Asia Pacific |
|
Highest Growing Market |
Europe |
According to Stratistics MRC, the Global District Heating Market is accounted for $181.58 billion in 2023 and is expected to reach $315.25 billion by 2030 growing at a CAGR of 8.2% during the forecast period. In district heating, heat is produced centrally and then distributed to nearby households, companies, and industrial facilities. District heating is a cost-effective and ecologically responsible approach. It is frequently used in single-family homes, multi-family buildings, high-rise structures, and mega townships, district heating. Comparing it to individual building equipment provides a number of benefits, such as increased safety and reliability, reduced emissions, and higher fuel flexibility, especially when using alternative fuels like biomass or waste. District heating lessens carbon emissions and dependency on non-renewable resources by substituting renewable energy for heating that is dependent on fossil fuels. This strategy reduces waste and makes the best use of available energy.
According to IEA, nearly 90% of global heat production in 2020 was from fossil fuels, primarily coal (45%), natural gas (40%), and oil (5%), down from 95% in 2000.
Market Dynamics:
Driver:
Emerging trend of urbanization
Increasing urbanization results in the creation of well-organized infrastructure that are ideal for district heating systems. District heating and power generation are two examples of utility services that are in high demand in expanding metropolitan areas. District heating systems obtain heat from a variety of sources, such as boilers, industrial surplus heat, renewable energy, CHP, and boilers. The enormous heat produced by businesses and data centers as a result of expanding industrialization may be used for district heating, which in turn contributes to economic efficiency. This element helps to propel the growth of district heating market.
Restraint:
Reduced effectiveness in small heating loads
Large-scale initiatives by powerful developers are appropriate for district heating. The main reason for this is because small-scale developers, although being aware of the advantages of district heating, do not implement it in tandem with nearby developers due to their divergent building timelines and investments. Small-scale developers consequently use traditional heating according to their timetable. Every new project that may plan room for a pipe network during building construction uses district heating solutions. However, an inadequate amount of room for a pipe network may be present in older structures, which restricts its penetration.
Opportunity:
Growing awareness to diminish the carbon emission
Since the population of the world has been increasing at an exponential rate in recent years, many regions have been seeing a surge in urbanization. Because of this, demand for energy across a range of end-use industries has directly grown. Unprecedented carbon emissions and global warming are posing hazards to the planet, which has spurred interest in renewable energy sources. District energy systems help the economy move to a greener one and lower the greenhouse gas emissions from cooling and heating. As a consequence, CO2 emissions are reduced by up to 70%. These factors hasten market expansion.
Threat:
Substantial upfront investment of capital
A significant initial financial outlay is needed to set up a district heating system since it is expensive to build a secure network of transmission and distribution connections. The cost of the insulated pipes and the underground placement of such pipes is a significant barrier for investors. Additionally, the absence of necessary infrastructure and the availability of other, more affordable solutions for space heating and water heating may restrain market expansion in the years to come.
Covid-19 Impact
The COVID-19 epidemic has had a big influence on the market expansion for district heating. District heating system demand has decreased overall as a result of the fatal corona virus's appearance, which has caused delays in major infrastructure projects and the temporary closure of a number of industrial and manufacturing businesses. Additionally, almost all building projects were put on hold during the epidemic, and governments all over the world established strict regulations and trade restrictions, which severely constrained the worldwide market.
The combined heat & power segment is expected to be the largest during the forecast period
The combined heat & power segment is estimated to have a lucrative growth, due to its high sustainability and cost-effectiveness. It is anticipated that increased energy supply efficiency, the utilization of waste heat, and low-carbon renewable energy sources will increase product demand. Positive regulatory standards for reduced carbon footprints and cost savings may promote growth. A paradigm change toward sustainable power, heat, and supply, as well as legislative objectives to increase energy efficiency, all help the sector embrace cogeneration systems. The segment's growth is being fuelled by all of these prospects.
The residential segment is expected to have the highest CAGR during the forecast period
The residential segment is anticipated to witness the fastest CAGR growth during the forecast period. The demand for district heating systems in residential buildings has increased due to the widespread usage of compact heating systems and robust real estate investment. Rising urban population and increased use of decentralized generators may have a favorable effect on the business environment. Fast-paced urbanization and industrialization are predicted to have an impact on the demand for district heating systems in the commercial sector. Increased investments in the construction of new production facilities and units are also anticipated to fuel the business segment's expansion.
Region with largest share:
Asia Pacific is projected to hold the largest market share during the forecast period. China is the leading consumer of district energy. The nation has been pursuing forceful public policy choices to boost cleaner, energy-efficient district energy. Artificial intelligence is being used by the major stakeholders to control how well the district heating systems are running. The manufacturers are also aiming to create cutting-edge automation that would function in tandem with artificial intelligence to boost productivity and conserve energy. The market's technical advancements are also anticipated to accelerate expansion.
Region with highest CAGR:
Europe is projected to have the highest CAGR over the forecast period. Additionally, the growth is linked to expanding urbanization, a rise in the demand for energy-efficient systems, and a rise in the number of restrictions by the government aimed at lowering greenhouse gas emissions. Furthermore, the expansion of the district heating sector in Europe is supported by rigorous emission limitations established by several environmental organisations. Additionally, the Environmental Protection Agency's (EPA) increased emphasis on emission reduction and its pursuit of net-zero carbon emissions are anticipated to fuel the market expansion for district heating.

Key players in the market
Some of the key players profiled in the District Heating Market include NRG Energy, Fortum, LOGSTOR A/S, Goteborg Energi, Kelag Warme Gmbh, Vattenfall AB, Hafslund, STEAG GmbH, Korea District Heating Corporation, Statkraft AS, Keppel DHCS Pte Ltd, Shinryo Corporation, Orsted, RWE AG, Vital Energi, Danfoss, Engie, Enwave Energy, Ramboll Group and FVB Energy.
Key Developments:
In June 2023, Telenor and Hafslund, in partnership are establishing a company that will build secure and energy-efficient data centres in the Oslo area. The investment will contribute to establishing more Norwegian data centers and thus increase the possibility that digital services can be produced within the country's borders, which gives a greater degree of national control and better safeguarding of functions critical to society.
In March 2023, Danfoss adds a new and data-driven dimension to district energy with the launch of groundbreaking substation technology in Danfoss Titan™. Danfoss Titan™ enables reliable and fast cloud commissioning—using mathematical models and a digital twin for performance simulation to deliver best-in-class settings that also result in longer station lifetime.
Heat Sources Covered:
• Renewables
• Natural Gas
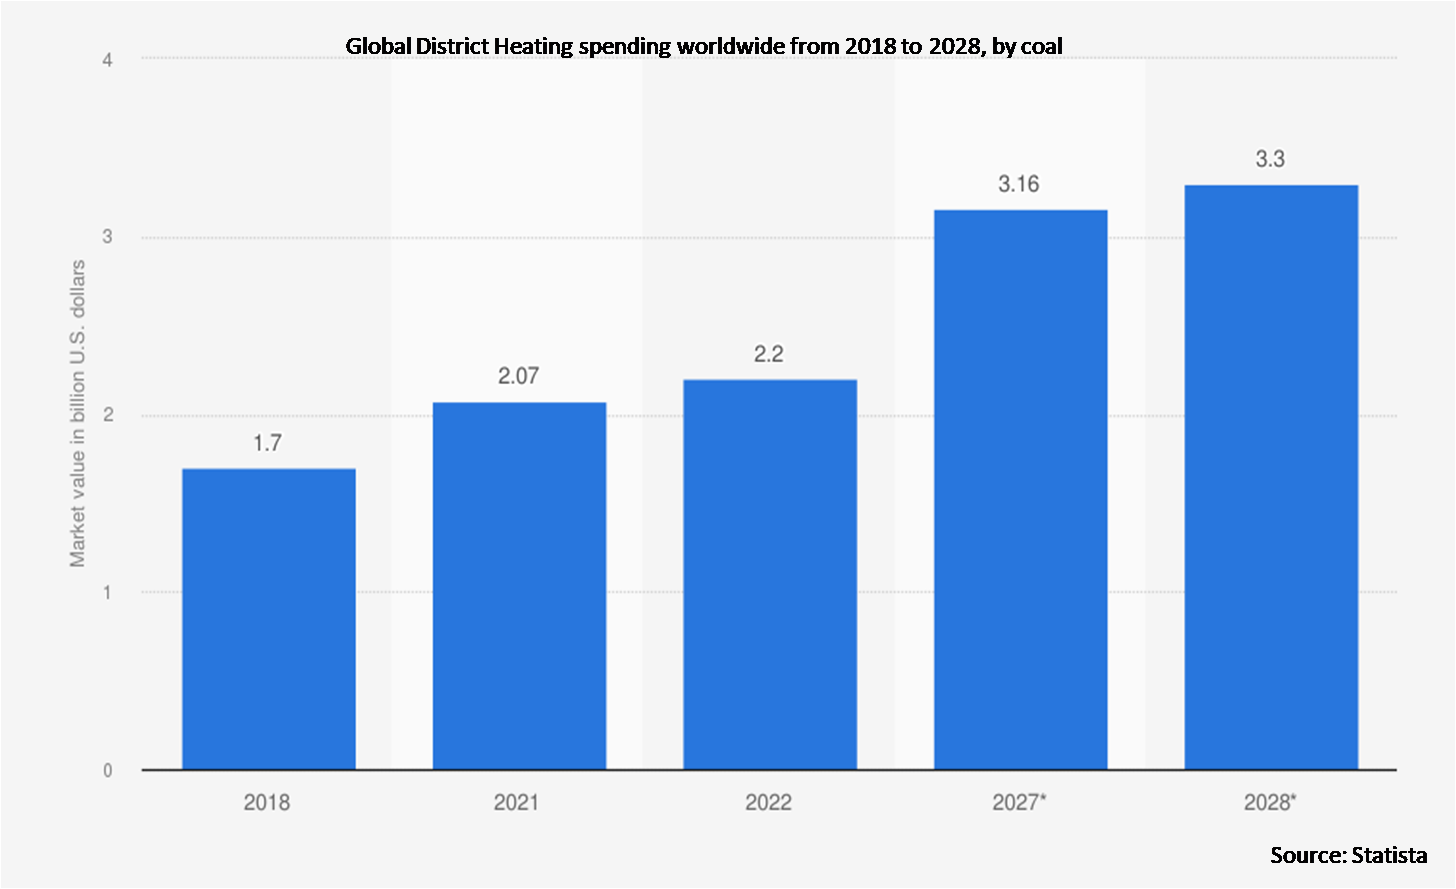
• Coal
• Oil & Petroleum Products
• Other Heat Sources
Components Covered:
• Insulated Pipeline
• Boiler
• Heat Exchanger
• Pumps
• Heat Meters
• Other Components
Plant Types Covered:
• Combined Heat & Power
• Boiler Plants
• Other Plant Types
Applications Covered:
• Residential
• Commercial
• Industrial
Regions Covered:
• North America
o US
o Canada
o Mexico
• Europe
o Germany
o UK
o Italy
o France
o Spain
o Rest of Europe
• Asia Pacific
o Japan
o China
o India
o Australia
o New Zealand
o South Korea
o Rest of Asia Pacific
• South America
o Argentina
o Brazil
o Chile
o Rest of South America
• Middle East & Africa
o Saudi Arabia
o UAE
o Qatar
o South Africa
o Rest of Middle East & Africa
What our report offers:
- Market share assessments for the regional and country-level segments
- Strategic recommendations for the new entrants
- Covers Market data for the years 2021, 2022, 2023, 2026, and 2030
- Market Trends (Drivers, Constraints, Opportunities, Threats, Challenges, Investment Opportunities, and recommendations)
- Strategic recommendations in key business segments based on the market estimations
- Competitive landscaping mapping the key common trends
- Company profiling with detailed strategies, financials, and recent developments
- Supply chain trends mapping the latest technological advancements
Free Customization Offerings:
All the customers of this report will be entitled to receive one of the following free customization options:
• Company Profiling
o Comprehensive profiling of additional market players (up to 3)
o SWOT Analysis of key players (up to 3)
• Regional Segmentation
o Market estimations, Forecasts and CAGR of any prominent country as per the client's interest (Note: Depends on feasibility check)
• Competitive Benchmarking
o Benchmarking of key players based on product portfolio, geographical presence, and strategic alliances
Table of Contents
1 Executive Summary
2 Preface
2.1 Abstract
2.2 Stake Holders
2.3 Research Scope
2.4 Research Methodology
2.4.1 Data Mining
2.4.2 Data Analysis
2.4.3 Data Validation
2.4.4 Research Approach
2.5 Research Sources
2.5.1 Primary Research Sources
2.5.2 Secondary Research Sources
2.5.3 Assumptions
3 Market Trend Analysis
3.1 Introduction
3.2 Drivers
3.3 Restraints
3.4 Opportunities
3.5 Threats
3.6 Application Analysis
3.7 Emerging Markets
3.8 Impact of Covid-19
4 Porters Five Force Analysis
4.1 Bargaining power of suppliers
4.2 Bargaining power of buyers
4.3 Threat of substitutes
4.4 Threat of new entrants
4.5 Competitive rivalry
5 Global District Heating Market, By Heat Source
5.1 Introduction
5.2 Renewables
5.3 Natural Gas
5.4 Coal
5.5 Oil & Petroleum Products
5.6 Other Heat Sources
6 Global District Heating Market, By Component
6.1 Introduction
6.2 Insulated Pipeline
6.3 Boiler
6.4 Heat Exchanger
6.5 Pumps
6.6 Heat Meters
6.7 Other Components
7 Global District Heating Market, By Plant Type
7.1 Introduction
7.2 Combined Heat & Power
7.3 Boiler Plants
7.4 Other Plant Types
8 Global District Heating Market, By Application
8.1 Introduction
8.2 Residential
8.3 Commercial
8.3.1 Office Buildings
8.3.2 Government/Military
8.3.3 College/University
8.3.4 Other Commercial Applications
8.4 Industrial
8.4.1 Chemical
8.4.2 Paper
8.4.3 Refinery
8.4.4 Other Industrial Applications
9 Global District Heating Market, By Geography
9.1 Introduction
9.2 North America
9.2.1 US
9.2.2 Canada
9.2.3 Mexico
9.3 Europe
9.3.1 Germany
9.3.2 UK
9.3.3 Italy
9.3.4 France
9.3.5 Spain
9.3.6 Rest of Europe
9.4 Asia Pacific
9.4.1 Japan
9.4.2 China
9.4.3 India
9.4.4 Australia
9.4.5 New Zealand
9.4.6 South Korea
9.4.7 Rest of Asia Pacific
9.5 South America
9.5.1 Argentina
9.5.2 Brazil
9.5.3 Chile
9.5.4 Rest of South America
9.6 Middle East & Africa
9.6.1 Saudi Arabia
9.6.2 UAE
9.6.3 Qatar
9.6.4 South Africa
9.6.5 Rest of Middle East & Africa
10 Key Developments
10.1 Agreements, Partnerships, Collaborations and Joint Ventures
10.2 Acquisitions & Mergers
10.3 New Product Launch
10.4 Expansions
10.5 Other Key Strategies
11 Company Profiling
11.1 NRG Energy
11.2 Fortum
11.3 LOGSTOR A/S
11.4 Goteborg Energi
11.5 Kelag Warme Gmbh
11.6 Vattenfall AB
11.7 Hafslund
11.8 STEAG GmbH
11.9 Korea District Heating Corporation
11.10 Statkraft AS
11.11 Keppel DHCS Pte Ltd
11.12 Shinryo Corporation
11.13 Orsted
11.14 RWE AG
11.15 Vital Energi
11.16 Danfoss
11.17 Engie
11.18 Enwave Energy
11.19 Ramboll Group
11.20 FVB Energy
List of Tables
1 Global District Heating Market Outlook, By Region (2021-2030) ($MN)
2 Global District Heating Market Outlook, By Heat Source (2021-2030) ($MN)
3 Global District Heating Market Outlook, By Renewables (2021-2030) ($MN)
4 Global District Heating Market Outlook, By Natural Gas (2021-2030) ($MN)
5 Global District Heating Market Outlook, By Coal (2021-2030) ($MN)
6 Global District Heating Market Outlook, By Oil & Petroleum Products (2021-2030) ($MN)
7 Global District Heating Market Outlook, By Other Heat Sources (2021-2030) ($MN)
8 Global District Heating Market Outlook, By Component (2021-2030) ($MN)
9 Global District Heating Market Outlook, By Insulated Pipeline (2021-2030) ($MN)
10 Global District Heating Market Outlook, By Boiler (2021-2030) ($MN)
11 Global District Heating Market Outlook, By Heat Exchanger (2021-2030) ($MN)
12 Global District Heating Market Outlook, By Pumps (2021-2030) ($MN)
13 Global District Heating Market Outlook, By Heat Meters (2021-2030) ($MN)
14 Global District Heating Market Outlook, By Other Components (2021-2030) ($MN)
15 Global District Heating Market Outlook, By Plant Type (2021-2030) ($MN)
16 Global District Heating Market Outlook, By Combined Heat & Power (2021-2030) ($MN)
17 Global District Heating Market Outlook, By Boiler Plants (2021-2030) ($MN)
18 Global District Heating Market Outlook, By Other Plant Types (2021-2030) ($MN)
19 Global District Heating Market Outlook, By Application (2021-2030) ($MN)
20 Global District Heating Market Outlook, By Residential (2021-2030) ($MN)
21 Global District Heating Market Outlook, By Commercial (2021-2030) ($MN)
22 Global District Heating Market Outlook, By Office Buildings (2021-2030) ($MN)
23 Global District Heating Market Outlook, By Government/Military (2021-2030) ($MN)
24 Global District Heating Market Outlook, By College/University (2021-2030) ($MN)
25 Global District Heating Market Outlook, By Other Commercial Applications (2021-2030) ($MN)
26 Global District Heating Market Outlook, By Industrial (2021-2030) ($MN)
27 Global District Heating Market Outlook, By Chemical (2021-2030) ($MN)
28 Global District Heating Market Outlook, By Paper (2021-2030) ($MN)
29 Global District Heating Market Outlook, By Refinery (2021-2030) ($MN)
30 Global District Heating Market Outlook, By Other Industrial Applications (2021-2030) ($MN)
Note: Tables for North America, Europe, APAC, South America, and Middle East & Africa Regions are also represented in the same manner as above.
List of Figures
RESEARCH METHODOLOGY

We at ‘Stratistics’ opt for an extensive research approach which involves data mining, data validation, and data analysis. The various research sources include in-house repository, secondary research, competitor’s sources, social media research, client internal data, and primary research.
Our team of analysts prefers the most reliable and authenticated data sources in order to perform the comprehensive literature search. With access to most of the authenticated data bases our team highly considers the best mix of information through various sources to obtain extensive and accurate analysis.
Each report takes an average time of a month and a team of 4 industry analysts. The time may vary depending on the scope and data availability of the desired market report. The various parameters used in the market assessment are standardized in order to enhance the data accuracy.
Data Mining
The data is collected from several authenticated, reliable, paid and unpaid sources and is filtered depending on the scope & objective of the research. Our reports repository acts as an added advantage in this procedure. Data gathering from the raw material suppliers, distributors and the manufacturers is performed on a regular basis, this helps in the comprehensive understanding of the products value chain. Apart from the above mentioned sources the data is also collected from the industry consultants to ensure the objective of the study is in the right direction.
Market trends such as technological advancements, regulatory affairs, market dynamics (Drivers, Restraints, Opportunities and Challenges) are obtained from scientific journals, market related national & international associations and organizations.
Data Analysis
From the data that is collected depending on the scope & objective of the research the data is subjected for the analysis. The critical steps that we follow for the data analysis include:
- Product Lifecycle Analysis
- Competitor analysis
- Risk analysis
- Porters Analysis
- PESTEL Analysis
- SWOT Analysis
The data engineering is performed by the core industry experts considering both the Marketing Mix Modeling and the Demand Forecasting. The marketing mix modeling makes use of multiple-regression techniques to predict the optimal mix of marketing variables. Regression factor is based on a number of variables and how they relate to an outcome such as sales or profits.
Data Validation
The data validation is performed by the exhaustive primary research from the expert interviews. This includes telephonic interviews, focus groups, face to face interviews, and questionnaires to validate our research from all aspects. The industry experts we approach come from the leading firms, involved in the supply chain ranging from the suppliers, distributors to the manufacturers and consumers so as to ensure an unbiased analysis.
We are in touch with more than 15,000 industry experts with the right mix of consultants, CEO's, presidents, vice presidents, managers, experts from both supply side and demand side, executives and so on.
The data validation involves the primary research from the industry experts belonging to:
- Leading Companies
- Suppliers & Distributors
- Manufacturers
- Consumers
- Industry/Strategic Consultants
Apart from the data validation the primary research also helps in performing the fill gap research, i.e. providing solutions for the unmet needs of the research which helps in enhancing the reports quality.
For more details about research methodology, kindly write to us at info@strategymrc.com
Frequently Asked Questions
In case of any queries regarding this report, you can contact the customer service by filing the “Inquiry Before Buy” form available on the right hand side. You may also contact us through email: info@strategymrc.com or phone: +1-301-202-5929
Yes, the samples are available for all the published reports. You can request them by filling the “Request Sample” option available in this page.
Yes, you can request a sample with your specific requirements. All the customized samples will be provided as per the requirement with the real data masked.
All our reports are available in Digital PDF format. In case if you require them in any other formats, such as PPT, Excel etc you can submit a request through “Inquiry Before Buy” form available on the right hand side. You may also contact us through email: info@strategymrc.com or phone: +1-301-202-5929
We offer a free 15% customization with every purchase. This requirement can be fulfilled for both pre and post sale. You may send your customization requirements through email at info@strategymrc.com or call us on +1-301-202-5929.
We have 3 different licensing options available in electronic format.
- Single User Licence: Allows one person, typically the buyer, to have access to the ordered product. The ordered product cannot be distributed to anyone else.
- 2-5 User Licence: Allows the ordered product to be shared among a maximum of 5 people within your organisation.
- Corporate License: Allows the product to be shared among all employees of your organisation regardless of their geographical location.
All our reports are typically be emailed to you as an attachment.
To order any available report you need to register on our website. The payment can be made either through CCAvenue or PayPal payments gateways which accept all international cards.
We extend our support to 6 months post sale. A post sale customization is also provided to cover your unmet needs in the report.
Request Customization
We offer complimentary customization of up to 15% with every purchase. To share your customization requirements, feel free to email us at info@strategymrc.com or call us on +1-301-202-5929. .
Please Note: Customization within the 15% threshold is entirely free of charge. If your request exceeds this limit, we will conduct a feasibility assessment. Following that, a detailed quote and timeline will be provided.
WHY CHOOSE US ?

Assured Quality
Best in class reports with high standard of research integrity

24X7 Research Support
Continuous support to ensure the best customer experience.

Free Customization
Adding more values to your product of interest.

Safe & Secure Access
Providing a secured environment for all online transactions.

Trusted by 600+ Brands
Serving the most reputed brands across the world.