
Energy Storage Market
Energy Storage Market Forecasts to 2034 – Global Analysis By Technology (Electrochemical Storage, Mechanical Storage, Thermal Energy Storage, Chemical Storage, and Supercapacitors and Ultracapacitors), Grid Connection, Application, End User, and By Geography

Market Dynamics:
Driver:
Growing need to shift energy and manage variable supply
Electricity systems increasingly require flexibility as renewable output and customer demand vary across the day. Storage can absorb energy when available and return it when the system or customer needs it, while suitably configured assets can respond quickly to balancing requirements. Commercial and industrial users also consider storage for demand management and continuity of essential operations. The strongest investment cases combine clearly defined operating duties with revenue or savings that customers can verify. Demand is therefore driven by the need to solve specific timing and reliability problems, supported where tariffs, procurement arrangements, and market access properly recognize the services delivered.
Restraint:
Uncertain revenue stacking and difficult project integration
Storage economics depend on more than equipment purchase prices. Developers must assess interconnection costs, available dispatch rights, charging costs, degradation, maintenance, and the compatibility of several potential revenue streams. A service that appears attractive in isolation may conflict with another use of the same stored energy. Long connection queues or unclear operating rules can also delay commissioning after equipment has been ordered. For less mature technologies, lenders may require additional performance evidence and warranties. These factors restrain projects that lack a credible operating strategy or allocate risks poorly, even when the underlying system need for flexibility is evident.
Opportunity:
Longer-duration services and coordinated distributed storage
Different storage durations create opportunities beyond the established use of batteries for short-term shifting and rapid response. Thermal, mechanical, flow-battery, and chemical systems can address applications whose requirements favor their particular operating characteristics. Distributed storage also becomes more useful when aggregation coordinates many customer assets while preserving agreed local needs. Software and services can improve forecasting, dispatch, and maintenance across these fleets. Suppliers have room to develop offerings that match contract obligations to realistic asset performance. Commercial success will rely on demonstrable delivered value, including reliability and operational simplicity, rather than capacity alone or an assumed ability to serve every application.
Threat:
Safety events and concentrated equipment supply chains
A serious storage incident can disrupt a project and damage confidence among communities, insurers, and customers. Battery installations require appropriate thermal management, system design, operating controls, and emergency planning, while other technologies have their own engineering risks. Concentrated supply chains introduce exposure to trade restrictions, logistics problems, and abrupt changes in component availability. Intense competition can also pressure suppliers to offer warranties or performance commitments that are difficult to sustain. These threats affect project bankability as well as equipment procurement. Buyers may consequently place greater weight on transparent testing, service continuity, and supplier financial strength when selecting systems.
Covid-19 Impact:
During COVID-19, storage development encountered equipment-delivery interruptions, restricted construction access, and uncertainty about project schedules. Changes in electricity demand also altered the operating conditions used to evaluate some applications. Customer interest in dependable power remained relevant, but translating that need into installations depended on finance and site readiness. Remote monitoring helped operators supervise assets when travel was constrained. The experience encouraged closer attention to supplier resilience and commissioning arrangements. Its lasting significance lies in demonstrating that storage projects need reliable execution and support alongside attractive technology specifications, especially when multiple vendors contribute to a complete operating system.
The Electrochemical Storage segment is expected to be the largest during the forecast period
Electrochemical Storage is expected to lead the technology segments by market value, supported by batteries' broad applicability across utility, commercial, industrial, and residential projects. Modular installations allow capacity to be matched to site requirements, and established lithium-ion supply chains support repeatable system designs. Fast response and controllable dispatch suit several electricity-market services, although actual performance varies with chemistry and system configuration. Other electrochemical approaches can address requirements such as longer discharge or different material preferences. The projected leadership concerns commercial market activity rather than an assertion that batteries exceed every other storage technology on all measures of installed energy capacity.
The Virtual Power Plant-Integrated Storage segment is expected to have the highest CAGR during the forecast period
Virtual Power Plant-Integrated Storage is anticipated to record the highest grid-connection CAGR as aggregation links customer assets to coordinated system services. A platform can combine many smaller batteries, responding to market or utility requirements while respecting customer backup preferences and equipment limits. This creates potential value beyond isolated bill savings and can make distributed installations useful to the wider grid. Expansion depends on workable enrollment, communications, settlement, and compensation arrangements. Providers that make participation understandable and dependable can improve retention, while accurate forecasting and dispatch help convert a collection of individual devices into a commercially reliable resource.
Region with largest share:
Asia Pacific is expected to hold the largest market share, supported by major battery manufacturing capability and substantial demand across power systems and customer applications. China provides a significant base for equipment production and deployment, while Australia, Japan, South Korea, and India offer different opportunities shaped by renewable integration, reliability needs, and local electricity arrangements. The region also contains important mechanical-storage infrastructure and emerging alternative technologies. This combination supports a broad commercial ecosystem of component suppliers, integrators, developers, and end users. Competitive pricing and local delivery capacity help sustain activity, although project economics remain specific to each operating market.
Region with highest CAGR:
Asia Pacific is also projected to achieve the highest regional CAGR as storage moves into a wider range of grid and customer settings. Rapid renewable additions can increase the need for time shifting, while commercial users and households evaluate backup and energy-cost management. Manufacturing scale supports product adaptation and deployment experience across different system sizes. Growth opportunities extend beyond the region's largest markets where operating rules and investment frameworks permit storage to earn dependable returns. The forecast therefore reflects both expanding applications and improving delivery capability, with connection capacity, safety practices, and sustainable supplier economics influencing how quickly projects become operational.
Key players in the market
Some of the key players in the Energy Storage Market include Tesla, Inc., Contemporary Amperex Technology Co. Limited (CATL), BYD Company Limited, Fluence Energy, Inc., Wärtsilä Corporation, LG Energy Solution, Ltd., Samsung SDI Co., Ltd., Eos Energy Enterprises, Inc., ESS Tech, Inc., NextEra Energy, Inc., Siemens Energy AG, General Electric Company, Duke Energy Corporation, Sonnen GmbH, Energy Vault Holdings, Inc., Sumitomo Electric Industries, Ltd., Hitachi Energy Ltd., and Saft Groupe S.A..
Key Developments:
In February 2025, Fluence unveiled Smartstack, an AC-based energy storage platform with a modular arrangement of battery pods and supporting equipment. At launch, customer deliveries were scheduled for the final quarter of 2025. Its design addressed transport, installation, and site-space constraints in grid-scale projects.
In September 2024, Wärtsilä introduced Quantum3, integrating batteries, power conversion, battery management, and its GEMS energy-management platform. The announcement illustrates the importance of complete system control and integration in storage procurement, extending competition beyond the battery cells themselves.
In April 2024, CATL unveiled its TENER energy storage system in Beijing. The launch added a large-format product to its stationary-storage offering, with the manufacturer emphasizing energy density, safety, and degradation management. The development reflects continued product engineering for the requirements of large storage installations.
Technologies Covered:
• Electrochemical Storage
o Lithium-Ion Batteries
o Flow Batteries
o Sodium-Sulfur Batteries
o Lead-Acid Batteries
• Mechanical Storage
o Pumped Hydro Storage
o Compressed Air Energy Storage
o Flywheel Energy Storage
• Thermal Energy Storage
o Sensible Heat Storage
o Latent Heat Storage
o Thermochemical Storage
• Chemical Storage
o Hydrogen Energy Storage
o Power-to-Gas Storage
• Supercapacitors and Ultracapacitors
Grid Connections Covered:
• Front-of-the-Meter Grid Storage
• Behind-the-Meter Customer Storage
• Off-Grid Standalone Storage
• Virtual Power Plant-Integrated Storage
Applications Covered:
• Renewable Energy Integration
• Peak Shaving and Load Shifting
• Backup Power and Energy Security
• Frequency Regulation and Ancillary Services
• Energy Arbitrage and Trading
End Users Covered:
• Power Generation
• Transmission and Distribution
• Residential
• Commercial
• Industrial
• Transportation
Regions Covered:
• North America
o United States
o Canada
o Mexico
• Europe
o United Kingdom
o Germany
o France
o Italy
o Spain
o Netherlands
o Belgium
o Sweden
o Switzerland
o Poland
o Rest of Europe
• Asia Pacific
o China
o Japan
o India
o South Korea
o Australia
o Indonesia
o Thailand
o Malaysia
o Singapore
o Vietnam
o Rest of Asia Pacific
• South America
o Brazil
o Argentina
o Colombia
o Chile
o Peru
o Rest of South America
• Rest of the World (RoW)
o Middle East
Saudi Arabia
United Arab Emirates
Qatar
Israel
Rest of Middle East
o Africa
South Africa
Egypt
Morocco
Rest of Africa
What our report offers:
- Market-share assessments for energy storage at regional and country levels
- Market-entry recommendations matched to storage technologies and customer applications
- Market data for the specified years 2023, 2024, 2025, 2026, 2027, 2028, 2030, 2032 and 2034
- Analysis of growth drivers, constraints, opportunities, threats, challenges, investment opportunities, and recommendations
- Strategic recommendations for key storage business segments using the market estimations
- Competitive landscape mapping of common product, integration, and service trends
- Detailed company profiles with strategy, financials, and recent developments
- Supply-chain trends and the latest technological advancements across storage systems
Free Customization Offerings:
Energy storage report customers may choose one free customization option from the categories below:
• Company Profiling
o Comprehensive profiling of additional storage-industry companies (up to 3)
o SWOT analysis for selected key players in the competitive landscape (up to 3)
• Regional Segmentation
o Market estimations, forecasts, and CAGR for any prominent country requested (Note: Depends on feasibility check)
• Competitive Benchmarking
o Comparison of product portfolios, geographical presence, and strategic alliances among key players
Table of Contents
1 Executive Summary1.1 Market Snapshot and Key Highlights
1.2 Growth Drivers, Challenges, and Opportunities
1.3 Competitive Landscape Overview
1.4 Strategic Insights and Recommendations
2 Research Framework
2.1 Study Objectives and Scope
2.2 Stakeholder Analysis
2.3 Research Assumptions and Limitations
2.4 Research Methodology
2.4.1 Data Collection (Primary and Secondary)
2.4.2 Data Modeling and Estimation Techniques
2.4.3 Data Validation and Triangulation
2.4.4 Analytical and Forecasting Approach
3 Market Dynamics and Trend Analysis
3.1 Market Definition and Structure
3.2 Key Market Drivers
3.3 Market Restraints and Challenges
3.4 Growth Opportunities and Investment Hotspots
3.5 Industry Threats and Risk Assessment
3.6 Technology and Innovation Landscape
3.7 Emerging and High-Growth Markets
3.8 Regulatory and Policy Environment
3.9 Impact of COVID-19 and Recovery Outlook
4 Competitive and Strategic Assessment
4.1 Porter's Five Forces Analysis
4.1.1 Supplier Bargaining Power
4.1.2 Buyer Bargaining Power
4.1.3 Threat of Substitutes
4.1.4 Threat of New Entrants
4.1.5 Competitive Rivalry
4.2 Market Share Analysis of Key Players
4.3 Product Benchmarking and Performance Comparison
5 Global Energy Storage Market, By Technology
5.1 Electrochemical Storage
5.1.1 Lithium-Ion Batteries
5.1.2 Flow Batteries
5.1.3 Sodium-Sulfur Batteries
5.1.4 Lead-Acid Batteries
5.2 Mechanical Storage
5.2.1 Pumped Hydro Storage
5.2.2 Compressed Air Energy Storage
5.2.3 Flywheel Energy Storage
5.3 Thermal Energy Storage
5.3.1 Sensible Heat Storage
5.3.2 Latent Heat Storage
5.3.3 Thermochemical Storage
5.4 Chemical Storage
5.4.1 Hydrogen Energy Storage
5.4.2 Power-to-Gas Storage
5.5 Supercapacitors and Ultracapacitors
6 Global Energy Storage Market, By Grid Connection
6.1 Front-of-the-Meter Grid Storage
6.2 Behind-the-Meter Customer Storage
6.3 Off-Grid Standalone Storage
6.4 Virtual Power Plant-Integrated Storage
7 Global Energy Storage Market, By Application
7.1 Renewable Energy Integration
7.2 Peak Shaving and Load Shifting
7.3 Backup Power and Energy Security
7.4 Frequency Regulation and Ancillary Services
7.5 Energy Arbitrage and Trading
8 Global Energy Storage Market, By End User
8.1 Power Generation
8.2 Transmission and Distribution
8.3 Residential
8.4 Commercial
8.5 Industrial
8.6 Transportation
9 Global Energy Storage Market, By Geography
9.1 North America
9.1.1 United States
9.1.2 Canada
9.1.3 Mexico
9.2 Europe
9.2.1 United Kingdom
9.2.2 Germany
9.2.3 France
9.2.4 Italy
9.2.5 Spain
9.2.6 Netherlands
9.2.7 Belgium
9.2.8 Sweden
9.2.9 Switzerland
9.2.10 Poland
9.2.11 Rest of Europe
9.3 Asia Pacific
9.3.1 China
9.3.2 Japan
9.3.3 India
9.3.4 South Korea
9.3.5 Australia
9.3.6 Indonesia
9.3.7 Thailand
9.3.8 Malaysia
9.3.9 Singapore
9.3.10 Vietnam
9.3.11 Rest of Asia Pacific
9.4 South America
9.4.1 Brazil
9.4.2 Argentina
9.4.3 Colombia
9.4.4 Chile
9.4.5 Peru
9.4.6 Rest of South America
9.5 Rest of the World (RoW)
9.5.1 Middle East
9.5.1.1 Saudi Arabia
9.5.1.2 United Arab Emirates
9.5.1.3 Qatar
9.5.1.4 Israel
9.5.1.5 Rest of Middle East
9.5.2 Africa
9.5.2.1 South Africa
9.5.2.2 Egypt
9.5.2.3 Morocco
9.5.2.4 Rest of Africa
10 Strategic Market Intelligence
10.1 Industry Value Network and Supply Chain Assessment
10.2 White-Space and Opportunity Mapping
10.3 Product Evolution and Market Life Cycle Analysis
10.4 Channel, Distributor, and Go-to-Market Assessment
11 Industry Developments and Strategic Initiatives
11.1 Mergers and Acquisitions
11.2 Partnerships, Alliances, and Joint Ventures
11.3 New Product Launches and Certifications
11.4 Capacity Expansion and Investments
11.5 Other Strategic Initiatives
12 Company Profiles
12.1 Tesla, Inc.
12.2 Contemporary Amperex Technology Co. Limited (CATL)
12.3 BYD Company Limited
12.4 Fluence Energy, Inc.
12.5 Wärtsilä Corporation
12.6 LG Energy Solution, Ltd.
12.7 Samsung SDI Co., Ltd.
12.8 Eos Energy Enterprises, Inc.
12.9 ESS Tech, Inc.
12.10 NextEra Energy, Inc.
12.11 Siemens Energy AG
12.12 General Electric Company
12.13 Duke Energy Corporation
12.14 Sonnen GmbH
12.15 Energy Vault Holdings, Inc.
12.16 Sumitomo Electric Industries, Ltd.
12.17 Hitachi Energy Ltd.
12.18 Saft Groupe S.A.
List of Tables
1 Global Energy Storage Market Outlook, By Region (2023–2034) ($MN)
2 Global Energy Storage Market Outlook, By Technology (2023–2034) ($MN)
3 Global Energy Storage Market Outlook, By Electrochemical Storage (2023–2034) ($MN)
4 Global Energy Storage Market Outlook, By Lithium-Ion Batteries (2023–2034) ($MN)
5 Global Energy Storage Market Outlook, By Flow Batteries (2023–2034) ($MN)
6 Global Energy Storage Market Outlook, By Sodium-Sulfur Batteries (2023–2034) ($MN)
7 Global Energy Storage Market Outlook, By Lead-Acid Batteries (2023–2034) ($MN)
8 Global Energy Storage Market Outlook, By Mechanical Storage (2023–2034) ($MN)
9 Global Energy Storage Market Outlook, By Pumped Hydro Storage (2023–2034) ($MN)
10 Global Energy Storage Market Outlook, By Compressed Air Energy Storage (2023–2034) ($MN)
11 Global Energy Storage Market Outlook, By Flywheel Energy Storage (2023–2034) ($MN)
12 Global Energy Storage Market Outlook, By Thermal Energy Storage (2023–2034) ($MN)
13 Global Energy Storage Market Outlook, By Sensible Heat Storage (2023–2034) ($MN)
14 Global Energy Storage Market Outlook, By Latent Heat Storage (2023–2034) ($MN)
15 Global Energy Storage Market Outlook, By Thermochemical Storage (2023–2034) ($MN)
16 Global Energy Storage Market Outlook, By Chemical Storage (2023–2034) ($MN)
17 Global Energy Storage Market Outlook, By Hydrogen Energy Storage (2023–2034) ($MN)
18 Global Energy Storage Market Outlook, By Power-to-Gas Storage (2023–2034) ($MN)
19 Global Energy Storage Market Outlook, By Supercapacitors and Ultracapacitors (2023–2034) ($MN)
20 Global Energy Storage Market Outlook, By Grid Connection (2023–2034) ($MN)
21 Global Energy Storage Market Outlook, By Front-of-the-Meter Grid Storage (2023–2034) ($MN)
22 Global Energy Storage Market Outlook, By Behind-the-Meter Customer Storage (2023–2034) ($MN)
23 Global Energy Storage Market Outlook, By Off-Grid Standalone Storage (2023–2034) ($MN)
24 Global Energy Storage Market Outlook, By Virtual Power Plant-Integrated Storage (2023–2034) ($MN)
25 Global Energy Storage Market Outlook, By Application (2023–2034) ($MN)
26 Global Energy Storage Market Outlook, By Renewable Energy Integration (2023–2034) ($MN)
27 Global Energy Storage Market Outlook, By Peak Shaving and Load Shifting (2023–2034) ($MN)
28 Global Energy Storage Market Outlook, By Backup Power and Energy Security (2023–2034) ($MN)
29 Global Energy Storage Market Outlook, By Frequency Regulation and Ancillary Services (2023–2034) ($MN)
30 Global Energy Storage Market Outlook, By Energy Arbitrage and Trading (2023–2034) ($MN)
31 Global Energy Storage Market Outlook, By End User (2023–2034) ($MN)
32 Global Energy Storage Market Outlook, By Power Generation (2023–2034) ($MN)
33 Global Energy Storage Market Outlook, By Transmission and Distribution (2023–2034) ($MN)
34 Global Energy Storage Market Outlook, By Residential (2023–2034) ($MN)
35 Global Energy Storage Market Outlook, By Commercial (2023–2034) ($MN)
36 Global Energy Storage Market Outlook, By Industrial (2023–2034) ($MN)
37 Global Energy Storage Market Outlook, By Transportation (2023–2034) ($MN)
Note: Tables for North America, Europe, APAC, South America, and Rest of the World (RoW) Regions are also represented in the same manner as above.
List of Figures
RESEARCH METHODOLOGY
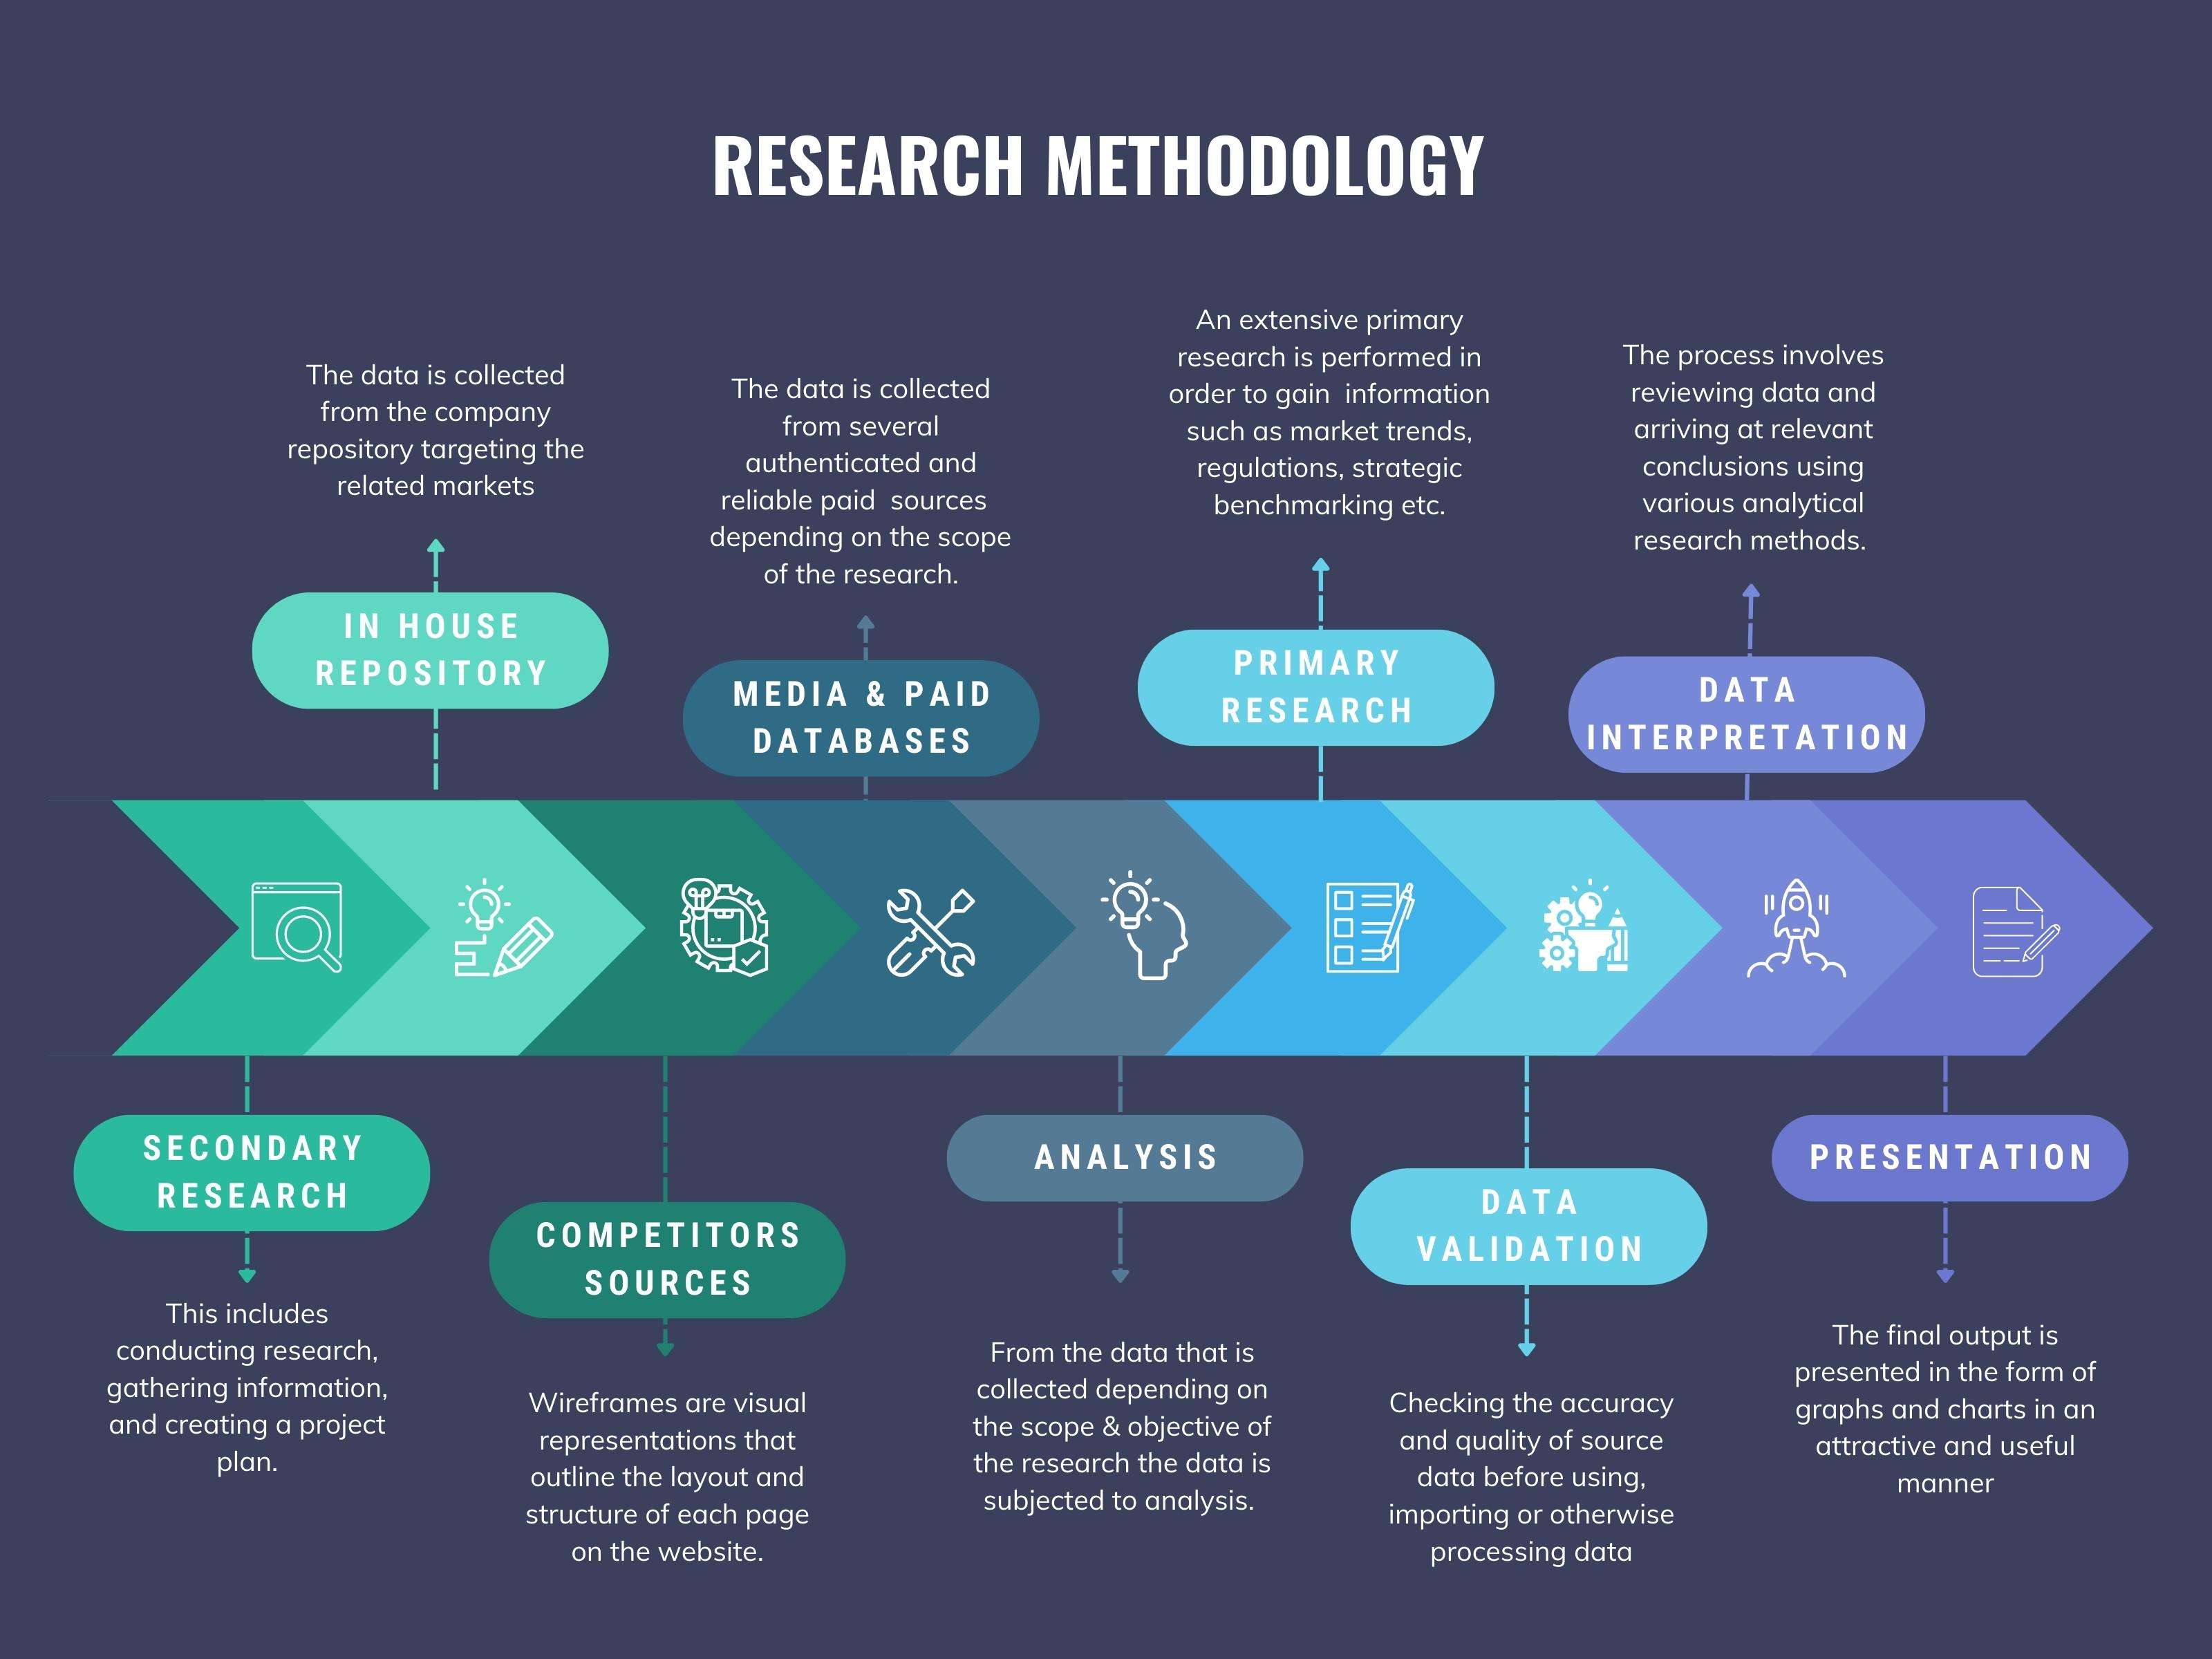
We at ‘Stratistics’ opt for an extensive research approach which involves data mining, data validation, and data analysis. The various research sources include in-house repository, secondary research, competitor’s sources, social media research, client internal data, and primary research.
Our team of analysts prefers the most reliable and authenticated data sources in order to perform the comprehensive literature search. With access to most of the authenticated data bases our team highly considers the best mix of information through various sources to obtain extensive and accurate analysis.
Each report takes an average time of a month and a team of 4 industry analysts. The time may vary depending on the scope and data availability of the desired market report. The various parameters used in the market assessment are standardized in order to enhance the data accuracy.
Data Mining
The data is collected from several authenticated, reliable, paid and unpaid sources and is filtered depending on the scope & objective of the research. Our reports repository acts as an added advantage in this procedure. Data gathering from the raw material suppliers, distributors and the manufacturers is performed on a regular basis, this helps in the comprehensive understanding of the products value chain. Apart from the above mentioned sources the data is also collected from the industry consultants to ensure the objective of the study is in the right direction.
Market trends such as technological advancements, regulatory affairs, market dynamics (Drivers, Restraints, Opportunities and Challenges) are obtained from scientific journals, market related national & international associations and organizations.
Data Analysis
From the data that is collected depending on the scope & objective of the research the data is subjected for the analysis. The critical steps that we follow for the data analysis include:
- Product Lifecycle Analysis
- Competitor analysis
- Risk analysis
- Porters Analysis
- PESTEL Analysis
- SWOT Analysis
The data engineering is performed by the core industry experts considering both the Marketing Mix Modeling and the Demand Forecasting. The marketing mix modeling makes use of multiple-regression techniques to predict the optimal mix of marketing variables. Regression factor is based on a number of variables and how they relate to an outcome such as sales or profits.
Data Validation
The data validation is performed by the exhaustive primary research from the expert interviews. This includes telephonic interviews, focus groups, face to face interviews, and questionnaires to validate our research from all aspects. The industry experts we approach come from the leading firms, involved in the supply chain ranging from the suppliers, distributors to the manufacturers and consumers so as to ensure an unbiased analysis.
We are in touch with more than 15,000 industry experts with the right mix of consultants, CEO's, presidents, vice presidents, managers, experts from both supply side and demand side, executives and so on.
The data validation involves the primary research from the industry experts belonging to:
- Leading Companies
- Suppliers & Distributors
- Manufacturers
- Consumers
- Industry/Strategic Consultants
Apart from the data validation the primary research also helps in performing the fill gap research, i.e. providing solutions for the unmet needs of the research which helps in enhancing the reports quality.
For more details about research methodology, kindly write to us at info@strategymrc.com
Frequently Asked Questions
In case of any queries regarding this report, you can contact the customer service by filing the “Inquiry Before Buy” form available on the right hand side. You may also contact us through email: info@strategymrc.com or phone: +1-301-202-5929
Yes, the samples are available for all the published reports. You can request them by filling the “Request Sample” option available in this page.
Yes, you can request a sample with your specific requirements. All the customized samples will be provided as per the requirement with the real data masked.
All our reports are available in Digital PDF format. In case if you require them in any other formats, such as PPT, Excel etc you can submit a request through “Inquiry Before Buy” form available on the right hand side. You may also contact us through email: info@strategymrc.com or phone: +1-301-202-5929
We offer a free 15% customization with every purchase. This requirement can be fulfilled for both pre and post sale. You may send your customization requirements through email at info@strategymrc.com or call us on +1-301-202-5929.
We have 3 different licensing options available in electronic format.
- Single User Licence: Allows one person, typically the buyer, to have access to the ordered product. The ordered product cannot be distributed to anyone else.
- 2-5 User Licence: Allows the ordered product to be shared among a maximum of 5 people within your organisation.
- Corporate License: Allows the product to be shared among all employees of your organisation regardless of their geographical location.
All our reports are typically be emailed to you as an attachment.
To order any available report you need to register on our website. The payment can be made either through CCAvenue or PayPal payments gateways which accept all international cards.
We extend our support to 6 months post sale. A post sale customization is also provided to cover your unmet needs in the report.
Request Customization
We offer complimentary customization of up to 15% with every purchase. To share your customization requirements, feel free to email us at info@strategymrc.com or call us on +1-301-202-5929. .
Please Note: Customization within the 15% threshold is entirely free of charge. If your request exceeds this limit, we will conduct a feasibility assessment. Following that, a detailed quote and timeline will be provided.
WHY CHOOSE US ?

Assured Quality
Best in class reports with high standard of research integrity

24X7 Research Support
Continuous support to ensure the best customer experience.

Free Customization
Adding more values to your product of interest.

Safe & Secure Access
Providing a secured environment for all online transactions.

Trusted by 600+ Brands
Serving the most reputed brands across the world.