
Fish Pumps Market
Fish Pumps Market Forecasts to 2030 - Global Analysis By Size (2.5- Pumps, 4- Pumps, 6- Pumps and Other Sizes), Application (Aquaculture and Fishing), Mode of Operation (Manual and Automatic), and By Geography

|
Years Covered |
2021-2030 |
|
Estimated Year Value (2023) |
US $141.3 MN |
|
Projected Year Value (2030) |
US $268.5 MN |
|
CAGR (2023 - 2030) |
9.6% |
|
Regions Covered |
North America, Europe, Asia Pacific, South America, and Middle East & Africa |
|
Countries Covered |
US, Canada, Mexico, Germany, UK, Italy, France, Spain, Japan, China, India, Australia, New Zealand, South Korea, Rest of Asia Pacific, South America, Argentina, Brazil, Chile, Middle East & Africa, Saudi Arabia, UAE, Qatar, and South Africa |
|
Largest Market |
North America |
|
Highest Growing Market |
Asia Pacific |
According to Stratistics MRC, the Global Fish Pumps Market is accounted for $141.3 million in 2023 and is expected to reach $268.5 million by 2030 growing at a CAGR of 9.6% during the forecast period. A fish tank attachment called a fish water pump aerates and circulates water to make it healthier for marine life. All of the water in a tank must pass through the tank's filter because of the current that a water pump generates. This continuous flow distributes nutrients throughout the tank uniformly and produces high-quality water that shields fish from illness. Water pumps not only improve your health but also enhance the aesthetics of your tank. A water pump makes the plants in your tank dynamic by causing them to wave in response to the increased water flow.
According to International Trade Administration, US Department of Commerce, aquaculture is expected to grow exponentially due to the high demand for seafood and the annual decline in the amount of captured wild fish.
Market Dynamics:
Driver:
Growing aquaculture industry
The demand for fish is rising globally as the world's population rises. This tendency is anticipated to persist as the population, urbanisation, and incomes of the developing world increase. Additionally, customers are switching to fish owing to the drawbacks of eating fish, such as red meat's bad health effects and the unsustainable nature of meat and poultry. The FAO predicts that there would be a demand for fish and fish products throughout the Asia-Pacific area due to its importance to the local economies of the area; aquaculture is predicted to expand the fastest in the Asia-Pacific region.
Restraint:
Effect of cavitation in commercial pumps
Cavitation is the term used to describe the creation of a vapour phase in a liquid under decreasing pressure and constant ambient temperature. These fish pumps sustain significant damage as a result of the imposition of these bubbles, flake, and tiny pieces of metal from impeller surfaces, which cause low-frequency vibration and noise. This creation and collapse are swift and forceful in the event of cavitation. Pumps' performance is affected, which lowers sales and raises replacement costs. Processing lines that are interrupted or carried out incorrectly run the risk of lowering suction or discharge pressure, which results in cavitation. Therefore, problems due to cavitation and dry-run might impede the market expansion for industrial pumps.
Opportunity:
Growing demand for advanced machinery
In order to move fluid from one place to another, pumps and other components are essential. The global market for fish transfer pumps has seen an increasing expansion, mostly as a result of enhanced technology, the existence of important players, and the desire for process optimisation due to globalisation, customers are becoming more aware of numerous developments in automation. Companies that produce industrial pumps are spreading out around the world as a result of trade liberalisation. In order to uphold safety requirements, boost output, and satisfy shifting customer demand, the aquaculture business looks for cutting-edge equipment and delivery solutions. This will increase demand for industrial pumps as well since they gently move fish without coming into touch with people.
Threat:
Rising consumer interest in vegan diets
More people are choosing options that are better for the environment as a result of growing knowledge of climate change and animal suffering. There is more demand for food made from plants as people become more aware of the health advantages of eating a vegetarian or vegan diet. In industrialised nations like North America and Europe, where people are consuming more vegetarian food in their regular meals, this awareness is particularly noticeable. Consumer preference for vegetarian and vegan cuisine has also been observed in other places, such as Asia Pacific, where it is anticipated that it would rise as a result of customer’s worries about their health and the environment.
Covid-19 Impact
The limits and the market for fish pumps have both been badly impacted by the stringent lockdown. The markets are beginning to indicate prospective development, and the economies of the various sectors are improving. The COVID-19 epidemic is changing the industry and giving players a huge potential to grow. Consumers are getting more knowledgeable about different automation developments as a result of globalisation.
The 2.5” Pumps segment is expected to be the largest during the forecast period
The 2.5” Pumps segment is estimated to have a lucrative growth, due to these pumps are used to move little fish bits. Hatcheries benefit greatly from using these little pumps. Hatcheries are where aquaculture products are grown and reared for at least some of their life cycles. The seed stock for commercial aquaculture grow-out farms, aquarium commerce, and fish stocking programmes is provided by aquaculture hatcheries. It serves as an essential source of nutrition for individuals in impoverished countries. The outcome has been an increase in fish productivity.
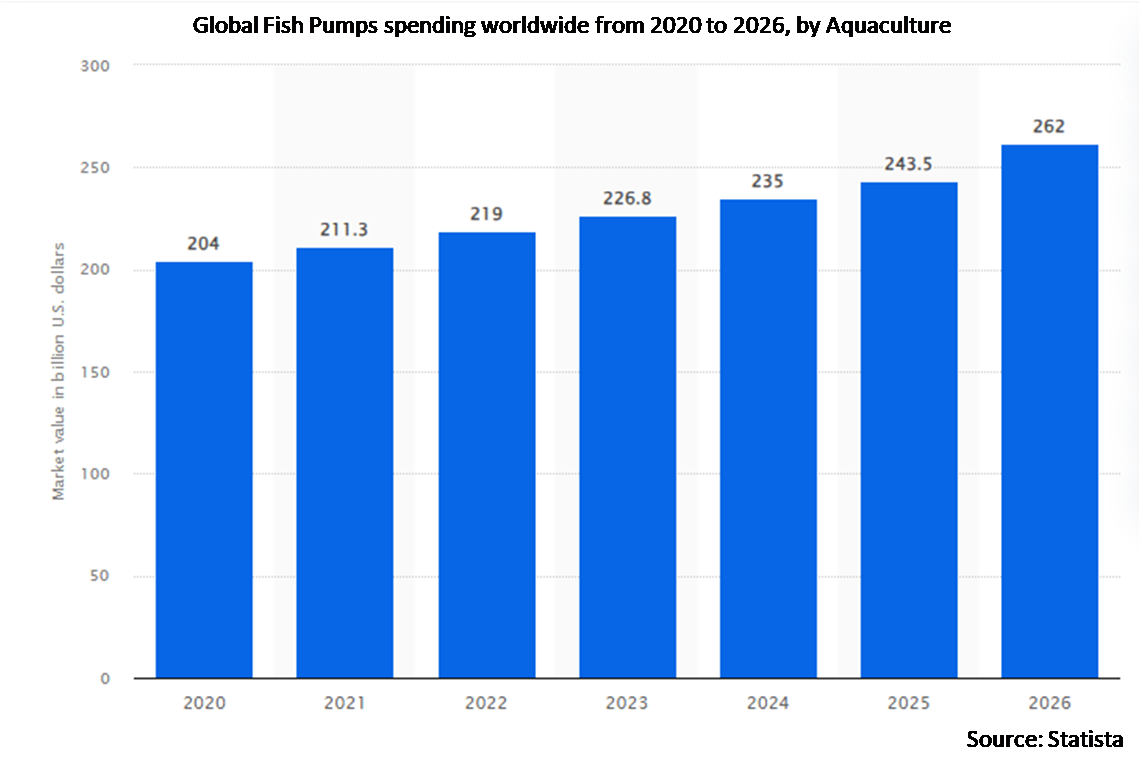
The aquaculture segment is expected to have the highest CAGR during the forecast period
The aquaculture segment is anticipated to witness the highest CAGR growth during the forecast period, due to the rise of the market may be attributed to the increasing demand for seafood on a global scale and increased awareness of the benefits of seafood eating. Technological advancements in aquaculture pumps are another aspect fueling this market's growth. This is due to the fact that they are easier to install and consume less energy than water pumps. Aquaculture pumps are equipped with Super Duplex Stainless Steel Impellers, which never corrode and have extraordinary hardness capable of handling any particles in the water which drives the growth of the market.
Region with largest share:
North America is projected to hold the largest market share during the forecast period owing to its highly developed economy; North America has seen significant advancements and inventions in the fish pumps industry. The US, which continues to have a robust seafood market and a vibrant seafood trade, is the main nation fuelling the region's growth. Additionally, during the past ten years, the nation's intake of seafood has steadily expanded, making fish pumps more profitable. Fish pumps will be in more demand as a result of Canada's ability to provide nutritious, sustainable seafood through aquaculture.
Region with highest CAGR:
Asia Pacific is projected to have the highest CAGR over the forecast period, owing to major nations like China, Japan, and the rest of Asia Pacific make up the Asia Pacific area. Fish pumps are becoming more popular as the global middle class grows in nations like China, India, and Indonesia. The aquaculture sector in China has experienced remarkable growth in recent years, making it the world's top producer. A growth in the nation's appetite for seafood and related goods, as well as a stronger focus on boosting aquaculture production, will all contribute to an increase in the demand for fish pumps over the research period.

Key players in the market
Some of the key players profiled in the Fish Pumps Market include Pg Flow Solutions, Pentair AES, MMC First Process, Maskon, Mjos Metallvarefabrikk As, Sterner, Smir, Acuinuga, Inventive Marine Products Limited, Innovasea, Cflow, Marel, Faivre, TH Company, Magic Vlly Heli-Arc and Cermaq
Key Developments:
In November 2021, TH Company the Company opened its new office in Ecuador. This is the country's new hydraulic and pneumatic material logistics hub company. The new office enabled the company to provide technical assistance and better serve its customers.
In August 2021, Cermaq, a salmon producer, and Folla Alger, an aquaculture company, have agreed to collaborate on integrated salmon and kelp farming with leading Norwegian research environments.
Sizes Covered:
• 2.5” Pumps
• 4” Pumps
• 6” Pumps
• 8” Pumps
• 10” Pumps
• 12” Pumps
• 14” Pumps
Applications Covered:
• Aquaculture
• Fishing
Mode of Operations Covered:
• Manual
• Automatic
Regions Covered:
• North America
o US
o Canada
o Mexico
• Europe
o Germany
o UK
o Italy
o France
o Spain
o Rest of Europe
• Asia Pacific
o Japan
o China
o India
o Australia
o New Zealand
o South Korea
o Rest of Asia Pacific
• South America
o Argentina
o Brazil
o Chile
o Rest of South America
• Middle East & Africa
o Saudi Arabia
o UAE
o Qatar
o South Africa
o Rest of Middle East & Africa
What our report offers:
- Market share assessments for the regional and country-level segments
- Strategic recommendations for the new entrants
- Covers Market data for the years 2021, 2022, 2023, 2026, and 2030
- Market Trends (Drivers, Constraints, Opportunities, Threats, Challenges, Investment Opportunities, and recommendations)
- Strategic recommendations in key business segments based on the market estimations
- Competitive landscaping mapping the key common trends
- Company profiling with detailed strategies, financials, and recent developments
- Supply chain trends mapping the latest technological advancements
Free Customization Offerings:
All the customers of this report will be entitled to receive one of the following free customization options:
• Company Profiling
o Comprehensive profiling of additional market players (up to 3)
o SWOT Analysis of key players (up to 3)
• Regional Segmentation
o Market estimations, Forecasts and CAGR of any prominent country as per the client's interest (Note: Depends on feasibility check)
• Competitive Benchmarking
o Benchmarking of key players based on product portfolio, geographical presence, and strategic alliances
Table of Contents
1 Executive Summary
2 Preface
2.1 Abstract
2.2 Stake Holders
2.3 Research Scope
2.4 Research Methodology
2.4.1 Data Mining
2.4.2 Data Analysis
2.4.3 Data Validation
2.4.4 Research Approach
2.5 Research Sources
2.5.1 Primary Research Sources
2.5.2 Secondary Research Sources
2.5.3 Assumptions
3 Market Trend Analysis
3.1 Introduction
3.2 Drivers
3.3 Restraints
3.4 Opportunities
3.5 Threats
3.6 Application Analysis
3.7 Emerging Markets
3.8 Impact of Covid-19
4 Porters Five Force Analysis
4.1 Bargaining power of suppliers
4.2 Bargaining power of buyers
4.3 Threat of substitutes
4.4 Threat of new entrants
4.5 Competitive rivalry
5 Global Fish Pumps Market, By Size
5.1 Introduction
5.2 2.5” Pumps
5.3 4” Pumps
5.4 6” Pumps
5.5 8” Pumps
5.6 10” Pumps
5.7 12” Pumps
5.8 14” Pumps
6 Global Fish Pumps Market, By Application
6.1 Introduction
6.2 Aquaculture
6.3 Fishing
7 Global Fish Pumps Market, By Mode of Operation
7.1 Introduction
7.2 Manual
7.3 Automatic
8 Global Fish Pumps Market, By Geography
8.1 Introduction
8.2 North America
8.2.1 US
8.2.2 Canada
8.2.3 Mexico
8.3 Europe
8.3.1 Germany
8.3.2 UK
8.3.3 Italy
8.3.4 France
8.3.5 Spain
8.3.6 Rest of Europe
8.4 Asia Pacific
8.4.1 Japan
8.4.2 China
8.4.3 India
8.4.4 Australia
8.4.5 New Zealand
8.4.6 South Korea
8.4.7 Rest of Asia Pacific
8.5 South America
8.5.1 Argentina
8.5.2 Brazil
8.5.3 Chile
8.5.4 Rest of South America
8.6 Middle East & Africa
8.6.1 Saudi Arabia
8.6.2 UAE
8.6.3 Qatar
8.6.4 South Africa
8.6.5 Rest of Middle East & Africa
9 Key Developments
9.1 Agreements, Partnerships, Collaborations and Joint Ventures
9.2 Acquisitions & Mergers
9.3 New Product Launch
9.4 Expansions
9.5 Other Key Strategies
10 Company Profiling
10.1 Pg Flow Solutions
10.2 Pentair AES
10.3 MMC First Process
10.4 Maskon
10.5 Mjos Metallvarefabrikk As
10.6 Sterner
10.7 Smir
10.8 Acuinuga
10.9 Inventive Marine Products Limited
10.10 Innovasea
10.11 Cflow
10.12 Marel
10.13 Faivre
10.14 TH Company
10.15 Magic Vlly Heli-Arc
10.16 Cermaq
List of Tables
1 Global Fish Pumps Market Outlook, By Region (2021-2030) ($MN)
2 Global Fish Pumps Market Outlook, By Size (2021-2030) ($MN)
3 Global Fish Pumps Market Outlook, By 2.5” Pumps (2021-2030) ($MN)
4 Global Fish Pumps Market Outlook, By 4” Pumps (2021-2030) ($MN)
5 Global Fish Pumps Market Outlook, By 6” Pumps (2021-2030) ($MN)
6 Global Fish Pumps Market Outlook, By 8” Pumps (2021-2030) ($MN)
7 Global Fish Pumps Market Outlook, By 10” Pumps (2021-2030) ($MN)
8 Global Fish Pumps Market Outlook, By 12” Pumps (2021-2030) ($MN)
9 Global Fish Pumps Market Outlook, By 14” Pumps (2021-2030) ($MN)
10 Global Fish Pumps Market Outlook, By Application (2021-2030) ($MN)
11 Global Fish Pumps Market Outlook, By Aquaculture (2021-2030) ($MN)
12 Global Fish Pumps Market Outlook, By Fishing (2021-2030) ($MN)
13 Global Fish Pumps Market Outlook, By Mode of Operation (2021-2030) ($MN)
14 Global Fish Pumps Market Outlook, By Manual (2021-2030) ($MN)
15 Global Fish Pumps Market Outlook, By Automatic (2021-2030) ($MN)
16 North America Fish Pumps Market Outlook, By Country (2021-2030) ($MN)
17 North America Fish Pumps Market Outlook, By Size (2021-2030) ($MN)
18 North America Fish Pumps Market Outlook, By 2.5” Pumps (2021-2030) ($MN)
19 North America Fish Pumps Market Outlook, By 4” Pumps (2021-2030) ($MN)
20 North America Fish Pumps Market Outlook, By 6” Pumps (2021-2030) ($MN)
21 North America Fish Pumps Market Outlook, By 8” Pumps (2021-2030) ($MN)
22 North America Fish Pumps Market Outlook, By 10” Pumps (2021-2030) ($MN)
23 North America Fish Pumps Market Outlook, By 12” Pumps (2021-2030) ($MN)
24 North America Fish Pumps Market Outlook, By 14” Pumps (2021-2030) ($MN)
25 North America Fish Pumps Market Outlook, By Application (2021-2030) ($MN)
26 North America Fish Pumps Market Outlook, By Aquaculture (2021-2030) ($MN)
27 North America Fish Pumps Market Outlook, By Fishing (2021-2030) ($MN)
28 North America Fish Pumps Market Outlook, By Mode of Operation (2021-2030) ($MN)
29 North America Fish Pumps Market Outlook, By Manual (2021-2030) ($MN)
30 North America Fish Pumps Market Outlook, By Automatic (2021-2030) ($MN)
31 Europe Fish Pumps Market Outlook, By Country (2021-2030) ($MN)
32 Europe Fish Pumps Market Outlook, By Size (2021-2030) ($MN)
33 Europe Fish Pumps Market Outlook, By 2.5” Pumps (2021-2030) ($MN)
34 Europe Fish Pumps Market Outlook, By 4” Pumps (2021-2030) ($MN)
35 Europe Fish Pumps Market Outlook, By 6” Pumps (2021-2030) ($MN)
36 Europe Fish Pumps Market Outlook, By 8” Pumps (2021-2030) ($MN)
37 Europe Fish Pumps Market Outlook, By 10” Pumps (2021-2030) ($MN)
38 Europe Fish Pumps Market Outlook, By 12” Pumps (2021-2030) ($MN)
39 Europe Fish Pumps Market Outlook, By 14” Pumps (2021-2030) ($MN)
40 Europe Fish Pumps Market Outlook, By Application (2021-2030) ($MN)
41 Europe Fish Pumps Market Outlook, By Aquaculture (2021-2030) ($MN)
42 Europe Fish Pumps Market Outlook, By Fishing (2021-2030) ($MN)
43 Europe Fish Pumps Market Outlook, By Mode of Operation (2021-2030) ($MN)
44 Europe Fish Pumps Market Outlook, By Manual (2021-2030) ($MN)
45 Europe Fish Pumps Market Outlook, By Automatic (2021-2030) ($MN)
46 Asia Pacific Fish Pumps Market Outlook, By Country (2021-2030) ($MN)
47 Asia Pacific Fish Pumps Market Outlook, By Size (2021-2030) ($MN)
48 Asia Pacific Fish Pumps Market Outlook, By 2.5” Pumps (2021-2030) ($MN)
49 Asia Pacific Fish Pumps Market Outlook, By 4” Pumps (2021-2030) ($MN)
50 Asia Pacific Fish Pumps Market Outlook, By 6” Pumps (2021-2030) ($MN)
51 Asia Pacific Fish Pumps Market Outlook, By 8” Pumps (2021-2030) ($MN)
52 Asia Pacific Fish Pumps Market Outlook, By 10” Pumps (2021-2030) ($MN)
53 Asia Pacific Fish Pumps Market Outlook, By 12” Pumps (2021-2030) ($MN)
54 Asia Pacific Fish Pumps Market Outlook, By 14” Pumps (2021-2030) ($MN)
55 Asia Pacific Fish Pumps Market Outlook, By Application (2021-2030) ($MN)
56 Asia Pacific Fish Pumps Market Outlook, By Aquaculture (2021-2030) ($MN)
57 Asia Pacific Fish Pumps Market Outlook, By Fishing (2021-2030) ($MN)
58 Asia Pacific Fish Pumps Market Outlook, By Mode of Operation (2021-2030) ($MN)
59 Asia Pacific Fish Pumps Market Outlook, By Manual (2021-2030) ($MN)
60 Asia Pacific Fish Pumps Market Outlook, By Automatic (2021-2030) ($MN)
61 South America Fish Pumps Market Outlook, By Country (2021-2030) ($MN)
62 South America Fish Pumps Market Outlook, By Size (2021-2030) ($MN)
63 South America Fish Pumps Market Outlook, By 2.5” Pumps (2021-2030) ($MN)
64 South America Fish Pumps Market Outlook, By 4” Pumps (2021-2030) ($MN)
65 South America Fish Pumps Market Outlook, By 6” Pumps (2021-2030) ($MN)
66 South America Fish Pumps Market Outlook, By 8” Pumps (2021-2030) ($MN)
67 South America Fish Pumps Market Outlook, By 10” Pumps (2021-2030) ($MN)
68 South America Fish Pumps Market Outlook, By 12” Pumps (2021-2030) ($MN)
69 South America Fish Pumps Market Outlook, By 14” Pumps (2021-2030) ($MN)
70 South America Fish Pumps Market Outlook, By Application (2021-2030) ($MN)
71 South America Fish Pumps Market Outlook, By Aquaculture (2021-2030) ($MN)
72 South America Fish Pumps Market Outlook, By Fishing (2021-2030) ($MN)
73 South America Fish Pumps Market Outlook, By Mode of Operation (2021-2030) ($MN)
74 South America Fish Pumps Market Outlook, By Manual (2021-2030) ($MN)
75 South America Fish Pumps Market Outlook, By Automatic (2021-2030) ($MN)
76 Middle East & Africa Fish Pumps Market Outlook, By Country (2021-2030) ($MN)
77 Middle East & Africa Fish Pumps Market Outlook, By Size (2021-2030) ($MN)
78 Middle East & Africa Fish Pumps Market Outlook, By 2.5” Pumps (2021-2030) ($MN)
79 Middle East & Africa Fish Pumps Market Outlook, By 4” Pumps (2021-2030) ($MN)
80 Middle East & Africa Fish Pumps Market Outlook, By 6” Pumps (2021-2030) ($MN)
81 Middle East & Africa Fish Pumps Market Outlook, By 8” Pumps (2021-2030) ($MN)
82 Middle East & Africa Fish Pumps Market Outlook, By 10” Pumps (2021-2030) ($MN)
83 Middle East & Africa Fish Pumps Market Outlook, By 12” Pumps (2021-2030) ($MN)
84 Middle East & Africa Fish Pumps Market Outlook, By 14” Pumps (2021-2030) ($MN)
85 Middle East & Africa Fish Pumps Market Outlook, By Application (2021-2030) ($MN)
86 Middle East & Africa Fish Pumps Market Outlook, By Aquaculture (2021-2030) ($MN)
87 Middle East & Africa Fish Pumps Market Outlook, By Fishing (2021-2030) ($MN)
88 Middle East & Africa Fish Pumps Market Outlook, By Mode of Operation (2021-2030) ($MN)
89 Middle East & Africa Fish Pumps Market Outlook, By Manual (2021-2030) ($MN)
90 Middle East & Africa Fish Pumps Market Outlook, By Automatic (2021-2030) ($MN)
List of Figures
RESEARCH METHODOLOGY

We at ‘Stratistics’ opt for an extensive research approach which involves data mining, data validation, and data analysis. The various research sources include in-house repository, secondary research, competitor’s sources, social media research, client internal data, and primary research.
Our team of analysts prefers the most reliable and authenticated data sources in order to perform the comprehensive literature search. With access to most of the authenticated data bases our team highly considers the best mix of information through various sources to obtain extensive and accurate analysis.
Each report takes an average time of a month and a team of 4 industry analysts. The time may vary depending on the scope and data availability of the desired market report. The various parameters used in the market assessment are standardized in order to enhance the data accuracy.
Data Mining
The data is collected from several authenticated, reliable, paid and unpaid sources and is filtered depending on the scope & objective of the research. Our reports repository acts as an added advantage in this procedure. Data gathering from the raw material suppliers, distributors and the manufacturers is performed on a regular basis, this helps in the comprehensive understanding of the products value chain. Apart from the above mentioned sources the data is also collected from the industry consultants to ensure the objective of the study is in the right direction.
Market trends such as technological advancements, regulatory affairs, market dynamics (Drivers, Restraints, Opportunities and Challenges) are obtained from scientific journals, market related national & international associations and organizations.
Data Analysis
From the data that is collected depending on the scope & objective of the research the data is subjected for the analysis. The critical steps that we follow for the data analysis include:
- Product Lifecycle Analysis
- Competitor analysis
- Risk analysis
- Porters Analysis
- PESTEL Analysis
- SWOT Analysis
The data engineering is performed by the core industry experts considering both the Marketing Mix Modeling and the Demand Forecasting. The marketing mix modeling makes use of multiple-regression techniques to predict the optimal mix of marketing variables. Regression factor is based on a number of variables and how they relate to an outcome such as sales or profits.
Data Validation
The data validation is performed by the exhaustive primary research from the expert interviews. This includes telephonic interviews, focus groups, face to face interviews, and questionnaires to validate our research from all aspects. The industry experts we approach come from the leading firms, involved in the supply chain ranging from the suppliers, distributors to the manufacturers and consumers so as to ensure an unbiased analysis.
We are in touch with more than 15,000 industry experts with the right mix of consultants, CEO's, presidents, vice presidents, managers, experts from both supply side and demand side, executives and so on.
The data validation involves the primary research from the industry experts belonging to:
- Leading Companies
- Suppliers & Distributors
- Manufacturers
- Consumers
- Industry/Strategic Consultants
Apart from the data validation the primary research also helps in performing the fill gap research, i.e. providing solutions for the unmet needs of the research which helps in enhancing the reports quality.
For more details about research methodology, kindly write to us at info@strategymrc.com
Frequently Asked Questions
In case of any queries regarding this report, you can contact the customer service by filing the “Inquiry Before Buy” form available on the right hand side. You may also contact us through email: info@strategymrc.com or phone: +1-301-202-5929
Yes, the samples are available for all the published reports. You can request them by filling the “Request Sample” option available in this page.
Yes, you can request a sample with your specific requirements. All the customized samples will be provided as per the requirement with the real data masked.
All our reports are available in Digital PDF format. In case if you require them in any other formats, such as PPT, Excel etc you can submit a request through “Inquiry Before Buy” form available on the right hand side. You may also contact us through email: info@strategymrc.com or phone: +1-301-202-5929
We offer a free 15% customization with every purchase. This requirement can be fulfilled for both pre and post sale. You may send your customization requirements through email at info@strategymrc.com or call us on +1-301-202-5929.
We have 3 different licensing options available in electronic format.
- Single User Licence: Allows one person, typically the buyer, to have access to the ordered product. The ordered product cannot be distributed to anyone else.
- 2-5 User Licence: Allows the ordered product to be shared among a maximum of 5 people within your organisation.
- Corporate License: Allows the product to be shared among all employees of your organisation regardless of their geographical location.
All our reports are typically be emailed to you as an attachment.
To order any available report you need to register on our website. The payment can be made either through CCAvenue or PayPal payments gateways which accept all international cards.
We extend our support to 6 months post sale. A post sale customization is also provided to cover your unmet needs in the report.
Request Customization
We offer complimentary customization of up to 15% with every purchase. To share your customization requirements, feel free to email us at info@strategymrc.com or call us on +1-301-202-5929. .
Please Note: Customization within the 15% threshold is entirely free of charge. If your request exceeds this limit, we will conduct a feasibility assessment. Following that, a detailed quote and timeline will be provided.
WHY CHOOSE US ?

Assured Quality
Best in class reports with high standard of research integrity

24X7 Research Support
Continuous support to ensure the best customer experience.

Free Customization
Adding more values to your product of interest.

Safe & Secure Access
Providing a secured environment for all online transactions.

Trusted by 600+ Brands
Serving the most reputed brands across the world.