
Flywheel Energy Storage Market
Flywheel Energy Storage Market Forecasts to 2034 – Global Analysis By Rotor Material (Composite Rotor and Steel Rotor), Power Rating, Application, End User, and By Geography

Market Dynamics:
Driver:
Frequent power disturbances increase the value of durable cycling
Industrial processes, digital infrastructure, and electricity networks require equipment that can respond repeatedly to short power imbalances without losing availability between events. Flywheels can absorb and release energy through a reversible mechanical process, making them well suited to applications with frequent cycling and high power relative to stored energy. In a factory, this can support sensitive machinery through brief disturbances; in a grid application, it can provide rapid balancing. Buyers assess the avoided cost of interrupted operations alongside equipment life and maintenance. Where repeated power events dominate the duty cycle, this operational fit strengthens demand for kinetic storage solutions.
Restraint:
Standby losses and containment requirements narrow the economic fit
A rotating energy store requires careful management of friction, electrical losses, bearings, and the surrounding environment. Even efficient systems lose stored energy while standing by, which can weaken the economics of applications that require long idle periods followed by extended discharge. Rotor containment, foundations, and service access also influence installation cost and site suitability. Customers must compare complete system performance rather than nominal power ratings alone. Because benefits depend strongly on the pattern of disturbances and cycling, an installation with infrequent outages may favor a different storage technology. This application sensitivity constrains broad substitution across the wider energy-storage market.
Opportunity:
Hybrid systems separate rapid power support from longer backup
Combining a flywheel with a battery or generator allows each asset to address the operating conditions for which it is best suited. The flywheel can handle rapid transitions and repetitive power pulses, while another source supplies energy over a longer period. Such coordination creates opportunities in microgrids, charging sites, and facilities with sensitive equipment. Vendors can differentiate through controls that allocate duties, verify readiness, and simplify commissioning. Containerized configurations also offer a route to reduce site work and make deployment more repeatable. The commercial opportunity lies in measurable system performance and maintenance savings rather than treating every storage function as interchangeable.
Threat:
Battery improvements and limited supplier scale pressure adoption
Battery suppliers continue to improve power capability, packaging, and monitoring while benefiting from extensive production scale and broad customer familiarity. These advances can make a battery-based solution attractive even where a flywheel offers a technical advantage for repeated short events. Smaller flywheel vendors may also face challenges funding product development, supporting geographically dispersed equipment, or maintaining replacement-component availability. Buyers responsible for critical infrastructure evaluate these service risks alongside performance. If suppliers cannot provide credible warranties, independent validation, and long-term support, customers may select a more familiar alternative despite a potentially favorable kinetic-storage duty cycle.
Covid-19 Impact:
Pandemic restrictions complicated the manufacture, delivery, and commissioning of flywheel systems, especially where installation depended on specialized personnel and access to critical facilities. Some industrial customers postponed capital projects as operating priorities changed, while digital infrastructure continued to require dependable backup and power quality. Remote monitoring and condition assessment became more valuable when routine site access was limited. The recovery subsequently renewed opportunities in resilient facilities and distributed power systems. However, suppliers still needed to demonstrate an application-specific business case, because the pandemic did not remove differences between the economics of short power support and longer-duration energy storage.
The Uninterruptible Power Supply (UPS) segment is expected to be the largest during the forecast period
The Uninterruptible Power Supply (UPS) segment is expected to be the largest because flywheels can bridge short interruptions and provide support during the transition to standby generation. This role aligns with facilities that prioritize continuity and repeatedly test their emergency power arrangements. Integrated UPS designs also give customers an established route to procurement, service, and performance verification. The segment includes uses where reducing battery replacement activity or managing constrained equipment space has practical value. Its projected lead rests on this defined operational role and existing supplier expertise, with the required ride-through time and complete power architecture determining suitability for each installation.
The Data Centers segment is expected to have the highest CAGR during the forecast period
The Data Centers segment is expected to exhibit the highest CAGR as expanding computing infrastructure increases attention to rapid power support, equipment density, and dependable transitions between energy sources. Flywheels can address short disturbances within a broader backup architecture and can be evaluated alongside the facility's generator strategy, maintenance practices, and electrical layout. New construction offers opportunities to integrate these arrangements without the constraints of retrofitting an operating site. Growth will favor systems with clear performance guarantees and service capacity. The outlook reflects increased demand for specialized power-management options as data center operators manage more demanding and variable electrical loads.
Region with largest share:
North America is anticipated to retain the largest share, supported by a broad base of critical computing, industrial facilities, and grid-service opportunities. Suppliers can address customers that place a high financial value on avoiding even brief interruptions and that already procure sophisticated power-protection systems. Utility programs for distributed flexibility provide another route to commercial deployment when flywheels are integrated with complementary storage and controls. The region's expected leading position is linked to these high-value applications and established technical expertise. Procurement will continue to depend on operating evidence, lifecycle cost, and the ability to service equipment throughout its intended life.
Region with highest CAGR:
Asia Pacific is projected to achieve the highest CAGR as expanding digital infrastructure, electrified transport, and industrial automation create additional demand for short-duration power support. The region also offers opportunities to pair kinetic storage with renewable generation in electricity systems undergoing significant change. Collaboration between equipment manufacturers and flywheel specialists can help adapt systems to local grid requirements and operating conditions. Japan's engineering base and emerging production and demonstration networks elsewhere in the region support this prospect. Growth is expected to remain selective, concentrating on projects where frequent cycling, power quality, or constrained connections make flywheel integration commercially persuasive.
Key players in the market
Some of the key players in the Flywheel Energy Storage Market include Beacon Power, LLC, Amber Kinetics, Inc., Piller Power Systems (Langley Holdings plc), Calnetix Technologies, LLC, VYCON, Inc., Stornetic GmbH, Energiestro SAS, Adaptive Balancing Power GmbH, Oxto Energy Ltd., Revterra Corporation, Active Power, Inc., Torus Inc., Schwungrad Energie Limited, Levistor Limited, and POWERTHRU.
Key Developments:
In August 2025, Amber Kinetics reported that it had commissioned its first above-ground containerized flywheel system in the United States with Indian Energy. The company also reported UL Field Certification for the installed unit, marking progress toward a deployment format that reduces dependence on buried installations.
In May 2025, Kawasaki Heavy Industries and Amber Kinetics signed an agreement extending their collaboration on virtual synchronous generator technology and flywheel storage. Announced by Amber Kinetics in July, the initiative follows testing and demonstration and aims to support grid stability as renewable generation expands.
In March 2025, Torus announced approval for its commercial energy-storage systems under Rocky Mountain Power's Wattsmart Battery Program. The approved platform includes the company's Nova technologies, with flywheel storage forming part of its wider power-management offering; the approval provides a route for commercial customers to participate in a utility flexibility program.
Rotor Materials Covered:
• Composite Rotor
• Steel Rotor
Power Ratings Covered:
• Below 100 kW
• 100 kW to 1 MW
• Above 1 MW
Applications Covered:
• Frequency Regulation and Grid Services
• Uninterruptible Power Supply (UPS)
• Data Centers
• Renewable Energy Integration
• Transportation and Rail
• Industrial Power Quality
End Users Covered:
• Utilities
• Data Centers and Telecommunications
• Transportation
• Industrial
• Commercial and Institutional
Regions Covered:
• North America
o United States
o Canada
o Mexico
• Europe
o United Kingdom
o Germany
o France
o Italy
o Spain
o Netherlands
o Belgium
o Sweden
o Switzerland
o Poland
o Rest of Europe
• Asia Pacific
o China
o Japan
o India
o South Korea
o Australia
o Indonesia
o Thailand
o Malaysia
o Singapore
o Vietnam
o Rest of Asia Pacific
• South America
o Brazil
o Argentina
o Colombia
o Chile
o Peru
o Rest of South America
• Rest of the World (RoW)
o Middle East
Saudi Arabia
United Arab Emirates
Qatar
Israel
Rest of Middle East
o Africa
South Africa
Egypt
Morocco
Rest of Africa
What our report offers:
- Market share assessments for the regional and country-level segments
- Strategic recommendations for new entrants
- Market data for the years 2023, 2024, 2025, 2026, 2027, 2028, 2030, 2032 and 2034
- Market trends covering Drivers, Constraints, Opportunities, Threats, Challenges, Investment Opportunities, and recommendations
- Strategic recommendations in key business segments based on market estimations
- Competitive landscaping mapping key common trends
- Company profiling with detailed strategies, financials, and recent developments
- Supply chain trends mapping the latest technological advancements
Free Customization Offerings:
All the customers of this report will be entitled to receive one of the following free customization options:
• Company Profiling
o Comprehensive profiling of additional market players (up to 3)
o SWOT Analysis of key players (up to 3)
• Regional Segmentation
o Market estimations, Forecasts and CAGR of any prominent country as per the client's interest (Note: Depends on feasibility check)
• Competitive Benchmarking
o Benchmarking of key players based on product portfolio, geographical presence, and strategic alliances
Table of Contents
1 Executive Summary1.1 Market Snapshot and Key Highlights
1.2 Growth Drivers, Challenges, and Opportunities
1.3 Competitive Landscape Overview
1.4 Strategic Insights and Recommendations
2 Research Framework
2.1 Study Objectives and Scope
2.2 Stakeholder Analysis
2.3 Research Assumptions and Limitations
2.4 Research Methodology
2.4.1 Data Collection (Primary and Secondary)
2.4.2 Data Modeling and Estimation Techniques
2.4.3 Data Validation and Triangulation
2.4.4 Analytical and Forecasting Approach
3 Market Dynamics and Trend Analysis
3.1 Market Definition and Structure
3.2 Key Market Drivers
3.3 Market Restraints and Challenges
3.4 Growth Opportunities and Investment Hotspots
3.5 Industry Threats and Risk Assessment
3.6 Technology and Innovation Landscape
3.7 Emerging and High-Growth Markets
3.8 Regulatory and Policy Environment
3.9 Impact of COVID-19 and Recovery Outlook
4 Competitive and Strategic Assessment
4.1 Porter's Five Forces Analysis
4.1.1 Supplier Bargaining Power
4.1.2 Buyer Bargaining Power
4.1.3 Threat of Substitutes
4.1.4 Threat of New Entrants
4.1.5 Competitive Rivalry
4.2 Market Share Analysis of Key Players
4.3 Product Benchmarking and Performance Comparison
5 Global Flywheel Energy Storage Market, By Rotor Material
5.1 Composite Rotor
5.2 Steel Rotor
6 Global Flywheel Energy Storage Market, By Power Rating
6.1 Below 100 kW
6.2 100 kW to 1 MW
6.3 Above 1 MW
7 Global Flywheel Energy Storage Market, By Application
7.1 Frequency Regulation and Grid Services
7.2 Uninterruptible Power Supply (UPS)
7.3 Data Centers
7.4 Renewable Energy Integration
7.5 Transportation and Rail
7.6 Industrial Power Quality
8 Global Flywheel Energy Storage Market, By End User
8.1 Utilities
8.2 Data Centers and Telecommunications
8.3 Transportation
8.4 Industrial
8.5 Commercial and Institutional
9 Global Flywheel Energy Storage Market, By Geography
9.1 North America
9.1.1 United States
9.1.2 Canada
9.1.3 Mexico
9.2 Europe
9.2.1 United Kingdom
9.2.2 Germany
9.2.3 France
9.2.4 Italy
9.2.5 Spain
9.2.6 Netherlands
9.2.7 Belgium
9.2.8 Sweden
9.2.9 Switzerland
9.2.10 Poland
9.2.11 Rest of Europe
9.3 Asia Pacific
9.3.1 China
9.3.2 Japan
9.3.3 India
9.3.4 South Korea
9.3.5 Australia
9.3.6 Indonesia
9.3.7 Thailand
9.3.8 Malaysia
9.3.9 Singapore
9.3.10 Vietnam
9.3.11 Rest of Asia Pacific
9.4 South America
9.4.1 Brazil
9.4.2 Argentina
9.4.3 Colombia
9.4.4 Chile
9.4.5 Peru
9.4.6 Rest of South America
9.5 Rest of the World (RoW)
9.5.1 Middle East
9.5.1.1 Saudi Arabia
9.5.1.2 United Arab Emirates
9.5.1.3 Qatar
9.5.1.4 Israel
9.5.1.5 Rest of Middle East
9.5.2 Africa
9.5.2.1 South Africa
9.5.2.2 Egypt
9.5.2.3 Morocco
9.5.2.4 Rest of Africa
10 Strategic Market Intelligence
10.1 Industry Value Network and Supply Chain Assessment
10.2 White-Space and Opportunity Mapping
10.3 Product Evolution and Market Life Cycle Analysis
10.4 Channel, Distributor, and Go-to-Market Assessment
11 Industry Developments and Strategic Initiatives
11.1 Mergers and Acquisitions
11.2 Partnerships, Alliances, and Joint Ventures
11.3 New Product Launches and Certifications
11.4 Capacity Expansion and Investments
11.5 Other Strategic Initiatives
12 Company Profiles
12.1 Beacon Power, LLC
12.2 Amber Kinetics, Inc.
12.3 Piller Power Systems (Langley Holdings plc)
12.4 Calnetix Technologies, LLC
12.5 VYCON, Inc.
12.6 Stornetic GmbH
12.7 Energiestro SAS
12.8 Adaptive Balancing Power GmbH
12.9 Oxto Energy Ltd.
12.10 Revterra Corporation
12.11 Active Power, Inc.
12.12 Torus Inc.
12.13 Schwungrad Energie Limited
12.14 Levistor Limited
12.15 POWERTHRU
List of Tables
1 Global Flywheel Energy Storage Market Outlook, By Region (2023–2034) ($MN)
2 Global Flywheel Energy Storage Market Outlook, By Rotor Material (2023–2034) ($MN)
3 Global Flywheel Energy Storage Market Outlook, By Composite Rotor (2023–2034) ($MN)
4 Global Flywheel Energy Storage Market Outlook, By Steel Rotor (2023–2034) ($MN)
5 Global Flywheel Energy Storage Market Outlook, By Power Rating (2023–2034) ($MN)
6 Global Flywheel Energy Storage Market Outlook, By Below 100 kW (2023–2034) ($MN)
7 Global Flywheel Energy Storage Market Outlook, By 100 kW to 1 MW (2023–2034) ($MN)
8 Global Flywheel Energy Storage Market Outlook, By Above 1 MW (2023–2034) ($MN)
9 Global Flywheel Energy Storage Market Outlook, By Application (2023–2034) ($MN)
10 Global Flywheel Energy Storage Market Outlook, By Frequency Regulation and Grid Services (2023–2034) ($MN)
11 Global Flywheel Energy Storage Market Outlook, By Uninterruptible Power Supply (UPS) (2023–2034) ($MN)
12 Global Flywheel Energy Storage Market Outlook, By Data Centers (2023–2034) ($MN)
13 Global Flywheel Energy Storage Market Outlook, By Renewable Energy Integration (2023–2034) ($MN)
14 Global Flywheel Energy Storage Market Outlook, By Transportation and Rail (2023–2034) ($MN)
15 Global Flywheel Energy Storage Market Outlook, By Industrial Power Quality (2023–2034) ($MN)
16 Global Flywheel Energy Storage Market Outlook, By End User (2023–2034) ($MN)
17 Global Flywheel Energy Storage Market Outlook, By Utilities (2023–2034) ($MN)
18 Global Flywheel Energy Storage Market Outlook, By Data Centers and Telecommunications (2023–2034) ($MN)
19 Global Flywheel Energy Storage Market Outlook, By Transportation (2023–2034) ($MN)
20 Global Flywheel Energy Storage Market Outlook, By Industrial (2023–2034) ($MN)
21 Global Flywheel Energy Storage Market Outlook, By Commercial and Institutional (2023–2034) ($MN)
Note: Tables for North America, Europe, APAC, South America, and Rest of the World (RoW) Regions are also represented in the same manner as above.
List of Figures
RESEARCH METHODOLOGY
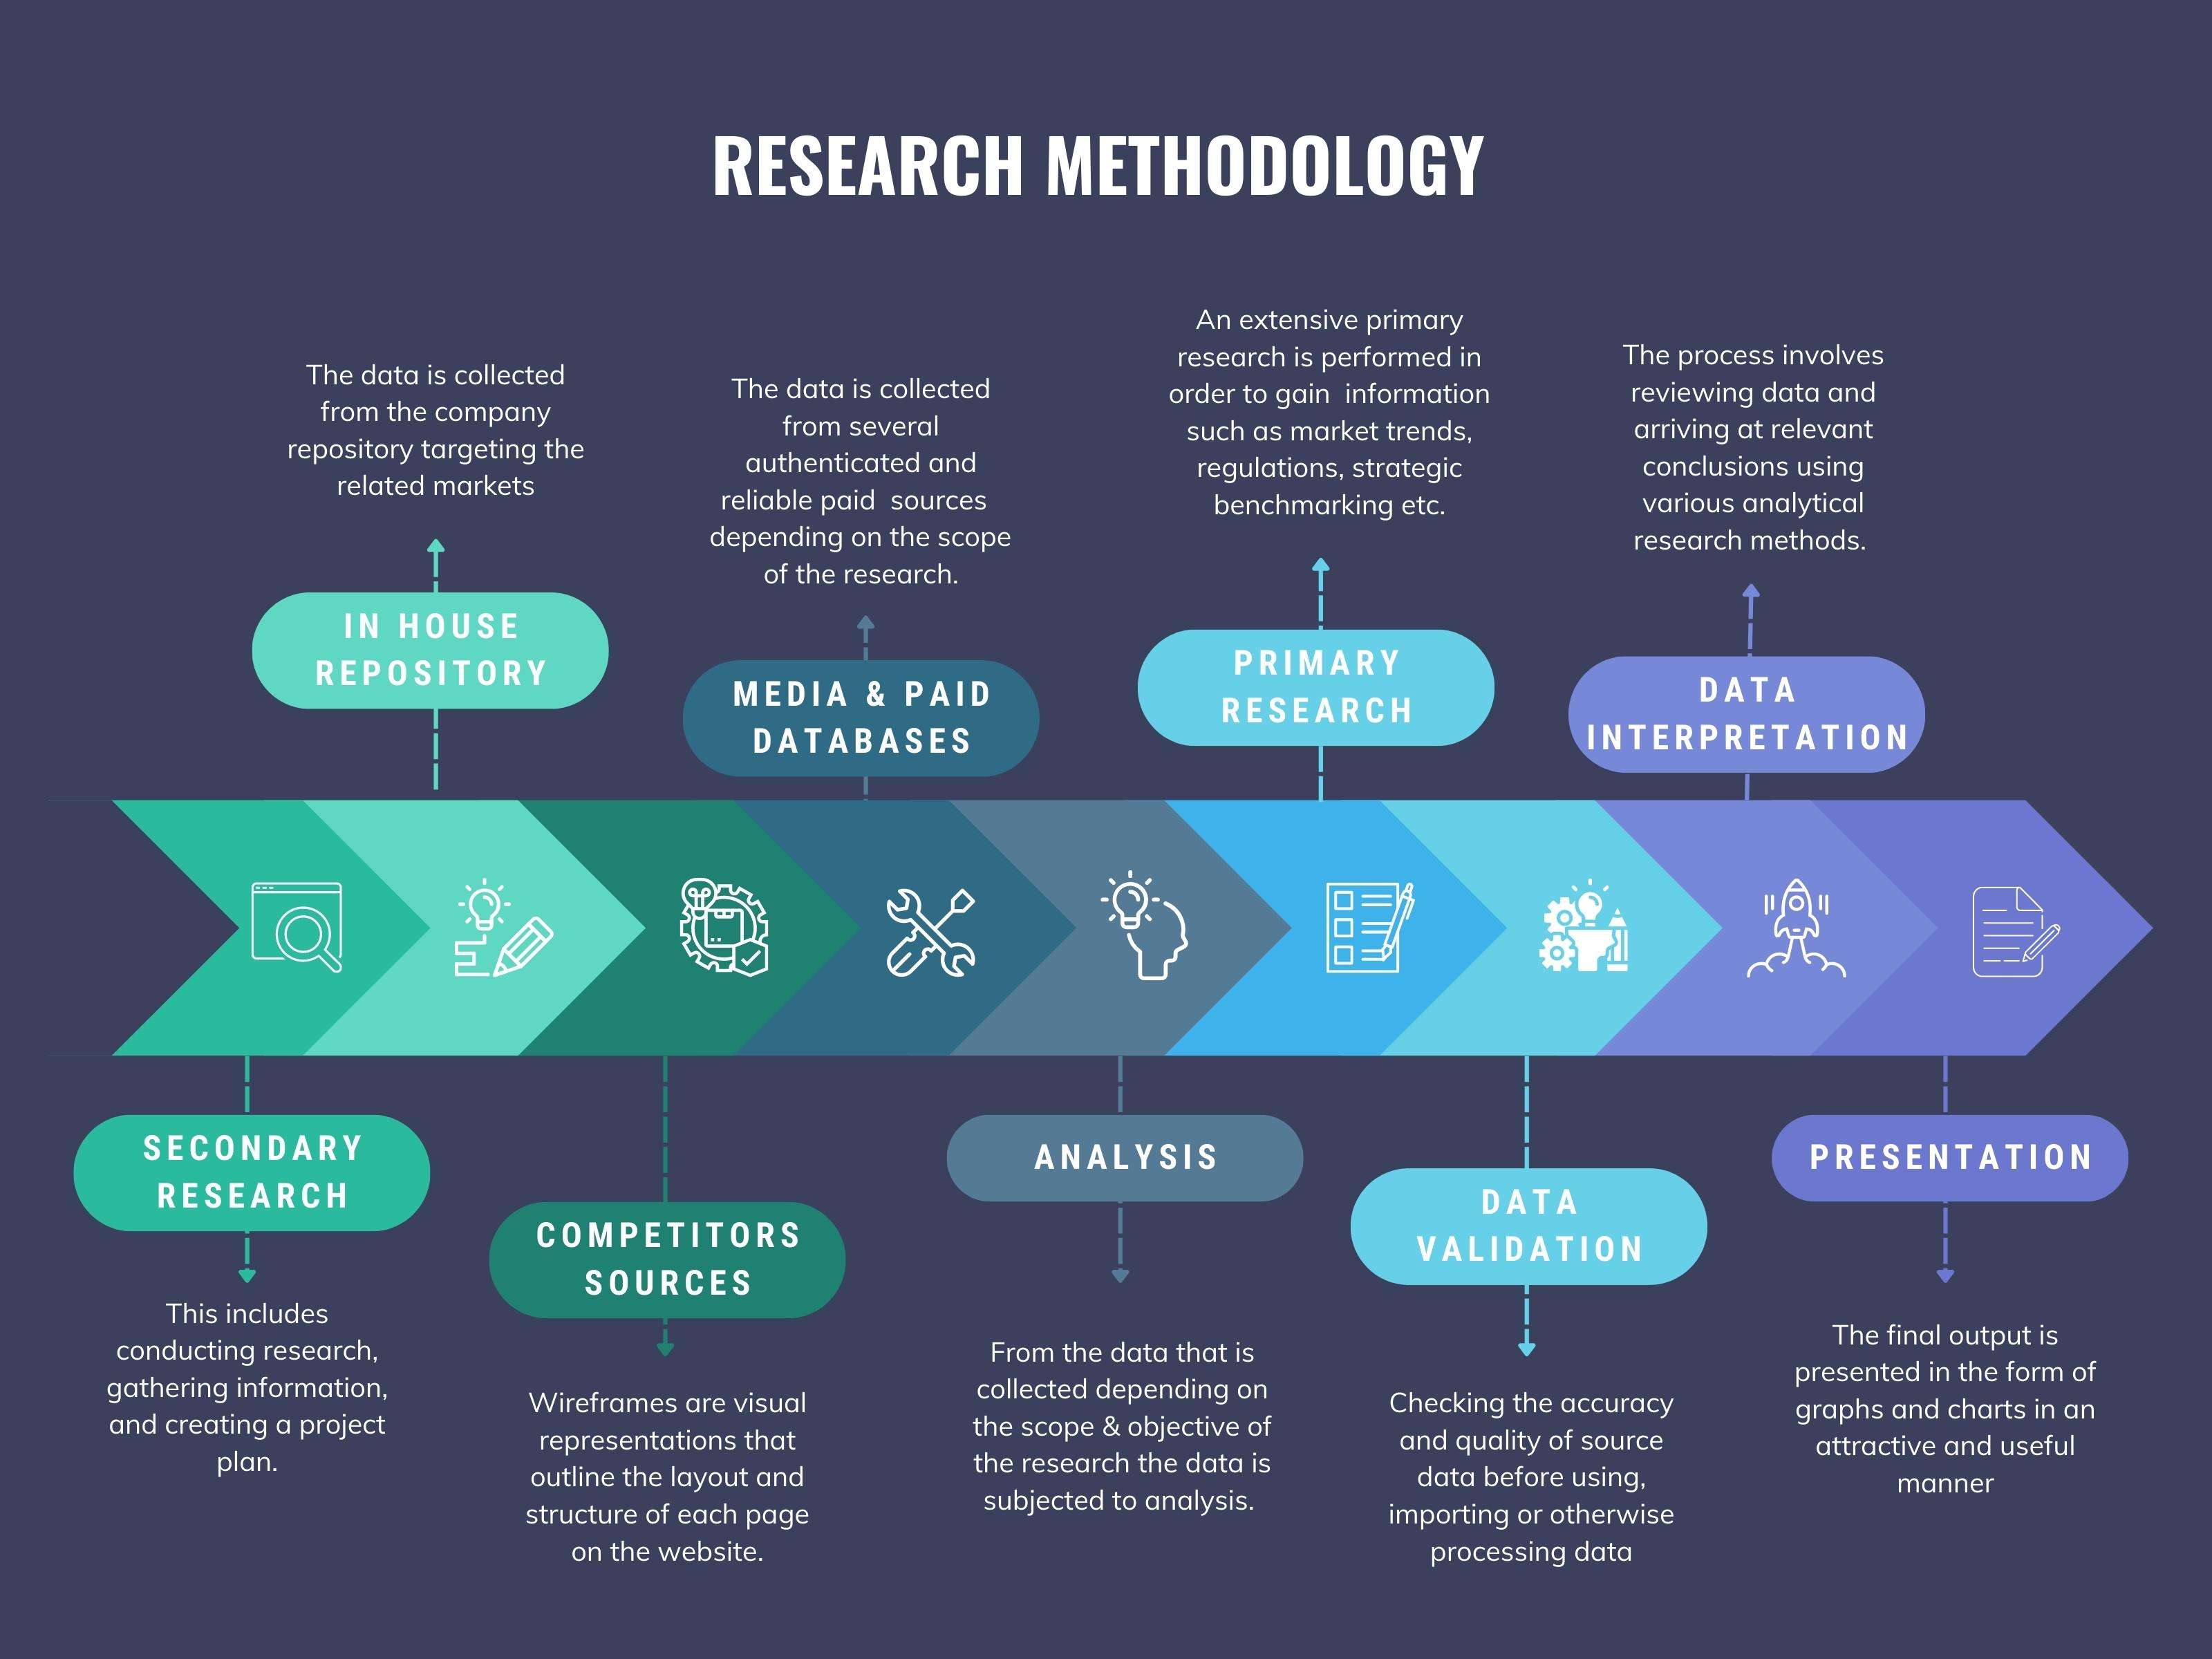
We at ‘Stratistics’ opt for an extensive research approach which involves data mining, data validation, and data analysis. The various research sources include in-house repository, secondary research, competitor’s sources, social media research, client internal data, and primary research.
Our team of analysts prefers the most reliable and authenticated data sources in order to perform the comprehensive literature search. With access to most of the authenticated data bases our team highly considers the best mix of information through various sources to obtain extensive and accurate analysis.
Each report takes an average time of a month and a team of 4 industry analysts. The time may vary depending on the scope and data availability of the desired market report. The various parameters used in the market assessment are standardized in order to enhance the data accuracy.
Data Mining
The data is collected from several authenticated, reliable, paid and unpaid sources and is filtered depending on the scope & objective of the research. Our reports repository acts as an added advantage in this procedure. Data gathering from the raw material suppliers, distributors and the manufacturers is performed on a regular basis, this helps in the comprehensive understanding of the products value chain. Apart from the above mentioned sources the data is also collected from the industry consultants to ensure the objective of the study is in the right direction.
Market trends such as technological advancements, regulatory affairs, market dynamics (Drivers, Restraints, Opportunities and Challenges) are obtained from scientific journals, market related national & international associations and organizations.
Data Analysis
From the data that is collected depending on the scope & objective of the research the data is subjected for the analysis. The critical steps that we follow for the data analysis include:
- Product Lifecycle Analysis
- Competitor analysis
- Risk analysis
- Porters Analysis
- PESTEL Analysis
- SWOT Analysis
The data engineering is performed by the core industry experts considering both the Marketing Mix Modeling and the Demand Forecasting. The marketing mix modeling makes use of multiple-regression techniques to predict the optimal mix of marketing variables. Regression factor is based on a number of variables and how they relate to an outcome such as sales or profits.
Data Validation
The data validation is performed by the exhaustive primary research from the expert interviews. This includes telephonic interviews, focus groups, face to face interviews, and questionnaires to validate our research from all aspects. The industry experts we approach come from the leading firms, involved in the supply chain ranging from the suppliers, distributors to the manufacturers and consumers so as to ensure an unbiased analysis.
We are in touch with more than 15,000 industry experts with the right mix of consultants, CEO's, presidents, vice presidents, managers, experts from both supply side and demand side, executives and so on.
The data validation involves the primary research from the industry experts belonging to:
- Leading Companies
- Suppliers & Distributors
- Manufacturers
- Consumers
- Industry/Strategic Consultants
Apart from the data validation the primary research also helps in performing the fill gap research, i.e. providing solutions for the unmet needs of the research which helps in enhancing the reports quality.
For more details about research methodology, kindly write to us at info@strategymrc.com
Frequently Asked Questions
In case of any queries regarding this report, you can contact the customer service by filing the “Inquiry Before Buy” form available on the right hand side. You may also contact us through email: info@strategymrc.com or phone: +1-301-202-5929
Yes, the samples are available for all the published reports. You can request them by filling the “Request Sample” option available in this page.
Yes, you can request a sample with your specific requirements. All the customized samples will be provided as per the requirement with the real data masked.
All our reports are available in Digital PDF format. In case if you require them in any other formats, such as PPT, Excel etc you can submit a request through “Inquiry Before Buy” form available on the right hand side. You may also contact us through email: info@strategymrc.com or phone: +1-301-202-5929
We offer a free 15% customization with every purchase. This requirement can be fulfilled for both pre and post sale. You may send your customization requirements through email at info@strategymrc.com or call us on +1-301-202-5929.
We have 3 different licensing options available in electronic format.
- Single User Licence: Allows one person, typically the buyer, to have access to the ordered product. The ordered product cannot be distributed to anyone else.
- 2-5 User Licence: Allows the ordered product to be shared among a maximum of 5 people within your organisation.
- Corporate License: Allows the product to be shared among all employees of your organisation regardless of their geographical location.
All our reports are typically be emailed to you as an attachment.
To order any available report you need to register on our website. The payment can be made either through CCAvenue or PayPal payments gateways which accept all international cards.
We extend our support to 6 months post sale. A post sale customization is also provided to cover your unmet needs in the report.
Request Customization
We offer complimentary customization of up to 15% with every purchase. To share your customization requirements, feel free to email us at info@strategymrc.com or call us on +1-301-202-5929. .
Please Note: Customization within the 15% threshold is entirely free of charge. If your request exceeds this limit, we will conduct a feasibility assessment. Following that, a detailed quote and timeline will be provided.
WHY CHOOSE US ?

Assured Quality
Best in class reports with high standard of research integrity

24X7 Research Support
Continuous support to ensure the best customer experience.

Free Customization
Adding more values to your product of interest.

Safe & Secure Access
Providing a secured environment for all online transactions.

Trusted by 600+ Brands
Serving the most reputed brands across the world.