
Industrial Lubricants Market
Industrial Lubricants Market Forecasts to 2028 – Global Analysis By Product (Compressor Oil, Engine Oil, Gear Oil, General Industrial Oil), Base Oil (Mineral Oil, Synthetic Oil, Bio-Based Oil) and By Geography

|
Years Covered |
2020-2028 |
|
Estimated Year Value (2021) |
US $69.36 BN |
|
Projected Year Value (2028) |
US $98.26 BN |
|
CAGR (2021 - 2028) |
5.1% |
|
Regions Covered |
North America, Europe, Asia Pacific, South America, and Middle East & Africa |
|
Countries Covered |
US, Canada, Mexico, Germany, UK, Italy, France, Spain, Japan, China, India, Australia, New Zealand, South Korea, Rest of Asia Pacific, South America, Argentina, Brazil, Chile, Middle East & Africa, Saudi Arabia, UAE, Qatar, and South Africa |
|
Largest Market |
Asia Pacific |
|
Fastest Growing Market |
Europe |
According to Stratistics MRC, the Global Industrial Lubricants Market is accounted for $69.36 billion in 2021 and is expected to reach $98.26 billion by 2028 growing at a CAGR of 5.1% during the forecast period. Lubricants are a vital part that is important for the smooth functioning of numerous segments of machines in many industry verticals. They are mainly defined as compounds like oils, greases, and fluids. Their main function is to avoid metal-to-metal contact in dyes and finished component tooling. Industrial lubricants are likely to cool parts, reduce friction, disperse contaminants, minimize wear, prevent corrosion, transmit power and act as a sealant.
Market Dynamics:
Driver:
Increase demand in construction industry
The construction sector is the foremost consumer of industrial lubricants. The increasing infrastructural development in developing economies is projected to fuel the industrial lubricants sales. Hydraulic fluid is the main product type used in the construction industry in the lubrication of heavy load equipment, as it is relative cheaper compared to other lubricants.
Restraint:
High cost
Industrial Lubrication is additional and can be an important cost in the maintenance of machinery. Depending on the size and function of the machinery requiring lubrication, lubricants itself is a maintenance chore that comes with costs and some skill requirement, which means a factory will need to hire and train the appropriate personnel to do the job properly, on top of paying for the lubricants themselves. These are some of the factors that restrain the market growth.
Opportunity:
Increasing demand for biodegradable lubricants and growing automation
With automated lubrication, the right amount of lubricant at right time is used, especially when the parts need it. Besides, it solved the safety issue, which has been raised frequently regarding the safety of workers lubricating the equipment, as many machines are dangerous to lubricate while running. Biodegradable lubricants possess good properties, which include higher flash points, lower volatility, better viscosity indexes, and better boundary lubricant properties, compared with petroleum lubricants. The implementation of biodegradable lubricants conserves the mineral oil-based sources as they are non-renewable and are getting drained rapidly.
Threat:
Stringent environmental regulations
The majority of industrial lubricants are by-products of petrochemicals, disposal of which leads to water pollution. Synthetic lubricants are the foremost hazard to the atmosphere; as such administrations in numerous nations are daunting prohibitions on their usage. Furthermore, the decline in automotive production in countries such as the US, and China is likely to affect the demand growth of the market shortly.
Bio-Based Oil segment is expected to be the largest during the forecast period
The Bio-Based Oil segment is expected to be the largest during the forecast period, as it provides environmental advantages, coupled with better lubrication, superior viscosity/pressure performance, and lower volatility. Biodegradable sources such as edible oils are used to manufacture bio-based oil. Additionally, rising fuel economy, as well as emission regulations for synthetic lubricants across the world, are projected to bolster bio-based oil demand.
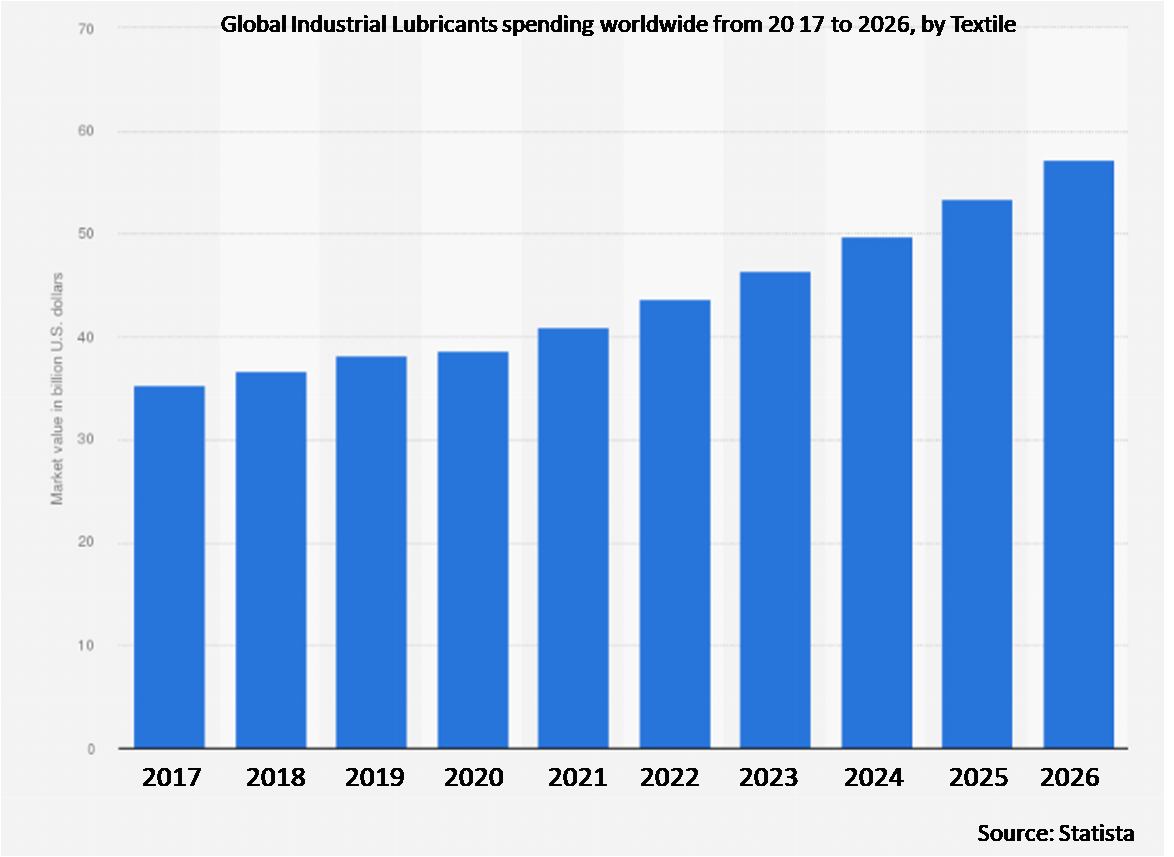
The Process Oil segment is expected to have the highest CAGR during the forecast period
Process oil dominated the market in the product segment and is predictable to grow over the forecast period due to its growing demand from the textile business. The expansion in rubber oil application for the manufacturing of tubes, belting, and hoses will further contribute to its major market share over the coming years.
Region with highest share:
The Asia Pacific is projected to hold the highest market share, due to the demand from end-use industries across emerging economies such as Indonesia, India, Malaysia, and Thailand. Foremost manufacturing firms are concentrating on achieving higher efficiency and lower downtime, which can be obtained through industrial lubricants, and therefore it acts as a key driver for rising market demand in the province.
Region with highest CAGR:
Europe is projected to have the highest CAGR. Chemical manufacturing in Europe is growing due to the existence of numerous players and the increasing demand for chemicals from the personal care industry in the province. This is likely to have a positive impact on the demand for industrial lubricants in Europe over the forecast period. Growing manufacturing in countries such as Argentina, Brazil, and Mexico is anticipated to complement market growth.

Key players in the market:
Some of the key players profiled in the Industrial Lubricants Market include Amsoil, Inc., BASF SE, Bel-Ray Co. Inc, BP Plc, Chevron Corporation, China Petrochemical Group Co. Ltd. (Sinopec Group), Clariant, Quaker Chemical Corp., Exxon Mobil Corporation, Fuchs Group, Houghton International, Inc., Idemitsu Kosan Co. Ltd., Lucas Oil Products Inc., Lukoil Oil Co., PetroChina Co. Ltd., Phillips 66, Royal Dutch Shell Plc, The Lubrizol Corp., Total S.A, Kluber Lubrication, Valvoline International, Inc., Zeller+Gmelin GmbH & Co KG, MAK Lubricants, Indian Oil Corporation.
Key developments:
In February 2021: ExxonMobil Corp has launched FuelCell carbon capture technology that has capacity to lower emission from exhaust streams, power plants, refineries and chemical plants
In October 2020: MAK Lubricants launched MAK Titanium CK4 engine oils for heavy-duty commercial vehicles to enhance engine protection. Premium engine oil designed with synthetic technology for ultra-low emission diesel engines meeting BS VI emission norms and fitted with after treatment devices such as DPF, SCR, EGR etc.
In October 2018: Fuchs Group has launched RENOCLEAN AIR series to control dust production in the mining sector. The new RENOCLEAN AIR range dissolves into water to offer a complete dust control solution for every step of the mining process
Products Covered:
• Compressor Oil
• Engine Oil
• Gear Oil
• General Industrial Oil
• Hydraulic fluid
• Metalworking Fluid
• Process Oil
• Transmission and Hydraulic Fluid
• Turbine Oil
• Grease
• Other Products
Base Oils Covered:
• Mineral Oil
• Synthetic Oil
• Bio-Based Oil
End Users Covered:
• Aerospace
• Automotive (Vehicle Manufacturing)
• Cement Production
• Chemical Manufacturing
• Construction
• Food Processing
• Heavy Equipment
• Metal & Mining
• Metallurgy and Metal Working
• Oil & Gas
• Power Generation
• Textile
• Other End Users
• Military
• Timber and Logging
Regions Covered:
• North America
o US
o Canada
o Mexico
• Europe
o Germany
o UK
o Italy
o France
o Spain
o Rest of Europe
• Asia Pacific
o Japan
o China
o India
o Australia
o New Zealand
o South Korea
o Rest of Asia Pacific
• South America
o Argentina
o Brazil
o Chile
o Rest of South America
• Middle East & Africa
o Saudi Arabia
o UAE
o Qatar
o South Africa
o Rest of Middle East & Africa
What our report offers:
- Market share assessments for the regional and country-level segments
- Strategic recommendations for the new entrants
- Covers Market data for the years 2020, 2021, 2022, 2025 and 2028
- Market Trends (Drivers, Constraints, Opportunities, Threats, Challenges, Investment Opportunities, and recommendations)
- Strategic recommendations in key business segments based on the market estimations
- Competitive landscaping mapping the key common trends
- Company profiling with detailed strategies, financials, and recent developments
- Supply chain trends mapping the latest technological advancements
Free Customization Offerings:
All the customers of this report will be entitled to receive one of the following free customization options:
• Company Profiling
o Comprehensive profiling of additional market players (up to 3)
o SWOT Analysis of key players (up to 3)
• Regional Segmentation
o Market estimations, Forecasts and CAGR of any prominent country as per the client's interest (Note: Depends on feasibility check)
• Competitive Benchmarking
o Benchmarking of key players based on product portfolio, geographical presence, and strategic alliances
Table of Contents
1 Executive Summary
2 Preface
2.1 Abstract
2.2 Stake Holders
2.3 Research Scope
2.4 Research Methodology
2.4.1 Data Mining
2.4.2 Data Analysis
2.4.3 Data Validation
2.4.4 Research Approach
2.5 Research Sources
2.5.1 Primary Research Sources
2.5.2 Secondary Research Sources
2.5.3 Assumptions
3 Market Trend Analysis
3.1 Introduction
3.2 Drivers
3.3 Restraints
3.4 Opportunities
3.5 Threats
3.6 Product Analysis
3.7 End User Analysis
3.8 Emerging Markets
3.9 Impact of Covid-19
4 Porters Five Force Analysis
4.1 Bargaining power of suppliers
4.2 Bargaining power of buyers
4.3 Threat of substitutes
4.4 Threat of new entrants
4.5 Competitive rivalry
5 Global Industrial Lubricants Market, By Product
5.1 Introduction
5.2 Compressor Oil
5.3 Engine Oil
5.4 Gear Oil
5.5 General Industrial Oil
5.6 Hydraulic fluid
5.7 Metalworking Fluid
5.8 Process Oil
5.9 Transmission and Hydraulic Fluid
5.10 Turbine Oil
5.11 Grease
5.12 Other Products
5.12.1 Refrigeration Oil
5.12.2 Textile Machinery Lubricants
5.12.3 Transformer Oil
6 Global Industrial Lubricants Market, By Base Oil
6.1 Introduction
6.2 Mineral Oil
6.3 Synthetic Oil
6.3.1 Polyalphaolefins (PAO)
6.3.2 Polyalkylene Glycol (PAG)
6.3.3 Esters
6.3.4 Group III (Hydro cracking)
6.4 Bio-Based Oil
7 Global Industrial Lubricants Market, By End User
7.1 Introduction
7.2 Aerospace
7.3 Automotive (Vehicle Manufacturing)
7.4 Cement Production
7.5 Chemical Manufacturing
7.6 Construction
7.7 Food Processing
7.8 Heavy Equipment
7.9 Metal & Mining
7.10 Metallurgy and Metal Working
7.11 Oil & Gas
7.12 Power Generation
7.13 Textile
7.14 Other End Users
7.14.1 Agriculture
7.14.2 Pulp & Paper
7.14.3 Marine (Deck Manufacturing)
7.15 Military
7.16 Timber and Logging
8 Global Industrial Lubricants Market, By Geography
8.1 Introduction
8.2 North America
8.2.1 US
8.2.2 Canada
8.2.3 Mexico
8.3 Europe
8.3.1 Germany
8.3.2 UK
8.3.3 Italy
8.3.4 France
8.3.5 Spain
8.3.6 Rest of Europe
8.4 Asia Pacific
8.4.1 Japan
8.4.2 China
8.4.3 India
8.4.4 Australia
8.4.5 New Zealand
8.4.6 South Korea
8.4.7 Rest of Asia Pacific
8.5 South America
8.5.1 Argentina
8.5.2 Brazil
8.5.3 Chile
8.5.4 Rest of South America
8.6 Middle East & Africa
8.6.1 Saudi Arabia
8.6.2 UAE
8.6.3 Qatar
8.6.4 South Africa
8.6.5 Rest of Middle East & Africa
9 Key Developments
9.1 Agreements, Partnerships, Collaborations and Joint Ventures
9.2 Acquisitions & Mergers
9.3 New Product Launch
9.4 Expansions
9.5 Other Key Strategies
10 Company Profiling
10.1 Amsoil, Inc.
10.2 BASF SE
10.3 Bel-Ray Co. Inc
10.4 BP Plc
10.5 Chevron Corporation
10.6 China Petrochemical Group Co. Ltd. (Sinopec Group)
10.7 Clariant, Quaker Chemical Corp.
10.8 Exxon Mobil Corporation
10.9 Fuchs Group
10.10 Houghton International, Inc.
10.11 Idemitsu Kosan Co. Ltd.
10.12 Lucas Oil Products Inc.
10.13 Lukoil Oil Co.
10.14 PetroChina Co. Ltd.
10.15 Phillips 66
10.16 Royal Dutch Shell Plc
10.17 The Lubrizol Corp.
10.18 Total S.A, Kluber Lubrication
10.19 Valvoline International, Inc.
10.20 Zeller+Gmelin GmbH & Co KG
10.21 MAK Lubricants
10.22 Indian Oil Corporation
List of Tables
1 Global Industrial Lubricants Market Outlook, By Region (2020-2028) (US $MN)
2 Global Industrial Lubricants Market Outlook, By Product (2020-2028) (US $MN)
4 Global Industrial Lubricants Market Outlook, By Compressor Oil (2020-2028) (US $MN)
5 Global Industrial Lubricants Market Outlook, By Engine Oil (2020-2028) (US $MN)
6 Global Industrial Lubricants Market Outlook, By Gear Oil (2020-2028) (US $MN)
7 Global Industrial Lubricants Market Outlook, By General Industrial Oil (2020-2028) (US $MN)
8 Global Industrial Lubricants Market Outlook, By Hydraulic fluid (2020-2028) (US $MN)
9 Global Industrial Lubricants Market Outlook, By Metalworking Fluid (2020-2028) (US $MN)
10 Global Industrial Lubricants Market Outlook, By Process Oil (2020-2028) (US $MN)
11 Global Industrial Lubricants Market Outlook, By Transmission and Hydraulic Fluid (2020-2028) (US $MN)
12 Global Industrial Lubricants Market Outlook, By Turbine Oil (2020-2028) (US $MN)
13 Global Industrial Lubricants Market Outlook, By Grease (2020-2028) (US $MN)
14 Global Industrial Lubricants Market Outlook, By Other Products (2020-2028) (US $MN)
15 Global Industrial Lubricants Market Outlook, By Refrigeration Oil (2020-2028) (US $MN)
16 Global Industrial Lubricants Market Outlook, By Textile Machinery Lubricants (2020-2028) (US $MN)
17 Global Industrial Lubricants Market Outlook, By Transformer Oil (2020-2028) (US $MN)
18 Global Industrial Lubricants Market Outlook, By Base Oil (2020-2028) (US $MN)
19 Global Industrial Lubricants Market Outlook, By Mineral Oil (2020-2028) (US $MN)
20 Global Industrial Lubricants Market Outlook, By Synthetic Oil (2020-2028) (US $MN)
21 Global Industrial Lubricants Market Outlook, By Polyalphaolefins (PAO) (2020-2028) (US $MN)
22 Global Industrial Lubricants Market Outlook, By Polyalkylene Glycol (PAG) (2020-2028) (US $MN)
23 Global Industrial Lubricants Market Outlook, By Esters (2020-2028) (US $MN)
24 Global Industrial Lubricants Market Outlook, By Group III (Hydro cracking) (2020-2028) (US $MN)
25 Global Industrial Lubricants Market Outlook, By Bio-Based Oil (2020-2028) (US $MN)
26 Global Industrial Lubricants Market Outlook, By End User (2020-2028) (US $MN)
27 Global Industrial Lubricants Market Outlook, By Aerospace (2020-2028) (US $MN)
28 Global Industrial Lubricants Market Outlook, By Automotive (Vehicle Manufacturing) (2020-2028) (US $MN)
29 Global Industrial Lubricants Market Outlook, By Cement Production (2020-2028) (US $MN)
30 Global Industrial Lubricants Market Outlook, By Chemical Manufacturing (2020-2028) (US $MN)
31 Global Industrial Lubricants Market Outlook, By Construction (2020-2028) (US $MN)
32 Global Industrial Lubricants Market Outlook, By Food Processing (2020-2028) (US $MN)
33 Global Industrial Lubricants Market Outlook, By Heavy Equipment (2020-2028) (US $MN)
34 Global Industrial Lubricants Market Outlook, By Metal & Mining (2020-2028) (US $MN)
35 Global Industrial Lubricants Market Outlook, By Metallurgy and Metal Working (2020-2028) (US $MN)
36 Global Industrial Lubricants Market Outlook, By Oil & Gas (2020-2028) (US $MN)
37 Global Industrial Lubricants Market Outlook, By Power Generation (2020-2028) (US $MN)
38 Global Industrial Lubricants Market Outlook, By Textile (2020-2028) (US $MN)
39 Global Industrial Lubricants Market Outlook, By Other End Users (2020-2028) (US $MN)
40 Global Industrial Lubricants Market Outlook, By Agriculture (2020-2028) (US $MN)
41 Global Industrial Lubricants Market Outlook, By Pulp & Paper (2020-2028) (US $MN)
42 Global Industrial Lubricants Market Outlook, By Marine (Deck Manufacturing) (2020-2028) (US $MN)
43 Global Industrial Lubricants Market Outlook, By Military (2020-2028) (US $MN)
44 Global Industrial Lubricants Market Outlook, By Timber and Logging (2020-2028) (US $MN)
Note- Tables for North America, Europe, APAC, South America, and Middle East & Africa Regions are also represented in the same manner as above.
List of Figures
RESEARCH METHODOLOGY

We at ‘Stratistics’ opt for an extensive research approach which involves data mining, data validation, and data analysis. The various research sources include in-house repository, secondary research, competitor’s sources, social media research, client internal data, and primary research.
Our team of analysts prefers the most reliable and authenticated data sources in order to perform the comprehensive literature search. With access to most of the authenticated data bases our team highly considers the best mix of information through various sources to obtain extensive and accurate analysis.
Each report takes an average time of a month and a team of 4 industry analysts. The time may vary depending on the scope and data availability of the desired market report. The various parameters used in the market assessment are standardized in order to enhance the data accuracy.
Data Mining
The data is collected from several authenticated, reliable, paid and unpaid sources and is filtered depending on the scope & objective of the research. Our reports repository acts as an added advantage in this procedure. Data gathering from the raw material suppliers, distributors and the manufacturers is performed on a regular basis, this helps in the comprehensive understanding of the products value chain. Apart from the above mentioned sources the data is also collected from the industry consultants to ensure the objective of the study is in the right direction.
Market trends such as technological advancements, regulatory affairs, market dynamics (Drivers, Restraints, Opportunities and Challenges) are obtained from scientific journals, market related national & international associations and organizations.
Data Analysis
From the data that is collected depending on the scope & objective of the research the data is subjected for the analysis. The critical steps that we follow for the data analysis include:
- Product Lifecycle Analysis
- Competitor analysis
- Risk analysis
- Porters Analysis
- PESTEL Analysis
- SWOT Analysis
The data engineering is performed by the core industry experts considering both the Marketing Mix Modeling and the Demand Forecasting. The marketing mix modeling makes use of multiple-regression techniques to predict the optimal mix of marketing variables. Regression factor is based on a number of variables and how they relate to an outcome such as sales or profits.
Data Validation
The data validation is performed by the exhaustive primary research from the expert interviews. This includes telephonic interviews, focus groups, face to face interviews, and questionnaires to validate our research from all aspects. The industry experts we approach come from the leading firms, involved in the supply chain ranging from the suppliers, distributors to the manufacturers and consumers so as to ensure an unbiased analysis.
We are in touch with more than 15,000 industry experts with the right mix of consultants, CEO's, presidents, vice presidents, managers, experts from both supply side and demand side, executives and so on.
The data validation involves the primary research from the industry experts belonging to:
- Leading Companies
- Suppliers & Distributors
- Manufacturers
- Consumers
- Industry/Strategic Consultants
Apart from the data validation the primary research also helps in performing the fill gap research, i.e. providing solutions for the unmet needs of the research which helps in enhancing the reports quality.
For more details about research methodology, kindly write to us at info@strategymrc.com
Frequently Asked Questions
In case of any queries regarding this report, you can contact the customer service by filing the “Inquiry Before Buy” form available on the right hand side. You may also contact us through email: info@strategymrc.com or phone: +1-301-202-5929
Yes, the samples are available for all the published reports. You can request them by filling the “Request Sample” option available in this page.
Yes, you can request a sample with your specific requirements. All the customized samples will be provided as per the requirement with the real data masked.
All our reports are available in Digital PDF format. In case if you require them in any other formats, such as PPT, Excel etc you can submit a request through “Inquiry Before Buy” form available on the right hand side. You may also contact us through email: info@strategymrc.com or phone: +1-301-202-5929
We offer a free 15% customization with every purchase. This requirement can be fulfilled for both pre and post sale. You may send your customization requirements through email at info@strategymrc.com or call us on +1-301-202-5929.
We have 3 different licensing options available in electronic format.
- Single User Licence: Allows one person, typically the buyer, to have access to the ordered product. The ordered product cannot be distributed to anyone else.
- 2-5 User Licence: Allows the ordered product to be shared among a maximum of 5 people within your organisation.
- Corporate License: Allows the product to be shared among all employees of your organisation regardless of their geographical location.
All our reports are typically be emailed to you as an attachment.
To order any available report you need to register on our website. The payment can be made either through CCAvenue or PayPal payments gateways which accept all international cards.
We extend our support to 6 months post sale. A post sale customization is also provided to cover your unmet needs in the report.
Request Customization
We offer complimentary customization of up to 15% with every purchase. To share your customization requirements, feel free to email us at info@strategymrc.com or call us on +1-301-202-5929. .
Please Note: Customization within the 15% threshold is entirely free of charge. If your request exceeds this limit, we will conduct a feasibility assessment. Following that, a detailed quote and timeline will be provided.
WHY CHOOSE US ?

Assured Quality
Best in class reports with high standard of research integrity

24X7 Research Support
Continuous support to ensure the best customer experience.

Free Customization
Adding more values to your product of interest.

Safe & Secure Access
Providing a secured environment for all online transactions.

Trusted by 600+ Brands
Serving the most reputed brands across the world.