
Industrial Visual Management Systems Market
Industrial Visual Management Systems Market Forecasts to 2032 - Global Analysis By Type (Digital, Analog and Hybrid Systems), Offering, Visual Method, User Role, Deployment Mode, Application and By Geography

|
Years Covered |
2022-2030 |
|
Estimated Year Value (2024) |
US $2.1 BN |
|
Projected Year Value (2030) |
US $3.5 BN |
|
CAGR (2024 - 2030) |
7.6% |
|
Regions Covered |
North America, Europe, Asia Pacific, South America, and Middle East & Africa |
|
Countries Covered |
US, Canada, Mexico, Germany, UK, Italy, France, Spain, Japan, China, India, Australia, New Zealand, South Korea, Rest of Asia Pacific, South America, Argentina, Brazil, Chile, Middle East & Africa, Saudi Arabia, UAE, Qatar, and South Africa |
|
Largest Market |
Asia Pacific |
|
Highest Growing Market |
North America |
According to Stratistics MRC, the Global Industrial Visual Management Systems Market is accounted for $2.1 billion in 2025 and is expected to reach $3.5 billion by 2032 growing at a CAGR of 7.6% during the forecast period. Industrial Visual Management Systems (VMS) are instruments that convey vital information via visual displays in manufacturing and industrial environments. By providing data like production status, safety procedures, and performance indicators in real-time, these systems improve operational efficiency. Employees can more rapidly evaluate procedures, spot problems, and make better decisions with the use of visual aids like charts, dashboards, and indicators. VMS supports efficient productivity and prompt resolution of possible issues in industrial settings by promoting transparency, lowering errors, and cultivating a culture of continuous improvement through the provision of easily understood visuals.
Market Dynamics:
Driver:
Workplace safety and compliance
Industry-wide regulations demand that businesses keep up-to-date, transparent safety information, and VMS solutions provide a useful means of displaying these crucial details. By monitoring and reporting on safety procedures, these technologies assist organisations in improving compliance and transparency. VMS enhances hazard identification and lowers human error by offering visual cues on safety precautions. VMS adoption is further fuelled by the need for real-time monitoring to adhere to occupational health and safety regulations. Industries are depending more and more on VMS to maintain compliance and provide a safe working environment as safety rules get stiffer.
Restraint:
High initial investment
Smaller businesses may be discouraged from implementing VMS technology because to this cost, which would restrict their market penetration. The total cost is further raised by the price of system customisation, training, and installation. Concerns about the long-term return on investment (ROI) may make businesses hesitant to invest in these systems. Furthermore, budget-constrained enterprises could give priority to more pressing operational requirements over sophisticated visual management systems. As a result, the high initial cost slows the market's growth and adoption.
Opportunity:
Sustainability tracking
Real-time data visualisation is made possible by these systems, which help industry monitor emissions, resource use, and waste reduction initiatives. Businesses can make well-informed decisions to increase operational efficiency and adhere to environmental rules by incorporating sustainability measures. Additionally, by improving accountability and transparency, visual management tools help organisations develop a sustainable culture. To meet the goals of global sustainability, businesses are investing in VMS as demand for environmentally friendly practices rises. As businesses look for solutions that enhance environmental stewardship and productivity, this change is driving market expansion.
Threat:
Digital literacy gaps
The inability of many employees to use sophisticated visual tools may result in errors and inefficiency. This disparity hinders organisations from realising the full potential of VMS by slowing down its integration in industrial settings. Innovation may also be hampered by opposition to implementing new systems brought on by a lack of digital skills. Businesses may find it difficult to completely adopt these technologies because of a lack of expertise or a fear of complexity. Consequently, there will be delays in the market's expansion and wider use.
Covid-19 Impact
The Covid-19 pandemic significantly impacted the Industrial Visual Management Systems (VMS) market, driving an initial decline due to disruptions in manufacturing and supply chains. However, as industries adjusted to new safety protocols and remote operations, demand for VMS solutions surged. These systems helped optimize production processes, enhance remote monitoring, and maintain operational efficiency, leading to market recovery and growth. The pandemic accelerated digital transformation, increasing the adoption of VMS in industries worldwide for better workforce and inventory management.
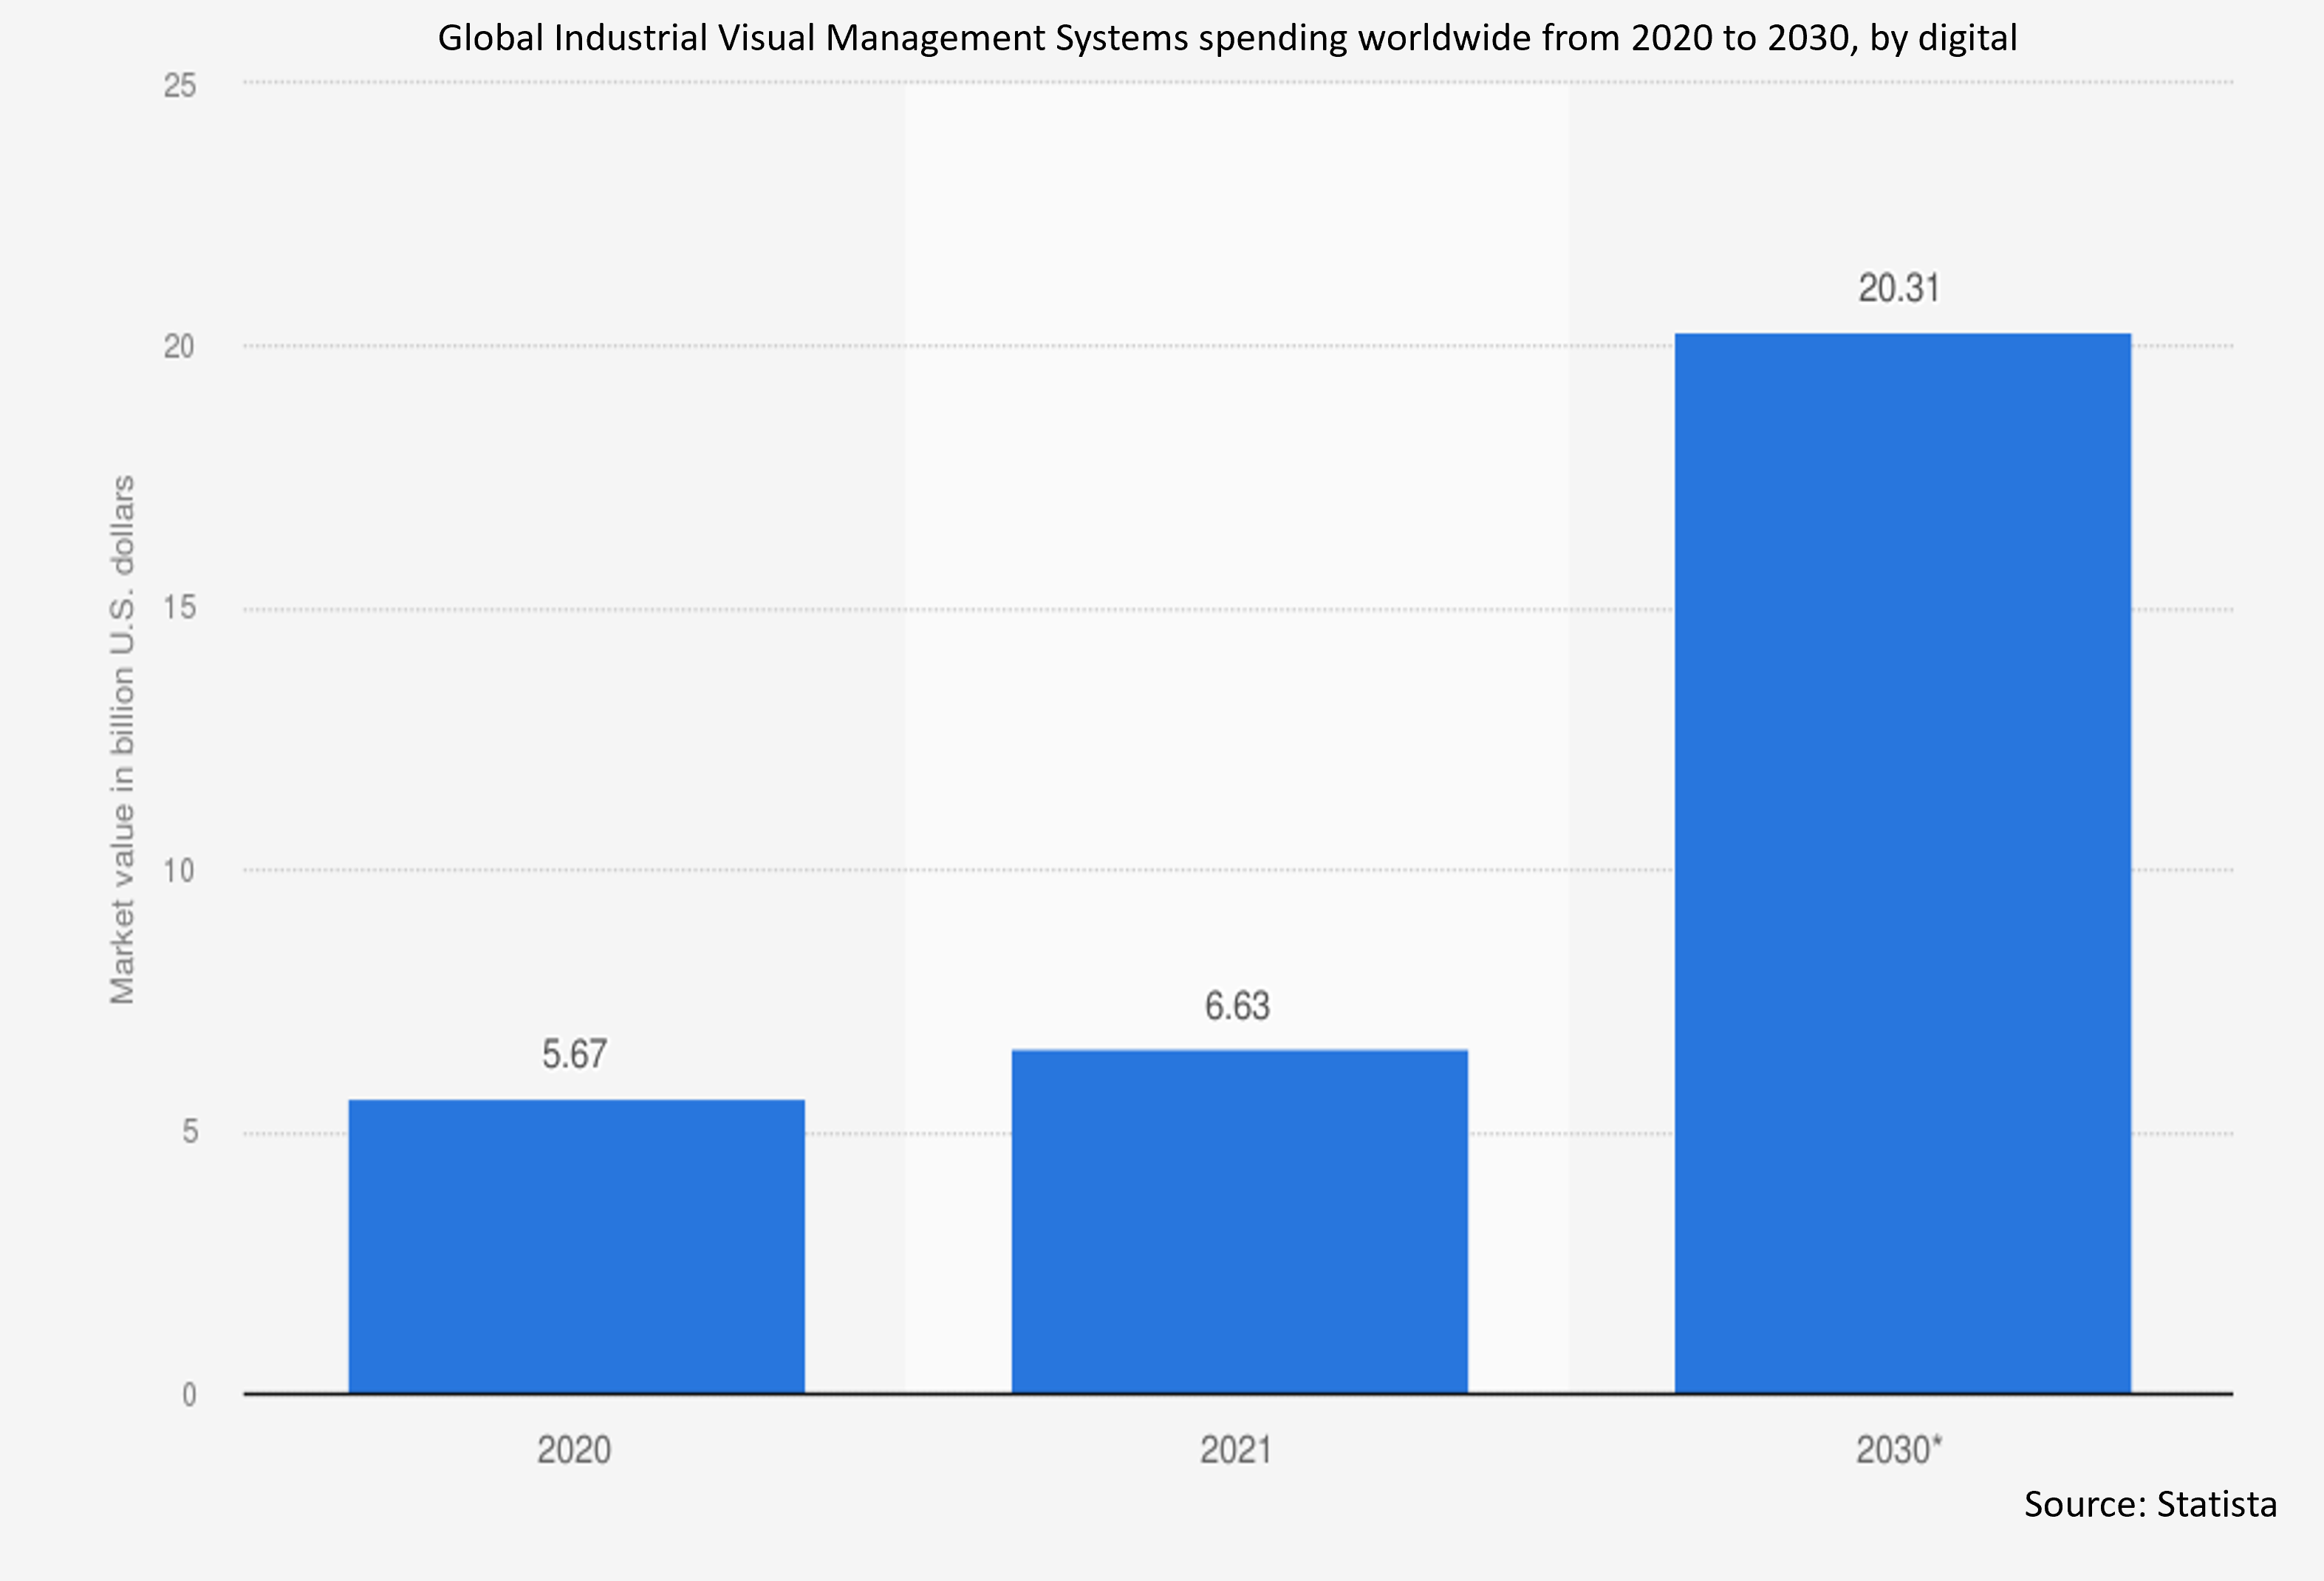
The digital segment is expected to be the largest during the forecast period
The digital segment is expected to account for the largest market share during the forecast period by enabling real-time monitoring and data visualization. It enhances decision-making by providing access to accurate, up-to-date information through digital dashboards and interactive displays. With advancements in cloud computing and IoT, digital solutions offer scalability, flexibility, and remote access for industrial operations. The integration of AI and machine learning in VMS helps optimize workflows and improve predictive maintenance, reducing downtime. Moreover, digitalization increases operational efficiency and safety by streamlining communication and visualizing key performance indicators.
The safety and compliance segment is expected to have the highest CAGR during the forecast period
Over the forecast period, the safety and compliance segment is predicted to witness the highest growth rate by ensuring that companies adhere to strict regulatory standards. These systems help monitor workplace conditions, improving safety protocols and reducing the risk of accidents. Visual management tools allow real-time tracking of safety metrics and performance, ensuring quick corrective actions are taken when needed. Furthermore, compliance requirements often mandate the use of such systems for data tracking, making them essential for industries like manufacturing and construction. As safety regulations evolve, the demand for advanced visual management systems continues to rise, driving market growth.
Region with largest share:
During the forecast period, the Asia Pacific region is expected to hold the largest market share due to rapid industrialization, increasing demand for operational efficiency, and the rise of smart factories. Visual management tools, such as digital dashboards, signage, and performance boards, are being widely adopted to enhance communication, monitor real-time performance, and improve workflow. The region's expanding manufacturing sector, particularly in countries like China, Japan, and India, is fueling demand for advanced visual systems that support lean production practices and enhance safety standards. Technological advancements and government initiatives further bolster market expansion.
Region with highest CAGR:
Over the forecast period, the North America region is anticipated to exhibit the highest CAGR, owing to the demand for real-time data visibility, process optimization, and enhanced operational efficiency across various industries. These systems improve workflow by visually displaying performance metrics, reducing downtime, and enhancing safety protocols. The growing trend toward Industry 4.0, smart factories, and IoT integration further supports market growth. North American companies are focusing on advanced technologies like augmented reality and artificial intelligence, aiming to streamline operations, improve decision-making, and maintain competitive advantages in an evolving industrial landscape.
Key players in the market
Some of the key players profiled in the Industrial Visual Management Systems Market include Schneider Electric, Rockwell Automation, Cognex Corporation, Hexagon AB, ViTrox Corporation, Keyence Corporation, Omron Corporation, Siemens AG, Panasonic Corporation, Basler AG, FLIR Systems, National Instruments, Teledyne Technologies, SICK AG, Datalogic S.p.A., ISRA VISION AG, Opto Engineering and Industrial Vision Systems Ltd.
Key Developments:
In April 2024, Rockwell Automation signed a definitive agreement to acquire Verve Industrial Protection, a cybersecurity software and services company specializing in industrial environments. This acquisition aims to expand Rockwell's cybersecurity offerings, particularly in asset inventory and vulnerability management, thereby enhancing the security and resilience of customers' operations.
In February 2024, Schneider Electric introduced EcoStruxure™ Plant Lean Management, a digital solution designed to enhance productivity and digitalization in manufacturing. This platform aggregates data across industrial operations to develop key performance indicators (KPIs) for short interval management (SIM) meetings, enabling shop floor teams to review production cycles and identify issues in real-time.
In May 2023, Schneider Electric partnered with ArcelorMittal Nippon Steel India (AM/NS India) to design high-tech training facilities and programs focused on smart manufacturing. The collaboration aims to develop a state-of-the-art smart campus in Ahmedabad, Gujarat, for NAMTECH, an education initiative by AM/NS India.
Types Covered:
• Digital
• Analog
• Hybrid Systems
Offerings Covered:
• Hardware
• Software
• Services
Visual Methods Covered:
• Kanban Boards
• Andon Systems
• Gemba Boards
• Huddle Boards
• Status Indicator Lights
• Real-Time Dashboards
• Heat Maps
• Color-Coded Alerts and Signals
• Other Visual Methods
User Roles Covered:
• Operators
• Supervisors
• Plant Managers
• Maintenance Staff
• Safety Officers
• Quality Inspectors
• Executive Leadership
• Other User Roles
Deployment Modes Covered:
• On-premise
• Cloud-based
• Hybrid
Applications Covered:
• Maintenance Monitoring
• Safety and Compliance
• Quality Control
• Inventory Management
• Workplace Organization
• Real-Time Performance Tracking
• Employee Communication and Engagement
• Incident and Downtime Alerts
• Other Applications
Regions Covered:
• North America
o US
o Canada
o Mexico
• Europe
o Germany
o UK
o Italy
o France
o Spain
o Rest of Europe
• Asia Pacific
o Japan
o China
o India
o Australia
o New Zealand
o South Korea
o Rest of Asia Pacific
• South America
o Argentina
o Brazil
o Chile
o Rest of South America
• Middle East & Africa
o Saudi Arabia
o UAE
o Qatar
o South Africa
o Rest of Middle East & Africa
What our report offers:
- Market share assessments for the regional and country-level segments
- Strategic recommendations for the new entrants
- Covers Market data for the years 2024, 2025, 2026, 2028, and 2032
- Market Trends (Drivers, Constraints, Opportunities, Threats, Challenges, Investment Opportunities, and recommendations)
- Strategic recommendations in key business segments based on the market estimations
- Competitive landscaping mapping the key common trends
- Company profiling with detailed strategies, financials, and recent developments
- Supply chain trends mapping the latest technological advancements
Free Customization Offerings:
All the customers of this report will be entitled to receive one of the following free customization options:
• Company Profiling
o Comprehensive profiling of additional market players (up to 3)
o SWOT Analysis of key players (up to 3)
• Regional Segmentation
o Market estimations, Forecasts and CAGR of any prominent country as per the client's interest (Note: Depends on feasibility check)
• Competitive Benchmarking
o Benchmarking of key players based on product portfolio, geographical presence, and strategic alliances
Table of Contents
1 Executive Summary
2 Preface
2.1 Abstract
2.2 Stake Holders
2.3 Research Scope
2.4 Research Methodology
2.4.1 Data Mining
2.4.2 Data Analysis
2.4.3 Data Validation
2.4.4 Research Approach
2.5 Research Sources
2.5.1 Primary Research Sources
2.5.2 Secondary Research Sources
2.5.3 Assumptions
3 Market Trend Analysis
3.1 Introduction
3.2 Drivers
3.3 Restraints
3.4 Opportunities
3.5 Threats
3.6 Application Analysis
3.7 Emerging Markets
3.8 Impact of Covid-19
4 Porters Five Force Analysis
4.1 Bargaining power of suppliers
4.2 Bargaining power of buyers
4.3 Threat of substitutes
4.4 Threat of new entrants
4.5 Competitive rivalry
5 Global Industrial Visual Management Systems Market, By Type
5.1 Introduction
5.2 Digital
5.3 Analog
5.4 Hybrid Systems
6 Global Industrial Visual Management Systems Market, By Offering
6.1 Introduction
6.2 Hardware
6.2.1 Screenn or Displays
6.2.2 Digital Signage
6.2.3 Visual Boards
6.2.4 Light Indicators
6.3 Software
6.3.1 Monitoring and Control Software
6.3.2 Data Visualization Tools
6.3.3 Workflow Management Software
6.4 Services
6.4.1 Installation and Integration Services
6.4.2 Training and Support Services
6.4.3 Consulting Services
7 Global Industrial Visual Management Systems Market, By Visual Method
7.1 Introduction
7.2 Kanban Boards
7.3 Andon Systems
7.4 Gemba Boards
7.5 Huddle Boards
7.6 Status Indicator Lights
7.7 Real-Time Dashboards
7.8 Heat Maps
7.9 Color-Coded Alerts and Signals
7.10 Other Visual Methods
8 Global Industrial Visual Management Systems Market, By User Role
8.1 Introduction
8.2 Operators
8.3 Supervisors
8.4 Plant Managers
8.5 Maintenance Staff
8.6 Safety Officers
8.7 Quality Inspectors
8.8 Executive Leadership
8.9 Other User Roles
9 Global Industrial Visual Management Systems Market, By Deployment Mode
9.1 Introduction
9.2 On-premise
9.3 Cloud-based
9.4 Hybrid
10 Global Industrial Visual Management Systems Market, By Application
10.1 Introduction
10.2 Maintenance Monitoring
10.3 Safety and Compliance
10.4 Quality Control
10.5 Inventory Management
10.6 Workplace Organization
10.7 Real-Time Performance Tracking
10.8 Employee Communication and Engagement
10.9 Incident and Downtime Alerts
10.10 Other Applications
11 Global Industrial Visual Management Systems Market, By Geography
11.1 Introduction
11.2 North America
11.2.1 US
11.2.2 Canada
11.2.3 Mexico
11.3 Europe
11.3.1 Germany
11.3.2 UK
11.3.3 Italy
11.3.4 France
11.3.5 Spain
11.3.6 Rest of Europe
11.4 Asia Pacific
11.4.1 Japan
11.4.2 China
11.4.3 India
11.4.4 Australia
11.4.5 New Zealand
11.4.6 South Korea
11.4.7 Rest of Asia Pacific
11.5 South America
11.5.1 Argentina
11.5.2 Brazil
11.5.3 Chile
11.5.4 Rest of South America
11.6 Middle East & Africa
11.6.1 Saudi Arabia
11.6.2 UAE
11.6.3 Qatar
11.6.4 South Africa
11.6.5 Rest of Middle East & Africa
12 Key Developments
12.1 Agreements, Partnerships, Collaborations and Joint Ventures
12.2 Acquisitions & Mergers
12.3 New Product Launch
12.4 Expansions
12.5 Other Key Strategies
13 Company Profiling
13.1 Schneider Electric
13.2 Rockwell Automation
13.3 Cognex Corporation
13.4 Hexagon AB
13.5 ViTrox Corporation
13.6 Keyence Corporation
13.7 Omron Corporation
13.8 Siemens AG
13.9 Panasonic Corporation
13.10 Basler AG
13.11 FLIR Systems
13.12 National Instruments
13.13 Teledyne Technologies
13.14 SICK AG
13.15 Datalogic S.p.A.
13.16 ISRA VISION AG
13.17 Opto Engineering
13.18 Industrial Vision Systems Ltd.
List of Tables
1 Global Industrial Visual Management Systems Market Outlook, By Region (2024-2032) ($MN)
2 Global Industrial Visual Management Systems Market Outlook, By Type (2024-2032) ($MN)
3 Global Industrial Visual Management Systems Market Outlook, By Digital (2024-2032) ($MN)
4 Global Industrial Visual Management Systems Market Outlook, By Analog (2024-2032) ($MN)
5 Global Industrial Visual Management Systems Market Outlook, By Hybrid Systems (2024-2032) ($MN)
6 Global Industrial Visual Management Systems Market Outlook, By Offering (2024-2032) ($MN)
7 Global Industrial Visual Management Systems Market Outlook, By Hardware (2024-2032) ($MN)
8 Global Industrial Visual Management Systems Market Outlook, By Screen or Displays (2024-2032) ($MN)
9 Global Industrial Visual Management Systems Market Outlook, By Digital Signage (2024-2032) ($MN)
10 Global Industrial Visual Management Systems Market Outlook, By Visual Boards (2024-2032) ($MN)
11 Global Industrial Visual Management Systems Market Outlook, By Light Indicators (2024-2032) ($MN)
12 Global Industrial Visual Management Systems Market Outlook, By Software (2024-2032) ($MN)
13 Global Industrial Visual Management Systems Market Outlook, By Monitoring and Control Software (2024-2032) ($MN)
14 Global Industrial Visual Management Systems Market Outlook, By Data Visualization Tools (2024-2032) ($MN)
15 Global Industrial Visual Management Systems Market Outlook, By Workflow Management Software (2024-2032) ($MN)
16 Global Industrial Visual Management Systems Market Outlook, By Services (2024-2032) ($MN)
17 Global Industrial Visual Management Systems Market Outlook, By Installation and Integration Services (2024-2032) ($MN)
18 Global Industrial Visual Management Systems Market Outlook, By Training and Support Services (2024-2032) ($MN)
19 Global Industrial Visual Management Systems Market Outlook, By Consulting Services (2024-2032) ($MN)
20 Global Industrial Visual Management Systems Market Outlook, By Visual Method (2024-2032) ($MN)
21 Global Industrial Visual Management Systems Market Outlook, By Kanban Boards (2024-2032) ($MN)
22 Global Industrial Visual Management Systems Market Outlook, By Andon Systems (2024-2032) ($MN)
23 Global Industrial Visual Management Systems Market Outlook, By Gemba Boards (2024-2032) ($MN)
24 Global Industrial Visual Management Systems Market Outlook, By Huddle Boards (2024-2032) ($MN)
25 Global Industrial Visual Management Systems Market Outlook, By Status Indicator Lights (2024-2032) ($MN)
26 Global Industrial Visual Management Systems Market Outlook, By Real-Time Dashboards (2024-2032) ($MN)
27 Global Industrial Visual Management Systems Market Outlook, By Heat Maps (2024-2032) ($MN)
28 Global Industrial Visual Management Systems Market Outlook, By Color-Coded Alerts and Signals (2024-2032) ($MN)
29 Global Industrial Visual Management Systems Market Outlook, By Other Visual Methods (2024-2032) ($MN)
30 Global Industrial Visual Management Systems Market Outlook, By User Role (2024-2032) ($MN)
31 Global Industrial Visual Management Systems Market Outlook, By Operators (2024-2032) ($MN)
32 Global Industrial Visual Management Systems Market Outlook, By Supervisors (2024-2032) ($MN)
33 Global Industrial Visual Management Systems Market Outlook, By Plant Managers (2024-2032) ($MN)
34 Global Industrial Visual Management Systems Market Outlook, By Maintenance Staff (2024-2032) ($MN)
35 Global Industrial Visual Management Systems Market Outlook, By Safety Officers (2024-2032) ($MN)
36 Global Industrial Visual Management Systems Market Outlook, By Quality Inspectors (2024-2032) ($MN)
37 Global Industrial Visual Management Systems Market Outlook, By Executive Leadership (2024-2032) ($MN)
38 Global Industrial Visual Management Systems Market Outlook, By Other User Roles (2024-2032) ($MN)
39 Global Industrial Visual Management Systems Market Outlook, By Deployment Mode (2024-2032) ($MN)
40 Global Industrial Visual Management Systems Market Outlook, By On-premise (2024-2032) ($MN)
41 Global Industrial Visual Management Systems Market Outlook, By Cloud-based (2024-2032) ($MN)
42 Global Industrial Visual Management Systems Market Outlook, By Hybrid (2024-2032) ($MN)
43 Global Industrial Visual Management Systems Market Outlook, By Application (2024-2032) ($MN)
44 Global Industrial Visual Management Systems Market Outlook, By Maintenance Monitoring (2024-2032) ($MN)
45 Global Industrial Visual Management Systems Market Outlook, By Safety and Compliance (2024-2032) ($MN)
46 Global Industrial Visual Management Systems Market Outlook, By Quality Control (2024-2032) ($MN)
47 Global Industrial Visual Management Systems Market Outlook, By Inventory Management (2024-2032) ($MN)
48 Global Industrial Visual Management Systems Market Outlook, By Workplace Organization (2024-2032) ($MN)
49 Global Industrial Visual Management Systems Market Outlook, By Real-Time Performance Tracking (2024-2032) ($MN)
50 Global Industrial Visual Management Systems Market Outlook, By Employee Communication and Engagement (2024-2032) ($MN)
51 Global Industrial Visual Management Systems Market Outlook, By Incident and Downtime Alerts (2024-2032) ($MN)
52 Global Industrial Visual Management Systems Market Outlook, By Other Applications (2024-2032) ($MN)
Note: Tables for North America, Europe, APAC, South America, and Middle East & Africa Regions are also represented in the same manner as above.
List of Figures
RESEARCH METHODOLOGY

We at ‘Stratistics’ opt for an extensive research approach which involves data mining, data validation, and data analysis. The various research sources include in-house repository, secondary research, competitor’s sources, social media research, client internal data, and primary research.
Our team of analysts prefers the most reliable and authenticated data sources in order to perform the comprehensive literature search. With access to most of the authenticated data bases our team highly considers the best mix of information through various sources to obtain extensive and accurate analysis.
Each report takes an average time of a month and a team of 4 industry analysts. The time may vary depending on the scope and data availability of the desired market report. The various parameters used in the market assessment are standardized in order to enhance the data accuracy.
Data Mining
The data is collected from several authenticated, reliable, paid and unpaid sources and is filtered depending on the scope & objective of the research. Our reports repository acts as an added advantage in this procedure. Data gathering from the raw material suppliers, distributors and the manufacturers is performed on a regular basis, this helps in the comprehensive understanding of the products value chain. Apart from the above mentioned sources the data is also collected from the industry consultants to ensure the objective of the study is in the right direction.
Market trends such as technological advancements, regulatory affairs, market dynamics (Drivers, Restraints, Opportunities and Challenges) are obtained from scientific journals, market related national & international associations and organizations.
Data Analysis
From the data that is collected depending on the scope & objective of the research the data is subjected for the analysis. The critical steps that we follow for the data analysis include:
- Product Lifecycle Analysis
- Competitor analysis
- Risk analysis
- Porters Analysis
- PESTEL Analysis
- SWOT Analysis
The data engineering is performed by the core industry experts considering both the Marketing Mix Modeling and the Demand Forecasting. The marketing mix modeling makes use of multiple-regression techniques to predict the optimal mix of marketing variables. Regression factor is based on a number of variables and how they relate to an outcome such as sales or profits.
Data Validation
The data validation is performed by the exhaustive primary research from the expert interviews. This includes telephonic interviews, focus groups, face to face interviews, and questionnaires to validate our research from all aspects. The industry experts we approach come from the leading firms, involved in the supply chain ranging from the suppliers, distributors to the manufacturers and consumers so as to ensure an unbiased analysis.
We are in touch with more than 15,000 industry experts with the right mix of consultants, CEO's, presidents, vice presidents, managers, experts from both supply side and demand side, executives and so on.
The data validation involves the primary research from the industry experts belonging to:
- Leading Companies
- Suppliers & Distributors
- Manufacturers
- Consumers
- Industry/Strategic Consultants
Apart from the data validation the primary research also helps in performing the fill gap research, i.e. providing solutions for the unmet needs of the research which helps in enhancing the reports quality.
For more details about research methodology, kindly write to us at info@strategymrc.com
Frequently Asked Questions
In case of any queries regarding this report, you can contact the customer service by filing the “Inquiry Before Buy” form available on the right hand side. You may also contact us through email: info@strategymrc.com or phone: +1-301-202-5929
Yes, the samples are available for all the published reports. You can request them by filling the “Request Sample” option available in this page.
Yes, you can request a sample with your specific requirements. All the customized samples will be provided as per the requirement with the real data masked.
All our reports are available in Digital PDF format. In case if you require them in any other formats, such as PPT, Excel etc you can submit a request through “Inquiry Before Buy” form available on the right hand side. You may also contact us through email: info@strategymrc.com or phone: +1-301-202-5929
We offer a free 15% customization with every purchase. This requirement can be fulfilled for both pre and post sale. You may send your customization requirements through email at info@strategymrc.com or call us on +1-301-202-5929.
We have 3 different licensing options available in electronic format.
- Single User Licence: Allows one person, typically the buyer, to have access to the ordered product. The ordered product cannot be distributed to anyone else.
- 2-5 User Licence: Allows the ordered product to be shared among a maximum of 5 people within your organisation.
- Corporate License: Allows the product to be shared among all employees of your organisation regardless of their geographical location.
All our reports are typically be emailed to you as an attachment.
To order any available report you need to register on our website. The payment can be made either through CCAvenue or PayPal payments gateways which accept all international cards.
We extend our support to 6 months post sale. A post sale customization is also provided to cover your unmet needs in the report.
Request Customization
We offer complimentary customization of up to 15% with every purchase. To share your customization requirements, feel free to email us at info@strategymrc.com or call us on +1-301-202-5929. .
Please Note: Customization within the 15% threshold is entirely free of charge. If your request exceeds this limit, we will conduct a feasibility assessment. Following that, a detailed quote and timeline will be provided.
WHY CHOOSE US ?

Assured Quality
Best in class reports with high standard of research integrity

24X7 Research Support
Continuous support to ensure the best customer experience.

Free Customization
Adding more values to your product of interest.

Safe & Secure Access
Providing a secured environment for all online transactions.

Trusted by 600+ Brands
Serving the most reputed brands across the world.