
Integrated Bridge Systems Market
Integrated Bridge Systems Market Forecasts to 2028 - Global Analysis By Component (Hardware, Software and Other Components), Ship Type (Commercial Ships, Defense Ships, Other Ship Types), Sub-System (Indian Navy Ship (INS), Telecommunication & IT, Voyage Data Recorder and Other Sub-Systems), End User and Geography

|
Years Covered |
2020-2028 |
|
Estimated Year Value (2022) |
US $6.1 BN |
|
Projected Year Value (2028) |
US $9.3 BN |
|
CAGR (2022 - 2028) |
7.4% |
|
Regions Covered |
North America, Europe, Asia Pacific, South America, and Middle East & Africa |
|
Countries Covered |
US, Canada, Mexico, Germany, UK, Italy, France, Spain, Japan, China, India, Australia, New Zealand, South Korea, Rest of Asia Pacific, South America, Argentina, Brazil, Chile, Middle East & Africa, Saudi Arabia, UAE, Qatar, and South Africa |
|
Largest Market |
Asia Pacific |
|
Fastest Growing Market |
North America |
According to Stratistics MRC, the Global Integrated Bridge Systems Market is accounted for $6.1 billion in 2022 and is expected to reach $9.3 billion by 2028 growing at a CAGR of 7.4% during the forecast period. An integrated bridge system (IBS) is a collection of interconnected technologies that enables workstations to have centralised access to sensor data or command and control in order to improve the safe and effective administration of ships by appropriately certified personnel. In order to manage and manoeuvre the vessels in a specific direction as well as to help with surveillance, navigation systems are connected with other components such multifunctional consoles, radars, motion sensors, and GPS. The seamless integration of numerous sensors on a single platform is IBS's key benefit.
Market Dynamics:
Driver:
Rising preference for maritime tourism
The demand for cruise ships, ferries, and other passenger transport vessels gradually rises as marine tourism expands. There are many rules established for this maritime tourist sector because it is a significant source of income for countries. Tourism has been steadily increasing, which has benefited the marine industry. The leisure travel market's fastest-growing industry is this one. Modern systems are being adopted by passenger ships to improve customer service and safety as well as navigation and communication. These cutting-edge solutions are offered by major industry participants in integrated bridge systems, such Northrop Grumman, for recreational uses. Opportunities for expansion for both producers of integrated bridge systems and shipbuilders are anticipated to increase with the growth of the maritime tourism sector.
Restraint:
Digitalization leading to cyber threats
The maritime sector is continuously advancing in terms of digitalization. Worldwide ship digitization creates new cyber concerns. Due to the employment of satellites in a vessel to shore connectivity, the integration of navigational equipment and can lead to cyber threats. The management of cyber risk needs to be prioritised more in order to sustain safe vessel operation. Because of navigational satellites, cyber incidents such as data corruption in an ECDIS and the loss of external sensor data might occur in ships. According to the International Chamber of Shipping, bridge systems that are not connected to other networks are just as vulnerable because such systems are frequently updated from other networks using removable media. The ECDIS, AIS, VDR, and radar components of integrated bridge systems may not be available, and they may be impacted by a cyber threat. As online threats and attacks are on the rise, the maritime safety committee (MSC) of the international maritime organisation has established provisional recommendations to avoid cyber attacks on ship systems.
Opportunity:
Precise navigational safety standards & regulations
According to the International Maritime Organization's (IMO) recommendations, nations like the US, the UK, and India are updating and implementing maritime safety regulations. As a result, global safety requirements are becoming more uniform. Because of this, manufacturers of integrated bridge systems have been able to win contracts from numerous businesses, expanding their presence and guaranteeing the quality of their goods. A standard for E-navigation systems, which link onshore and offshore activities to improve coordination, is being finalised by the IMO. Small and large businesses in the integrated bridge systems market can create appropriate goods and effectively sell them as a result of the introduction of these standards. Products produced in accordance with IMO criteria have greater market credibility.
Threat:
Lack of skilled IBS operators
A trained workforce will be needed for the building of new, technologically advanced ships and port infrastructure (to fulfil the growing demand for seaborne trade) and for IMO regulation of many areas of marine transportation (such as safety, security, and environmental protection). Radar, ECDIS, and Gyrocompass are only a few of the many interconnected parts that make up integrated bridge systems. The ship crew must receive extensive training in order to successfully operate these technologies. The expense of training is quite high because it necessitates the purchase of pricey simulators. Inadequate staff training and an over-reliance on e-navigation can also contribute to maritime mishaps. Meeting the bare minimum training requirements is insufficient; police should have access to rigorous training. Therefore, shipping businesses face a hurdle in using these new technologies.
Covid-19 Impact
The pandemic caused a reduction in the workforce across many industries, including the market for integrated bridge systems, which caused the market to suffer significant losses during that time. Several manufacturers paused their activity in order to improve shutdown. Due to a lack of manufacturing supplies, many technological industries experienced market share losses. Due to the ban on internal travel to mitigate the impact of the COVID 19, the tourism industry and maritime trade were also put on hold for an extended period of time. The supply chain disruption and decreased production of raw materials have a negative impact on the market for integrated bridge systems.
The commercial ships segment is expected to be the largest during the forecast period
The commercial ships segment is estimated to have a lucrative growth, due to the rapid expansion of global seaborne trade, the appeal of ship-based marine tourism, and the rapidly growing number of port cities. Additionally, it is anticipated that increasing offshore resource exploration as well as rising import and export operations among numerous nations will propel the market for this segment.
The original equipment manufacturer (OEM) segment is expected to have the highest CAGR during the forecast period
The original equipment manufacturer (OEM) segment is anticipated to witness the fastest CAGR growth during the forecast period, due to it is primarily spurred by the quickly expanding demand for navy ships outfitted with cutting-edge integrated bridge systems. Additionally, OEM's capacity to integrate various solutions into a single system and its high level of scalability and modularity are projected to considerably fuel market expansion.
Region with highest share:
Asia Pacific is projected to hold the largest market share during the forecast period owing to the increase in cruising and fishing activities as well as the expanding need for merchant ships in China are credited with this expansion. The market is anticipated to be supported by South Korea's expanding shipbuilding industry. 90% of shipbuilding activity worldwide was accounted for by China, Japan, and South Korea, according to a report from the United Nations Conference on Trade and Development (UNCTAD).
Region with highest CAGR:
North America is projected to have the highest CAGR over the forecast period, owing to the majority of integrated bridge system developers are situated in North America; the region is expected to account for a sizeable portion of the market. The growing need for these systems in the United States is due to the navy's rising defence budget. Additionally, it is anticipated that increasing exports and Canadian economic growth will stimulate the market.

Key players in the market
Some of the key players profiled in the Integrated Bridge Systems Market include Consilium Marine & Safety Ab, Danelec Marine A/S, DSME Co., Ltd., Alphatron Marine B.V., Hensoldt UK, Kongsberg, The Raytheon Company, Wärtsilä Oyj Abp, Tokyo Keiki Inc., Prime Mover Controls Inc., Praxis Automation Technology B.V., OSI Maritime Systems, Northrop Grumman Corporation, Mackay Communications, Inc., Marine Technologies LLC, Japan Radio Co., LTD., L3 Mapps Inc., Furuno Electric Co. LTD., Gem Elettronica and Noris Group GmbH.
Key Developments:
In September 2019, Raytheon Anschütz and the U.K. Royal Navy signed a contract to deliver Warship Integrated Navigation and Bridge Systems for UK Royal Navy’s Type 31e Frigates.
Components Covered:
• Hardware
• Software
• Other Components
Ship Types Covered:
• Commercial Ships
• Defense Ships
• Other Ship Types
Sub-Systems Covered:
• Indian Navy Ship (INS)
• Automatic Weather Observation System (AWOS)
• Voyage Data Recorder
• Automatic Identification System (AIS)
• Other Sub-Systems
End Users Covered:
• Original Equipment Manufacturer (OEM)
• Aftermarket
• Other End Users
Regions Covered:
• North America
o US
o Canada
o Mexico
• Europe
o Germany
o UK
o Italy
o France
o Spain
o Rest of Europe
• Asia Pacific
o Japan
o China
o India
o Australia
o New Zealand
o South Korea
o Rest of Asia Pacific
• South America
o Argentina
o Brazil
o Chile
o Rest of South America
• Middle East & Africa
o Saudi Arabia
o UAE
o Qatar
o South Africa
o Rest of Middle East & Africa
What our report offers:
- Market share assessments for the regional and country-level segments
- Strategic recommendations for the new entrants
- Covers Market data for the years 2020, 2021, 2022, 2025, and 2028
- Market Trends (Drivers, Constraints, Opportunities, Threats, Challenges, Investment Opportunities, and recommendations)
- Strategic recommendations in key business segments based on the market estimations
- Competitive landscaping mapping the key common trends
- Company profiling with detailed strategies, financials, and recent developments
- Supply chain trends mapping the latest technological advancements
Free Customization Offerings:
All the customers of this report will be entitled to receive one of the following free customization options:
• Company Profiling
o Comprehensive profiling of additional market players (up to 3)
o SWOT Analysis of key players (up to 3)
• Regional Segmentation
o Market estimations, Forecasts and CAGR of any prominent country as per the client's interest (Note: Depends on feasibility check)
• Competitive Benchmarking
o Benchmarking of key players based on product portfolio, geographical presence, and strategic alliances
Table of Contents
1 Executive Summary
2 Preface
2.1 Abstract
2.2 Stake Holders
2.3 Research Scope
2.4 Research Methodology
2.4.1 Data Mining
2.4.2 Data Analysis
2.4.3 Data Validation
2.4.4 Research Approach
2.5 Research Sources
2.5.1 Primary Research Sources
2.5.2 Secondary Research Sources
2.5.3 Assumptions
3 Market Trend Analysis
3.1 Introduction
3.2 Drivers
3.3 Restraints
3.4 Opportunities
3.5 Threats
3.6 End User Analysis
3.7 Emerging Markets
3.8 Impact of Covid-19
4 Porters Five Force Analysis
4.1 Bargaining power of suppliers
4.2 Bargaining power of buyers
4.3 Threat of substitutes
4.4 Threat of new entrants
4.5 Competitive rivalry
5 Global Integrated Bridge Systems Market, By Component
5.1 Introduction
5.2 Hardware
5.2.1 Control Unit
5.2.2 Data Storage Devices
5.2.3 Sensors
5.2.4 Alarms
5.2.5 Display
5.3 Software
5.4 Other Components
6 Global Integrated Bridge Systems Market, By Ship Type
6.1 Introduction
6.2 Commercial Ships
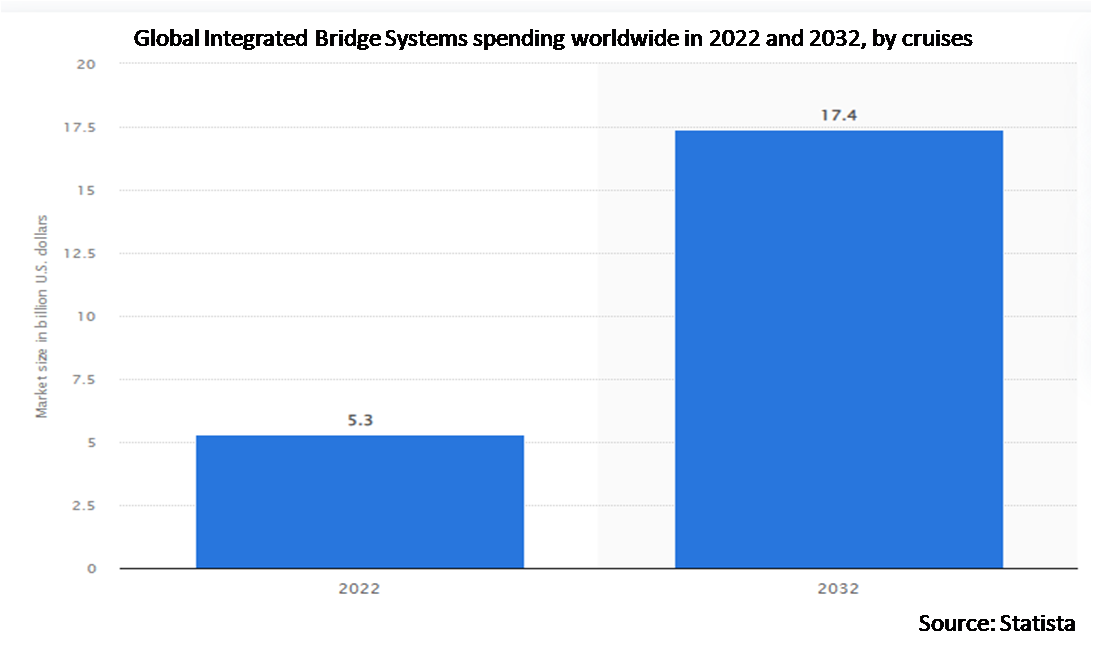
6.2.1 Cruises
6.2.2 Dry Cargo
6.2.3 Bulk Carrier
6.2.4 Gas Tankers
6.2.5 Dredgers
6.2.6 Offshore Supply and Passenger Ferry
6.2.7 Tankers
6.2.8 Research Vessel
6.3 Defense Ships
6.3.1 Corvettes
6.3.2 Destroyers
6.3.3 Frigates
6.3.4 Amphibious Ship
6.3.5 Aircraft Carriers
6.3.6 Minesweepers
6.3.7 OPV's
6.3.8 Submarine
6.3.9 Missile Carrying Boats and Supply Boats
6.4 Other Ship Types
7 Global Integrated Bridge Systems Market, By Sub-System
7.1 Introduction
7.2 Indian Navy Ship (INS)
7.2.1 Advanced Research Projects Agency (ARPA)
7.2.2 Navigation Radar
7.2.3 Gyros
7.2.4 Electro Magnetic Log
7.2.5 Echo Sounder
7.2.6 Bridge Communication Console
7.2.7 Auto Pilot
7.2.8 Transmitting Magnetic Compass
7.2.9 Electronic Chart Display and Information Systems (ECDIS)
7.2.10 Bridge Navigational Watch & Alarm System (BNWAS)
7.3 Automatic Weather Observation System (AWOS)
7.4 Voyage Data Recorder
7.5 Automatic Identification System (AIS)
7.6 Other Sub-Systems
8 Global Integrated Bridge Systems Market, By End User
8.1 Introduction
8.2 Original Equipment Manufacturer (OEM)
8.2.1 Commercial
8.2.2 Defence
8.3 Aftermarket
8.3.1 Maintenance
8.3.2 Parts
8.4 Other End Users
9 Global Integrated Bridge Systems Market, By Geography
9.1 Introduction
9.2 North America
9.2.1 US
9.2.2 Canada
9.2.3 Mexico
9.3 Europe
9.3.1 Germany
9.3.2 UK
9.3.3 Italy
9.3.4 France
9.3.5 Spain
9.3.6 Rest of Europe
9.4 Asia Pacific
9.4.1 Japan
9.4.2 China
9.4.3 India
9.4.4 Australia
9.4.5 New Zealand
9.4.6 South Korea
9.4.7 Rest of Asia Pacific
9.5 South America
9.5.1 Argentina
9.5.2 Brazil
9.5.3 Chile
9.5.4 Rest of South America
9.6 Middle East & Africa
9.6.1 Saudi Arabia
9.6.2 UAE
9.6.3 Qatar
9.6.4 South Africa
9.6.5 Rest of Middle East & Africa
10 Key Developments
10.1 Agreements, Partnerships, Collaborations and Joint Ventures
10.2 Acquisitions & Mergers
10.3 New Product Launch
10.4 Expansions
10.5 Other Key Strategies
11 Company Profiling
11.1 Consilium Marine & Safety Ab
11.2 Danelec Marine A/S
11.3 DSME Co., Ltd.
11.4 Alphatron Marine B.V.
11.5 Hensoldt UK
11.6 Kongsberg
11.7 The Raytheon Company
11.8 Wärtsilä Oyj Abp
11.9 Tokyo Keiki Inc.
11.10 Prime Mover Controls Inc.
11.11 Praxis Automation Technology B.V.
11.12 OSI Maritime Systems
11.13 Northrop Grumman Corporation
11.14 Mackay Communications, Inc.
11.15 Marine Technologies LLC
11.16 Japan Radio Co., LTD.
11.17 L3 Mapps Inc.
11.18 Furuno Electric Co. LTD.
11.19 Gem Elettronica
11.20 Noris Group GmbH
List of Tables
1 Global Integrated Bridge Systems Market Outlook, By Region (2020-2028) ($MN)
2 Global Integrated Bridge Systems Market Outlook, By Component (2020-2028) ($MN)
3 Global Integrated Bridge Systems Market Outlook, By Hardware (2020-2028) ($MN)
4 Global Integrated Bridge Systems Market Outlook, By Control Unit (2020-2028) ($MN)
5 Global Integrated Bridge Systems Market Outlook, By Data Storage Devices (2020-2028) ($MN)
6 Global Integrated Bridge Systems Market Outlook, By Sensors (2020-2028) ($MN)
7 Global Integrated Bridge Systems Market Outlook, By Alarms (2020-2028) ($MN)
8 Global Integrated Bridge Systems Market Outlook, By Display (2020-2028) ($MN)
9 Global Integrated Bridge Systems Market Outlook, By Software (2020-2028) ($MN)
10 Global Integrated Bridge Systems Market Outlook, By Other Components (2020-2028) ($MN)
11 Global Integrated Bridge Systems Market Outlook, By Ship Type (2020-2028) ($MN)
12 Global Integrated Bridge Systems Market Outlook, By Commercial Ships (2020-2028) ($MN)
13 Global Integrated Bridge Systems Market Outlook, By Cruises (2020-2028) ($MN)
14 Global Integrated Bridge Systems Market Outlook, By Dry Cargo (2020-2028) ($MN)
15 Global Integrated Bridge Systems Market Outlook, By Bulk Carrier (2020-2028) ($MN)
16 Global Integrated Bridge Systems Market Outlook, By Gas Tankers (2020-2028) ($MN)
17 Global Integrated Bridge Systems Market Outlook, By Dredgers (2020-2028) ($MN)
18 Global Integrated Bridge Systems Market Outlook, By Offshore Supply and Passenger Ferry (2020-2028) ($MN)
19 Global Integrated Bridge Systems Market Outlook, By Tankers (2020-2028) ($MN)
20 Global Integrated Bridge Systems Market Outlook, By Research Vessel (2020-2028) ($MN)
21 Global Integrated Bridge Systems Market Outlook, By Defense Ships (2020-2028) ($MN)
22 Global Integrated Bridge Systems Market Outlook, By Corvettes (2020-2028) ($MN)
23 Global Integrated Bridge Systems Market Outlook, By Destroyers (2020-2028) ($MN)
24 Global Integrated Bridge Systems Market Outlook, By Frigates (2020-2028) ($MN)
25 Global Integrated Bridge Systems Market Outlook, By Amphibious Ship (2020-2028) ($MN)
26 Global Integrated Bridge Systems Market Outlook, By Aircraft Carriers (2020-2028) ($MN)
27 Global Integrated Bridge Systems Market Outlook, By Minesweepers (2020-2028) ($MN)
28 Global Integrated Bridge Systems Market Outlook, By OPV's (2020-2028) ($MN)
29 Global Integrated Bridge Systems Market Outlook, By Submarine (2020-2028) ($MN)
30 Global Integrated Bridge Systems Market Outlook, By Missile Carrying Boats and Supply Boats (2020-2028) ($MN)
31 Global Integrated Bridge Systems Market Outlook, By Other Ship Types (2020-2028) ($MN)
32 Global Integrated Bridge Systems Market Outlook, By Sub-System (2020-2028) ($MN)
33 Global Integrated Bridge Systems Market Outlook, By Indian Navy Ship (INS) (2020-2028) ($MN)
34 Global Integrated Bridge Systems Market Outlook, By Advanced Research Projects Agency (ARPA) (2020-2028) ($MN)
35 Global Integrated Bridge Systems Market Outlook, By Navigation Radar (2020-2028) ($MN)
36 Global Integrated Bridge Systems Market Outlook, By Gyros (2020-2028) ($MN)
37 Global Integrated Bridge Systems Market Outlook, By Electro Magnetic Log (2020-2028) ($MN)
38 Global Integrated Bridge Systems Market Outlook, By Echo Sounder (2020-2028) ($MN)
39 Global Integrated Bridge Systems Market Outlook, By Bridge Communication Console (2020-2028) ($MN)
40 Global Integrated Bridge Systems Market Outlook, By Auto Pilot (2020-2028) ($MN)
41 Global Integrated Bridge Systems Market Outlook, By Transmitting Magnetic Compass (2020-2028) ($MN)
42 Global Integrated Bridge Systems Market Outlook, By Electronic Chart Display and Information Systems (ECDIS) (2020-2028) ($MN)
43 Global Integrated Bridge Systems Market Outlook, By Bridge Navigational Watch & Alarm System (BNWAS) (2020-2028) ($MN)
44 Global Integrated Bridge Systems Market Outlook, By Automatic Weather Observation System (AWOS) (2020-2028) ($MN)
45 Global Integrated Bridge Systems Market Outlook, By Voyage Data Recorder (2020-2028) ($MN)
46 Global Integrated Bridge Systems Market Outlook, By Automatic Identification System (AIS) (2020-2028) ($MN)
47 Global Integrated Bridge Systems Market Outlook, By Other Sub-Systems (2020-2028) ($MN)
48 Global Integrated Bridge Systems Market Outlook, By End User (2020-2028) ($MN)
49 Global Integrated Bridge Systems Market Outlook, By Original Equipment Manufacturer (OEM) (2020-2028) ($MN)
50 Global Integrated Bridge Systems Market Outlook, By Commercial (2020-2028) ($MN)
51 Global Integrated Bridge Systems Market Outlook, By Defence (2020-2028) ($MN)
52 Global Integrated Bridge Systems Market Outlook, By Aftermarket (2020-2028) ($MN)
53 Global Integrated Bridge Systems Market Outlook, By Maintenance (2020-2028) ($MN)
54 Global Integrated Bridge Systems Market Outlook, By Parts (2020-2028) ($MN)
55 Global Integrated Bridge Systems Market Outlook, By Other End Users (2020-2028) ($MN)
Note: Tables for North America, Europe, APAC, South America, and Middle East & Africa Regions are also represented in the same manner as above.
List of Figures
RESEARCH METHODOLOGY

We at ‘Stratistics’ opt for an extensive research approach which involves data mining, data validation, and data analysis. The various research sources include in-house repository, secondary research, competitor’s sources, social media research, client internal data, and primary research.
Our team of analysts prefers the most reliable and authenticated data sources in order to perform the comprehensive literature search. With access to most of the authenticated data bases our team highly considers the best mix of information through various sources to obtain extensive and accurate analysis.
Each report takes an average time of a month and a team of 4 industry analysts. The time may vary depending on the scope and data availability of the desired market report. The various parameters used in the market assessment are standardized in order to enhance the data accuracy.
Data Mining
The data is collected from several authenticated, reliable, paid and unpaid sources and is filtered depending on the scope & objective of the research. Our reports repository acts as an added advantage in this procedure. Data gathering from the raw material suppliers, distributors and the manufacturers is performed on a regular basis, this helps in the comprehensive understanding of the products value chain. Apart from the above mentioned sources the data is also collected from the industry consultants to ensure the objective of the study is in the right direction.
Market trends such as technological advancements, regulatory affairs, market dynamics (Drivers, Restraints, Opportunities and Challenges) are obtained from scientific journals, market related national & international associations and organizations.
Data Analysis
From the data that is collected depending on the scope & objective of the research the data is subjected for the analysis. The critical steps that we follow for the data analysis include:
- Product Lifecycle Analysis
- Competitor analysis
- Risk analysis
- Porters Analysis
- PESTEL Analysis
- SWOT Analysis
The data engineering is performed by the core industry experts considering both the Marketing Mix Modeling and the Demand Forecasting. The marketing mix modeling makes use of multiple-regression techniques to predict the optimal mix of marketing variables. Regression factor is based on a number of variables and how they relate to an outcome such as sales or profits.
Data Validation
The data validation is performed by the exhaustive primary research from the expert interviews. This includes telephonic interviews, focus groups, face to face interviews, and questionnaires to validate our research from all aspects. The industry experts we approach come from the leading firms, involved in the supply chain ranging from the suppliers, distributors to the manufacturers and consumers so as to ensure an unbiased analysis.
We are in touch with more than 15,000 industry experts with the right mix of consultants, CEO's, presidents, vice presidents, managers, experts from both supply side and demand side, executives and so on.
The data validation involves the primary research from the industry experts belonging to:
- Leading Companies
- Suppliers & Distributors
- Manufacturers
- Consumers
- Industry/Strategic Consultants
Apart from the data validation the primary research also helps in performing the fill gap research, i.e. providing solutions for the unmet needs of the research which helps in enhancing the reports quality.
For more details about research methodology, kindly write to us at info@strategymrc.com
Frequently Asked Questions
In case of any queries regarding this report, you can contact the customer service by filing the “Inquiry Before Buy” form available on the right hand side. You may also contact us through email: info@strategymrc.com or phone: +1-301-202-5929
Yes, the samples are available for all the published reports. You can request them by filling the “Request Sample” option available in this page.
Yes, you can request a sample with your specific requirements. All the customized samples will be provided as per the requirement with the real data masked.
All our reports are available in Digital PDF format. In case if you require them in any other formats, such as PPT, Excel etc you can submit a request through “Inquiry Before Buy” form available on the right hand side. You may also contact us through email: info@strategymrc.com or phone: +1-301-202-5929
We offer a free 15% customization with every purchase. This requirement can be fulfilled for both pre and post sale. You may send your customization requirements through email at info@strategymrc.com or call us on +1-301-202-5929.
We have 3 different licensing options available in electronic format.
- Single User Licence: Allows one person, typically the buyer, to have access to the ordered product. The ordered product cannot be distributed to anyone else.
- 2-5 User Licence: Allows the ordered product to be shared among a maximum of 5 people within your organisation.
- Corporate License: Allows the product to be shared among all employees of your organisation regardless of their geographical location.
All our reports are typically be emailed to you as an attachment.
To order any available report you need to register on our website. The payment can be made either through CCAvenue or PayPal payments gateways which accept all international cards.
We extend our support to 6 months post sale. A post sale customization is also provided to cover your unmet needs in the report.
Request Customization
We offer complimentary customization of up to 15% with every purchase. To share your customization requirements, feel free to email us at info@strategymrc.com or call us on +1-301-202-5929. .
Please Note: Customization within the 15% threshold is entirely free of charge. If your request exceeds this limit, we will conduct a feasibility assessment. Following that, a detailed quote and timeline will be provided.
WHY CHOOSE US ?

Assured Quality
Best in class reports with high standard of research integrity

24X7 Research Support
Continuous support to ensure the best customer experience.

Free Customization
Adding more values to your product of interest.

Safe & Secure Access
Providing a secured environment for all online transactions.

Trusted by 600+ Brands
Serving the most reputed brands across the world.