
Offshore Hydrogen Market
Offshore Hydrogen Market Forecasts to 2034 – Global Analysis By Production Architecture (Offshore Wind with Onshore Electrolysis, Centralized Offshore Electrolysis Platform, Electrolysis Integrated with Offshore Wind Turbines, and Floating Wind-to-Hydrogen Systems), Electrolyzer Technology, Offshore Structure, Storage and Transport, End-Use Application, and By Geography

Market Dynamics:
Driver:
Industrial hydrogen demand creates an outlet for offshore wind resources
Refineries, chemical plants and emerging low-emission fuel producers need alternatives to hydrogen made from fossil feedstocks. Offshore wind can provide substantial renewable electricity near coastal industrial clusters, connecting generation resources with concentrated potential demand. Converting part of that electricity into hydrogen may also offer an additional export route where power network constraints limit direct delivery. The commercial driver is strongest when industrial customers can commit to sustained offtake and nearby infrastructure reduces transport complexity. Such arrangements make it possible to coordinate wind generation, electrolyzer utilization and hydrogen delivery within a coherent project rather than as separate speculative investments.
Restraint:
Marine installation raises costs before operating experience is established
Offshore electrolyzers must perform within restricted platform space while exposed to salt, motion and difficult access. Water purification, cooling, ventilation and electrical equipment require marine-compatible designs, and maintenance may depend on vessel availability and favorable weather. These requirements add expense beyond the electrolyzer itself. Developers also have limited operating records from which to establish availability guarantees, insurance terms or realistic maintenance budgets. The resulting uncertainty raises financing costs and slows the transition from demonstration to commercial scale. Onshore electrolysis supplied by offshore electricity can avoid some marine difficulties, which complicates the investment case for placing conversion equipment at sea.
Opportunity:
Repurposing offshore infrastructure around coastal hydrogen clusters
Existing offshore platforms, export corridors and coastal industrial sites offer opportunities to reduce the infrastructure burden of new hydrogen projects. Reuse is conditional on structural integrity, material compatibility and safety assessments, but it can create a practical route for testing integrated systems. Demonstrators can establish operating procedures for variable wind input, seawater treatment and remote control before larger installations are designed. Suppliers may then commercialize validated modules, inspection services and control software across multiple projects. The most credible opportunities combine these technical learning benefits with identified industrial customers, avoiding dependence on a future hydrogen market that has yet to materialize.
Threat:
Weak offtake commitments and competing supply routes delay commercialization
A technically successful offshore pilot does not guarantee that customers will accept the resulting hydrogen price. Industrial buyers may defer conversion, retain conventional hydrogen or compare imported derivatives with locally produced supply. At the same time, offshore wind cost increases can undermine the electricity assumptions embedded in project models. Changes to subsidy eligibility or renewable hydrogen certification add further uncertainty across long development periods. If production, pipelines and customer facilities progress on different schedules, otherwise viable assets can remain underused. These commercial coordination risks threaten investment decisions even where marine engineering challenges have been addressed satisfactorily.
Covid-19 Impact:
COVID-19 affected offshore hydrogen mainly through its early project development and equipment supply chains. Restrictions on travel and marine operations made collaborative engineering, testing and offshore installation more difficult, while disrupted electrolyzer and electrical component deliveries complicated demonstration schedules. Many projects were still at planning or pilot stages, so the effect was more visible in milestones than in lost commercial hydrogen production. The subsequent emphasis on energy security and industrial decarbonization renewed interest in domestic renewable supply. Nevertheless, post-pandemic cost increases and procurement delays reinforced the importance of conservative schedules and staged investment commitments.
The Offshore Wind with Onshore Electrolysis segment is expected to be the largest during the forecast period
Offshore Wind with Onshore Electrolysis is expected to hold the largest architecture share because it combines an established marine generation model with conversion equipment that remains accessible on land. Developers can locate electrolyzers near industrial customers, water supplies and hydrogen networks while using conventional electricity connections from offshore wind farms. Maintenance and expansion are generally easier than on remote platforms, and supporting equipment faces fewer marine constraints. Shell's Holland Hydrogen 1 illustrates this architecture through its intended use of offshore wind electricity at a coastal industrial site. These practical advantages support earlier commercialization and larger individual investments relative to more experimental offshore configurations.
The Centralized Offshore Electrolysis Platform segment is expected to have the highest CAGR during the forecast period
Centralized Offshore Electrolysis Platform is projected to achieve the highest CAGR as demonstration learning is translated into larger integrated installations. Grouping electrolyzers on a dedicated platform can consolidate water treatment, compression and export equipment while preserving access to nearby wind resources. This architecture also creates a clearer operational boundary for maintenance and safety management than distributing conversion systems among numerous turbines. Projects such as HOPE are intended to test the technical and logistical steps needed for this progression. Growth starts from a limited base and remains conditional on competitive hydrogen transport, reliable operations and firm customer commitments supporting commercial deployment.
Region with largest share:
Europe is expected to account for the largest regional share because offshore wind resources, coastal industrial demand and active demonstration programs are closely connected around the North Sea. Projects in France, Belgium and the Netherlands are testing floating production, centralized offshore platforms and integration with existing gas infrastructure. European industrial clusters also offer potential users for hydrogen and access to developing transport networks. These conditions provide a foundation for coordinated investment and knowledge transfer between projects. The regional outlook reflects the concentration of practical development activity, while recognizing that many announced capacities still depend on permits, funding and final investment decisions.
Region with highest CAGR:
Europe is also anticipated to register the highest CAGR as current demonstrations establish a potential pathway toward larger offshore production systems. HOPE's planned platform and pipeline configuration, together with PosHYdon's operating experience, provides evidence relevant to equipment design, permitting and offshore maintenance. Expanding deployment from a small commercial base could create rapid growth if industrial offtake and export infrastructure advance together. The forecast depends on these projects converting technical learning into financeable operating models. Regional collaboration across developers, research institutions and infrastructure owners offers a practical advantage in addressing shared problems without assuming that every announced project will proceed.
Key players in the market
Some of the key players in the Offshore Hydrogen Market include Ørsted A/S, Equinor ASA, RWE AG, Shell plc, TotalEnergies SE, Iberdrola, S.A., Copenhagen Infrastructure Partners, Siemens Energy AG, Nel ASA, Plug Power Inc., ITM Power plc, thyssenkrupp nucera AG & Co. KGaA, McPhy Energy S.A., Lhyfe, and Vestas Wind Systems A/S.
Key Developments:
In July 2026, the PosHYdon consortium announced successful green hydrogen production on the operational Q13a-A platform in the Dutch North Sea. The pilot combined offshore energy systems and began gathering practical data on electrolyzer response, offshore maintenance and operating performance, strengthening the evidence base for future marine hydrogen projects.
In May 2025, the HOPE project announced public consultation on Lhyfe Oostende's environmental and Natura 2000 permit application for an offshore hydrogen platform near Ostend. The proposed installation included electrolysis, a hydrogen pipeline to shore and an electricity cable. The consultation advanced the permitting process for the proposed facility.
In January 2024, Lhyfe reported that its Sealhyfe offshore hydrogen pilot had met its initial objectives after 14 months of testing. The company said the platform returned with its production capacity intact and that lessons from the program were being incorporated into subsequent onshore and offshore developments.
Production Architectures Covered:
• Offshore Wind with Onshore Electrolysis
• Centralized Offshore Electrolysis Platform
• Electrolysis Integrated with Offshore Wind Turbines
• Floating Wind-to-Hydrogen Systems
Electrolyzer Technologies Covered:
• Proton Exchange Membrane (PEM)
• Alkaline Electrolysis
• Solid Oxide Electrolysis
Offshore Structures Covered:
• Fixed-Bottom Platforms
• Floating Platforms and Barges
• Repurposed Offshore Energy Infrastructure
Storage and Transport Options Covered:
• Subsea Hydrogen Pipelines
• Compressed Hydrogen
• Liquid Hydrogen
• Ammonia and Other Hydrogen Carriers
End-Use Applications Covered:
• Industrial Decarbonization
• Ammonia and E-Fuel Production
• Power System Balancing
• Shipping and Maritime Fuels
Regions Covered:
• North America
o United States
o Canada
o Mexico
• Europe
o United Kingdom
o Germany
o France
o Italy
o Spain
o Netherlands
o Belgium
o Sweden
o Switzerland
o Poland
o Rest of Europe
• Asia Pacific
o China
o Japan
o India
o South Korea
o Australia
o Indonesia
o Thailand
o Malaysia
o Singapore
o Vietnam
o Rest of Asia Pacific
• South America
o Brazil
o Argentina
o Colombia
o Chile
o Peru
o Rest of South America
• Rest of the World (RoW)
o Middle East
Saudi Arabia
United Arab Emirates
Qatar
Israel
Rest of Middle East
o Africa
South Africa
Egypt
Morocco
Rest of Africa
What our report offers:
- Market share assessments for regional and country-level segments
- Strategic recommendations for new entrants in the offshore hydrogen industry
- Market data for the years 2023, 2024, 2025, 2026, 2027, 2028, 2030, 2032 and 2034
- Analysis of market trends, drivers, constraints, opportunities, threats, challenges and investment opportunities, with recommendations
- Strategic recommendations in key business segments based on market estimations
- Competitive landscape mapping of the main industry trends
- Company profiling covering detailed strategies, financials and recent developments
- Supply chain trends and the latest technological advancements
Free Customization Offerings:
All customers of this report are entitled to receive one of the following free customization options:
• Company Profiling
o Comprehensive profiling of additional market players (up to 3)
o SWOT Analysis of key players (up to 3)
• Regional Segmentation
o Market estimations, forecasts and CAGR for any prominent country of interest to the client (Note: Depends on feasibility check)
• Competitive Benchmarking
o Benchmarking of key players based on product portfolio, geographical presence and strategic alliances
Table of Contents
1 Executive Summary1.1 Market Snapshot and Key Highlights
1.2 Growth Drivers, Challenges, and Opportunities
1.3 Competitive Landscape Overview
1.4 Strategic Insights and Recommendations
2 Research Framework
2.1 Study Objectives and Scope
2.2 Stakeholder Analysis
2.3 Research Assumptions and Limitations
2.4 Research Methodology
2.4.1 Data Collection (Primary and Secondary)
2.4.2 Data Modeling and Estimation Techniques
2.4.3 Data Validation and Triangulation
2.4.4 Analytical and Forecasting Approach
3 Market Dynamics and Trend Analysis
3.1 Market Definition and Structure
3.2 Key Market Drivers
3.3 Market Restraints and Challenges
3.4 Growth Opportunities and Investment Hotspots
3.5 Industry Threats and Risk Assessment
3.6 Technology and Innovation Landscape
3.7 Emerging and High-Growth Markets
3.8 Regulatory and Policy Environment
3.9 Impact of COVID-19 and Recovery Outlook
4 Competitive and Strategic Assessment
4.1 Porter's Five Forces Analysis
4.1.1 Supplier Bargaining Power
4.1.2 Buyer Bargaining Power
4.1.3 Threat of Substitutes
4.1.4 Threat of New Entrants
4.1.5 Competitive Rivalry
4.2 Market Share Analysis of Key Players
4.3 Product Benchmarking and Performance Comparison
5 Global Offshore Hydrogen Market, By Production Architecture
5.1 Offshore Wind with Onshore Electrolysis
5.2 Centralized Offshore Electrolysis Platform
5.3 Electrolysis Integrated with Offshore Wind Turbines
5.4 Floating Wind-to-Hydrogen Systems
6 Global Offshore Hydrogen Market, By Electrolyzer Technology
6.1 Proton Exchange Membrane (PEM)
6.2 Alkaline Electrolysis
6.3 Solid Oxide Electrolysis
7 Global Offshore Hydrogen Market, By Offshore Structure
7.1 Fixed-Bottom Platforms
7.2 Floating Platforms and Barges
7.3 Repurposed Offshore Energy Infrastructure
8 Global Offshore Hydrogen Market, By Storage and Transport
8.1 Subsea Hydrogen Pipelines
8.2 Compressed Hydrogen
8.3 Liquid Hydrogen
8.4 Ammonia and Other Hydrogen Carriers
9 Global Offshore Hydrogen Market, By End-Use Application
9.1 Industrial Decarbonization
9.2 Ammonia and E-Fuel Production
9.3 Power System Balancing
9.4 Shipping and Maritime Fuels
10 Global Offshore Hydrogen Market, By Geography
10.1 North America
10.1.1 United States
10.1.2 Canada
10.1.3 Mexico
10.2 Europe
10.2.1 United Kingdom
10.2.2 Germany
10.2.3 France
10.2.4 Italy
10.2.5 Spain
10.2.6 Netherlands
10.2.7 Belgium
10.2.8 Sweden
10.2.9 Switzerland
10.2.10 Poland
10.2.11 Rest of Europe
10.3 Asia Pacific
10.3.1 China
10.3.2 Japan
10.3.3 India
10.3.4 South Korea
10.3.5 Australia
10.3.6 Indonesia
10.3.7 Thailand
10.3.8 Malaysia
10.3.9 Singapore
10.3.10 Vietnam
10.3.11 Rest of Asia Pacific
10.4 South America
10.4.1 Brazil
10.4.2 Argentina
10.4.3 Colombia
10.4.4 Chile
10.4.5 Peru
10.4.6 Rest of South America
10.5 Rest of the World (RoW)
10.5.1 Middle East
10.5.1.1 Saudi Arabia
10.5.1.2 United Arab Emirates
10.5.1.3 Qatar
10.5.1.4 Israel
10.5.1.5 Rest of Middle East
10.5.2 Africa
10.5.2.1 South Africa
10.5.2.2 Egypt
10.5.2.3 Morocco
10.5.2.4 Rest of Africa
11 Strategic Market Intelligence
11.1 Industry Value Network and Supply Chain Assessment
11.2 White-Space and Opportunity Mapping
11.3 Product Evolution and Market Life Cycle Analysis
11.4 Channel, Distributor, and Go-to-Market Assessment
12 Industry Developments and Strategic Initiatives
12.1 Mergers and Acquisitions
12.2 Partnerships, Alliances, and Joint Ventures
12.3 New Product Launches and Certifications
12.4 Capacity Expansion and Investments
12.5 Other Strategic Initiatives
13 Company Profiles
13.1 Ørsted A/S
13.2 Equinor ASA
13.3 RWE AG
13.4 Shell plc
13.5 TotalEnergies SE
13.6 Iberdrola, S.A.
13.7 Copenhagen Infrastructure Partners
13.8 Siemens Energy AG
13.9 Nel ASA
13.10 Plug Power Inc.
13.11 ITM Power plc
13.12 thyssenkrupp nucera AG & Co. KGaA
13.13 McPhy Energy S.A.
13.14 Lhyfe
13.15 Vestas Wind Systems A/S
List of Tables
1 Global Offshore Hydrogen Market Outlook, By Region (2023–2034) ($MN)
2 Global Offshore Hydrogen Market Outlook, By Production Architecture (2023–2034) ($MN)
3 Global Offshore Hydrogen Market Outlook, By Offshore Wind with Onshore Electrolysis (2023–2034) ($MN)
4 Global Offshore Hydrogen Market Outlook, By Centralized Offshore Electrolysis Platform (2023–2034) ($MN)
5 Global Offshore Hydrogen Market Outlook, By Electrolysis Integrated with Offshore Wind Turbines (2023–2034) ($MN)
6 Global Offshore Hydrogen Market Outlook, By Floating Wind-to-Hydrogen Systems (2023–2034) ($MN)
7 Global Offshore Hydrogen Market Outlook, By Electrolyzer Technology (2023–2034) ($MN)
8 Global Offshore Hydrogen Market Outlook, By Proton Exchange Membrane (PEM) (2023–2034) ($MN)
9 Global Offshore Hydrogen Market Outlook, By Alkaline Electrolysis (2023–2034) ($MN)
10 Global Offshore Hydrogen Market Outlook, By Solid Oxide Electrolysis (2023–2034) ($MN)
11 Global Offshore Hydrogen Market Outlook, By Offshore Structure (2023–2034) ($MN)
12 Global Offshore Hydrogen Market Outlook, By Fixed-Bottom Platforms (2023–2034) ($MN)
13 Global Offshore Hydrogen Market Outlook, By Floating Platforms and Barges (2023–2034) ($MN)
14 Global Offshore Hydrogen Market Outlook, By Repurposed Offshore Energy Infrastructure (2023–2034) ($MN)
15 Global Offshore Hydrogen Market Outlook, By Storage and Transport (2023–2034) ($MN)
16 Global Offshore Hydrogen Market Outlook, By Subsea Hydrogen Pipelines (2023–2034) ($MN)
17 Global Offshore Hydrogen Market Outlook, By Compressed Hydrogen (2023–2034) ($MN)
18 Global Offshore Hydrogen Market Outlook, By Liquid Hydrogen (2023–2034) ($MN)
19 Global Offshore Hydrogen Market Outlook, By Ammonia and Other Hydrogen Carriers (2023–2034) ($MN)
20 Global Offshore Hydrogen Market Outlook, By End-Use Application (2023–2034) ($MN)
21 Global Offshore Hydrogen Market Outlook, By Industrial Decarbonization (2023–2034) ($MN)
22 Global Offshore Hydrogen Market Outlook, By Ammonia and E-Fuel Production (2023–2034) ($MN)
23 Global Offshore Hydrogen Market Outlook, By Power System Balancing (2023–2034) ($MN)
24 Global Offshore Hydrogen Market Outlook, By Shipping and Maritime Fuels (2023–2034) ($MN)
Note: Tables for North America, Europe, APAC, South America, and Rest of the World (RoW) Regions are also represented in the same manner as above.
List of Figures
RESEARCH METHODOLOGY
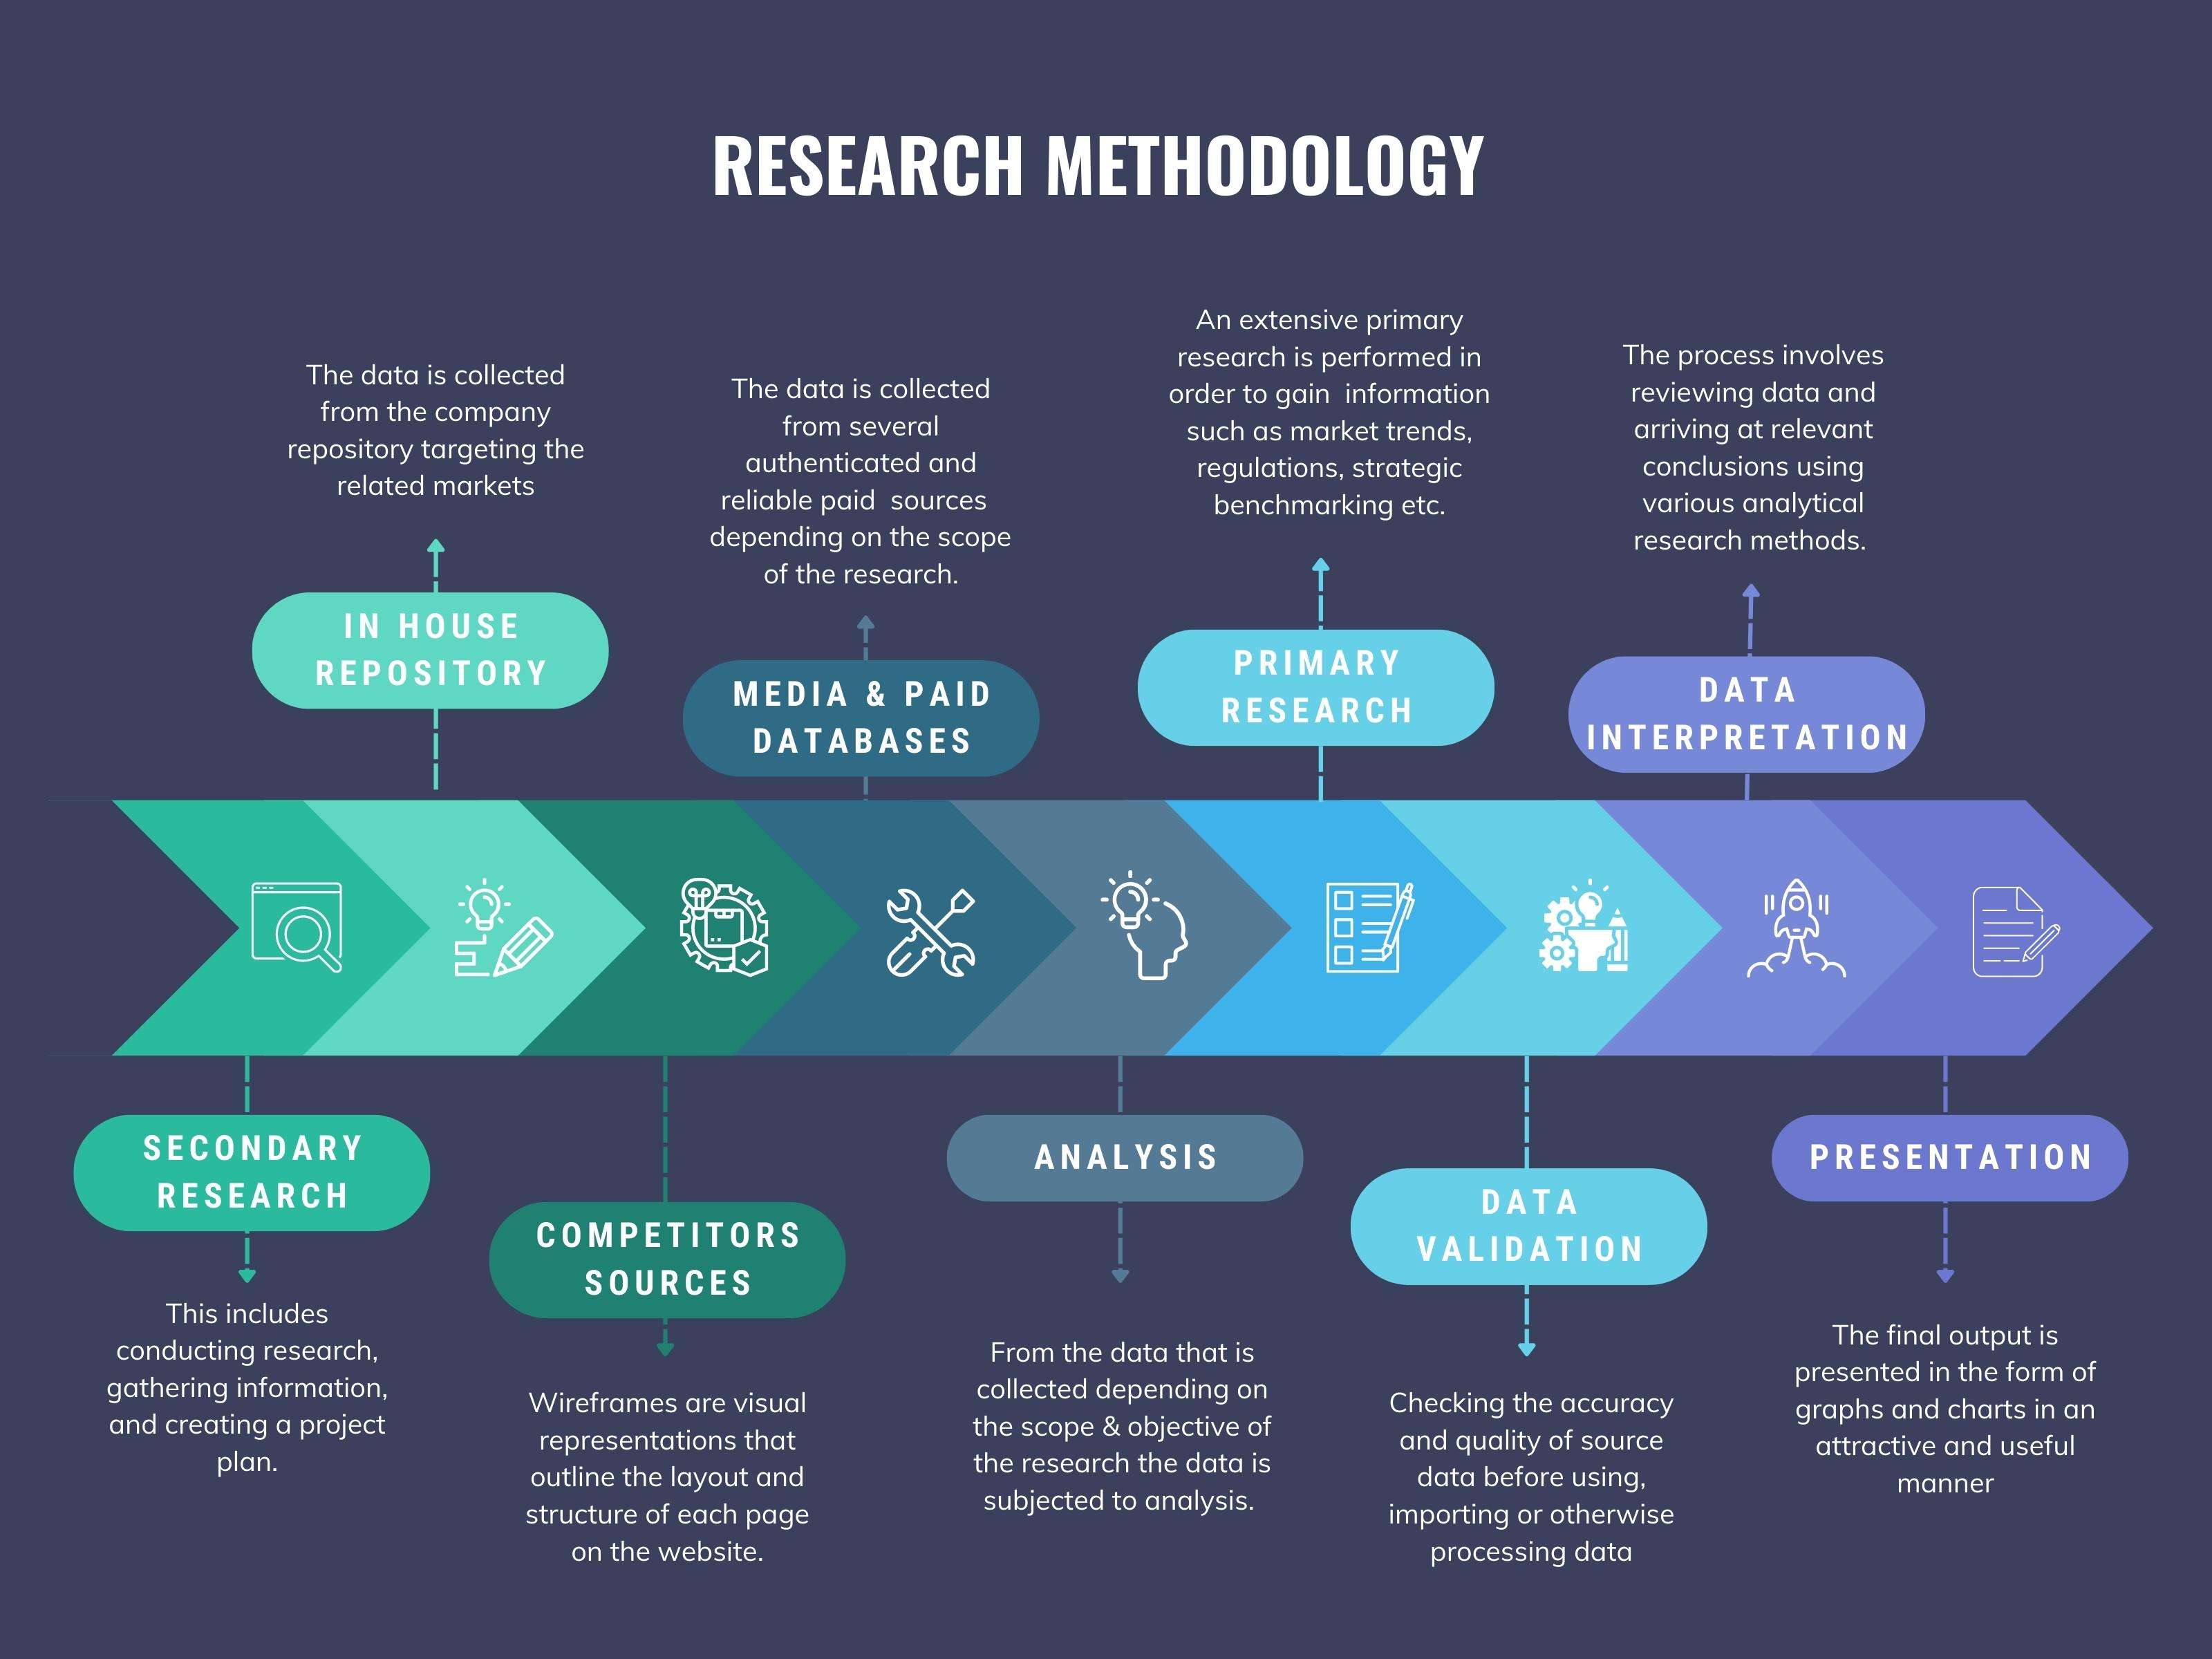
We at ‘Stratistics’ opt for an extensive research approach which involves data mining, data validation, and data analysis. The various research sources include in-house repository, secondary research, competitor’s sources, social media research, client internal data, and primary research.
Our team of analysts prefers the most reliable and authenticated data sources in order to perform the comprehensive literature search. With access to most of the authenticated data bases our team highly considers the best mix of information through various sources to obtain extensive and accurate analysis.
Each report takes an average time of a month and a team of 4 industry analysts. The time may vary depending on the scope and data availability of the desired market report. The various parameters used in the market assessment are standardized in order to enhance the data accuracy.
Data Mining
The data is collected from several authenticated, reliable, paid and unpaid sources and is filtered depending on the scope & objective of the research. Our reports repository acts as an added advantage in this procedure. Data gathering from the raw material suppliers, distributors and the manufacturers is performed on a regular basis, this helps in the comprehensive understanding of the products value chain. Apart from the above mentioned sources the data is also collected from the industry consultants to ensure the objective of the study is in the right direction.
Market trends such as technological advancements, regulatory affairs, market dynamics (Drivers, Restraints, Opportunities and Challenges) are obtained from scientific journals, market related national & international associations and organizations.
Data Analysis
From the data that is collected depending on the scope & objective of the research the data is subjected for the analysis. The critical steps that we follow for the data analysis include:
- Product Lifecycle Analysis
- Competitor analysis
- Risk analysis
- Porters Analysis
- PESTEL Analysis
- SWOT Analysis
The data engineering is performed by the core industry experts considering both the Marketing Mix Modeling and the Demand Forecasting. The marketing mix modeling makes use of multiple-regression techniques to predict the optimal mix of marketing variables. Regression factor is based on a number of variables and how they relate to an outcome such as sales or profits.
Data Validation
The data validation is performed by the exhaustive primary research from the expert interviews. This includes telephonic interviews, focus groups, face to face interviews, and questionnaires to validate our research from all aspects. The industry experts we approach come from the leading firms, involved in the supply chain ranging from the suppliers, distributors to the manufacturers and consumers so as to ensure an unbiased analysis.
We are in touch with more than 15,000 industry experts with the right mix of consultants, CEO's, presidents, vice presidents, managers, experts from both supply side and demand side, executives and so on.
The data validation involves the primary research from the industry experts belonging to:
- Leading Companies
- Suppliers & Distributors
- Manufacturers
- Consumers
- Industry/Strategic Consultants
Apart from the data validation the primary research also helps in performing the fill gap research, i.e. providing solutions for the unmet needs of the research which helps in enhancing the reports quality.
For more details about research methodology, kindly write to us at info@strategymrc.com
Frequently Asked Questions
In case of any queries regarding this report, you can contact the customer service by filing the “Inquiry Before Buy” form available on the right hand side. You may also contact us through email: info@strategymrc.com or phone: +1-301-202-5929
Yes, the samples are available for all the published reports. You can request them by filling the “Request Sample” option available in this page.
Yes, you can request a sample with your specific requirements. All the customized samples will be provided as per the requirement with the real data masked.
All our reports are available in Digital PDF format. In case if you require them in any other formats, such as PPT, Excel etc you can submit a request through “Inquiry Before Buy” form available on the right hand side. You may also contact us through email: info@strategymrc.com or phone: +1-301-202-5929
We offer a free 15% customization with every purchase. This requirement can be fulfilled for both pre and post sale. You may send your customization requirements through email at info@strategymrc.com or call us on +1-301-202-5929.
We have 3 different licensing options available in electronic format.
- Single User Licence: Allows one person, typically the buyer, to have access to the ordered product. The ordered product cannot be distributed to anyone else.
- 2-5 User Licence: Allows the ordered product to be shared among a maximum of 5 people within your organisation.
- Corporate License: Allows the product to be shared among all employees of your organisation regardless of their geographical location.
All our reports are typically be emailed to you as an attachment.
To order any available report you need to register on our website. The payment can be made either through CCAvenue or PayPal payments gateways which accept all international cards.
We extend our support to 6 months post sale. A post sale customization is also provided to cover your unmet needs in the report.
Request Customization
We offer complimentary customization of up to 15% with every purchase. To share your customization requirements, feel free to email us at info@strategymrc.com or call us on +1-301-202-5929. .
Please Note: Customization within the 15% threshold is entirely free of charge. If your request exceeds this limit, we will conduct a feasibility assessment. Following that, a detailed quote and timeline will be provided.
WHY CHOOSE US ?

Assured Quality
Best in class reports with high standard of research integrity

24X7 Research Support
Continuous support to ensure the best customer experience.

Free Customization
Adding more values to your product of interest.

Safe & Secure Access
Providing a secured environment for all online transactions.

Trusted by 600+ Brands
Serving the most reputed brands across the world.