
Pea Processed Ingredients Market
Pea Processed Ingredients Market Forecasts to 2028 – Global Analysis By Type (Starch, Flour, Fiber), Source (Yellow Split Peas, Chickpeas, Lentils), Function (Binding & Thickening, Film Forming) and By Geography

|
Years Covered |
2020-2028 |
|
Estimated Year Value (2021) |
US $3.15 BN |
|
Projected Year Value (2028) |
US $7.02 BN |
|
CAGR (2021 - 2028) |
12.1% |
|
Regions Covered |
North America, Europe, Asia Pacific, South America, and Middle East & Africa |
|
Countries Covered |
US, Canada, Mexico, Germany, UK, Italy, France, Spain, Japan, China, India, Australia, New Zealand, South Korea, Rest of Asia Pacific, South America, Argentina, Brazil, Chile, Middle East & Africa, Saudi Arabia, UAE, Qatar, and South Africa |
|
Largest Market |
North America |
|
Highest Growing Market |
Europe |
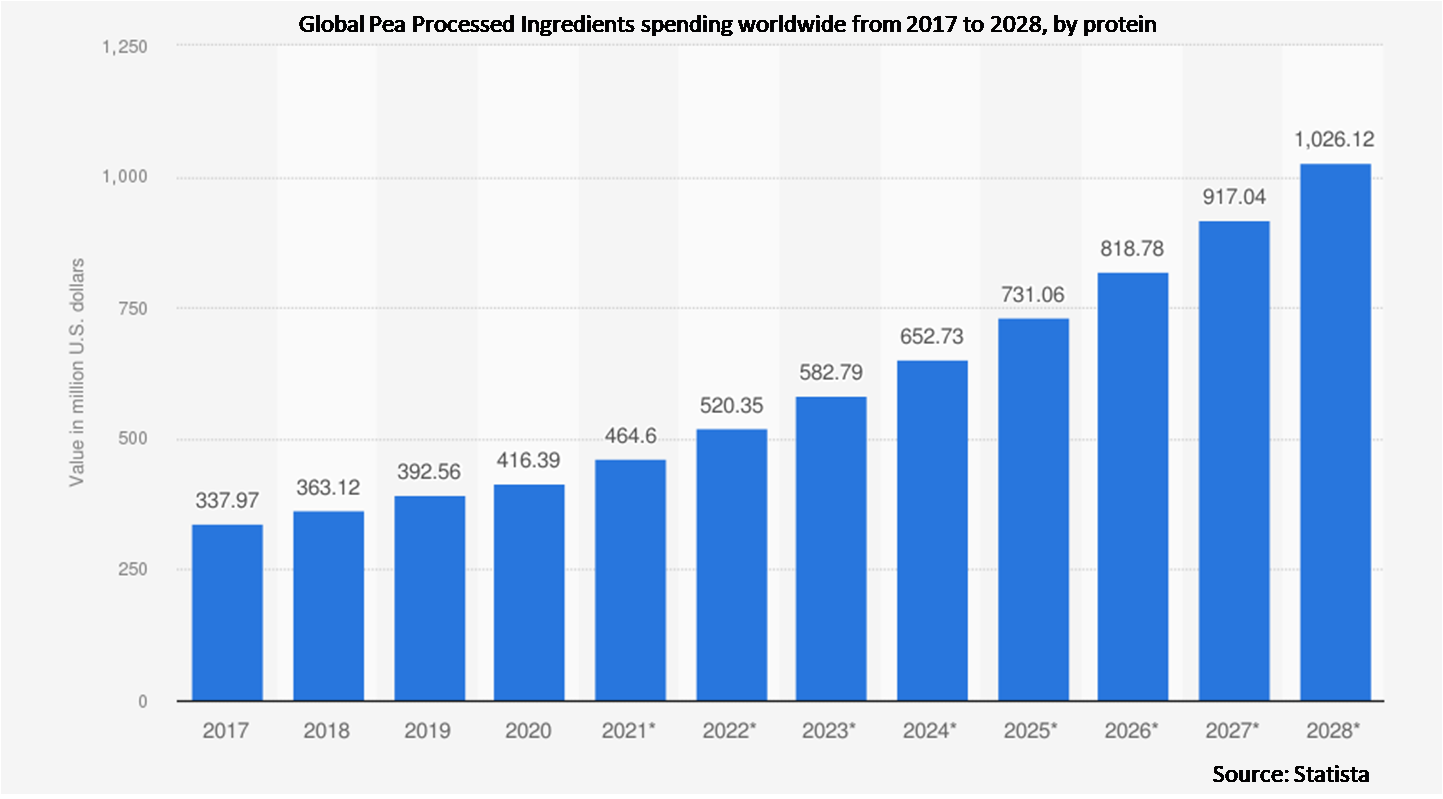
According to Stratistics MRC, the Global Pea Processed Ingredients Market is accounted for $3.15 billion in 2021 and is expected to reach $7.02 billion by 2028 growing at a CAGR of 12.1% during the forecast period. Processed pea ingredients such as pea flour, pea fiber, pea starch, and pea protein are taken out by processing numerous types of peas, such as pea’s lentils, chickpeas, green peas, and split yellow peas. It is found by carrying out a process, which consists of two phases, namely dry and wet.
Market Dynamics:
Driver:
Improvements in Extraction and Processing Technologies
The two phases dry and wet are acquired by applying a processing of various types of peas. The dry phase comprises two processes, dry milling, and air classification. Pea flour is obtained after practicing dry milling and air classification processes. Later, it undergoes the wet milling process, which includes multi-step solubilization, followed by centrifugation. This is the process where pea protein, pea fiber, pea flour, and pea starch are separated. Traditional technologies in pea processing could only extract protein flour comprising a maximal of 20% to 40% protein and concentrate comprising 45% to 60% proteins. The traditional techniques made pea processed ingredients less digestible and have low sensory properties. Therefore, the constraints of the traditional techniques are leading to the evolution of newer and modern techniques of pea protein, starch, flour, and fiber extraction and processing. Modern techniques included wet milling and centrifugation process that aid in processing peas with high digestibility, and improved taste.
Restraint:
High Cost
Due to the high extraction and processing costs and limited production, fails to lead the market. Compared to peas, there is greater consumer awareness about soy protein. Food & beverage manufacturers have been looking for more healthy and affordable alternatives for animal-based sources, thereby increasing investments in the plant-based ingredient market. Manufacturers have achieved economies of scale for soy-based ingredients due to their high production capacities and high demand. On the other hand, the pea is a comparatively newer product, which, due to the availability of low-cost products, such as soy, is finding it difficult to dominate the plant-based alternative industry. Manufacturers are finding it difficult to sell standalone pure pea processed ingredients that fetch lower margins, which is leading to the sales of blends of pea processed ingredients.
Opportunity:
Developments in Quality Properties Supporting Acceptance in Baking Ingredients
With Research & Development efforts and technological advancements in the extraction and processing of different ingredients from peas, newer applications and developments were incorporated into this market. It can be used as an addition to fiber, flour, and starch in the bakery industry, helping toward healthy lifestyles. Consumers continuously look for healthier food & beverage options, usually the ones that provide sustenance in hectic lives and daily routines. Bakery products never came in that category earlier. However, with the addition of pea processed ingredients in the making of bakery products, the baking industry is ready to take the trial.
Threat:
Supply limitations
The foremost threat that makers have to experience is the lack of supply. The percentage of conversion of pea protein removed from peas varies from process to process and as per the type of pea used in the process. Ideally, 15% to 20% of peas are converted into proteins; the rest is converted into starch and fiber. Therefore, specific ingredients derived from the large processing of peas are limited, thereby resulting in supply constraints. In recent times, the demand for pea processed ingredients has increased due to their health benefits, anti-allergen properties, and other functional properties. This increase in demand can be witnessed in the food & beverage industry.
Protein segment is expected to be the largest during the forecast period
Pea protein is largest in the pea processed ingredients business, due to the growing demand for plant-based ingredients. Additionally, rising consciousness towards the benefits offered by pea protein is boosting this segment over the years. Pea protein is neutral in taste and has an array of applications in the food, beverage, pet food, and feed industries. Several countries are now focusing on increasing pea processing to enhance pea protein production.
The Food segment is expected to have the highest CAGR during the forecast period
Pea processed ingredients finds several applications in the food industry reinforced by their cost-effectiveness and nutritional benefits. It is used in numerous food applications that contain meat & meat substitutes, functional foods, performance nutrition, snacks, bakery products, and confectionery among others. It is mostly used for rendering food products with the required texture, consistency, and stability. Pea processed ingredients are a clean label substitute and are a popular choice among customers.
Region with highest share:
The North America is projected to hold the highest market share; it is estimated to grow at a significant growth rate, owing to the rise in demand from large economies, the US, Canada, and Mexico. Manufacturing food manufacturers are attentive to emerging altered product formats sourced from peas. Pea processed ingredients are among the utmost versatile ingredients and can be formulated into food, beverage, and others including pet food, feed, and industrial. But, given the high prices of pea processed ingredients, their demands have remained popular in developed markets.
Region with highest CAGR:
Europe is projected to have the highest CAGR, due to the increasing popularity of vegetarianism and vegan diet, as a substitute the meat products, growing health consciousness among the population in western countries of Europe, and increasing demand for non-allergen, gluten-free, and lactose-free protein ingredients in the food products. Moreover, proven nutritional qualities and increased influence of the west have also resulted in growing popularity among the population in Eastern countries of Europe.

Key players in the market:
Some of the key players profiled in the Pea Processed Ingredients Market include A&B Ingredients Inc., Agridient B.V., Agt Food and Ingredients, American Key Food Products, Axiom Foods Inc., Batory Foods, Burcon Nutrascience Corp, Cosucra Groupe Warcoing Sa, Dupont, Emsland Group, Felleskjopet Rogaland Agder, Ingredion Incorporated, Kerry, Meelunie B.V., Parrheim Foods, Puris Foods, Roquette Freres, Shandong Jianyuan Group, The Scoular Company, Vestkorn Milling As, Yantai Oriental Protein Tech Co., Ltd., Yantai Shuangta Food Co., Ltd.
Key developments:
In October 2019: Puris Foods launched new pea starch ingredients that are widely used for sports nutrition to formulate vegan gummies. This launch helped strengthen the company’s pea starch product portfolio and cater to the growing demand for plant-based nutritional products.
In December 2019: Roquette announced that it developed Roquette pea starch LN 30, a product suited for active nutrition applications that comes in powder shake and snack bar formats
In July 2020: The Emsland Group partnered with Brenntag Food & Nutrition (Russia). Brenntag will take over distribution of Emsland’s product portfolio for the food industry as well as technical specialties, which include native starches, modified starches, proteins, and fibers made from peas and potatoes..
Types Covered:
• Protein
• Starch
• Flour
• Fiber
Sources Covered:
• Yellow Split Peas
• Chickpeas
• Lentils
Functions Covered:
• Binding & Thickening
• Film Forming
• Gelling
• Texturizing
Applications Covered:
• Food
• Beverages
Regions Covered:
• North America
o US
o Canada
o Mexico
• Europe
o Germany
o UK
o Italy
o France
o Spain
o Rest of Europe
• Asia Pacific
o Japan
o China
o India
o Australia
o New Zealand
o South Korea
o Rest of Asia Pacific
• South America
o Argentina
o Brazil
o Chile
o Rest of South America
• Middle East & Africa
o Saudi Arabia
o UAE
o Qatar
o South Africa
o Rest of Middle East & Africa
What our report offers:
- Market share assessments for the regional and country-level segments
- Strategic recommendations for the new entrants
- Covers Market data for the years 2020, 2021, 2022, 2025 and 2028
- Market Trends (Drivers, Constraints, Opportunities, Threats, Challenges, Investment Opportunities, and recommendations)
- Strategic recommendations in key business segments based on the market estimations
- Competitive landscaping mapping the key common trends
- Company profiling with detailed strategies, financials, and recent developments
- Supply chain trends mapping the latest technological advancements
Free Customization Offerings:
All the customers of this report will be entitled to receive one of the following free customization options:
• Company Profiling
o Comprehensive profiling of additional market players (up to 3)
o SWOT Analysis of key players (up to 3)
• Regional Segmentation
o Market estimations, Forecasts and CAGR of any prominent country as per the client's interest (Note: Depends on feasibility check)
• Competitive Benchmarking
o Benchmarking of key players based on product portfolio, geographical presence, and strategic alliances
Table of Contents
1 Executive Summary
2 Preface
2.1 Abstract
2.2 Stake Holders
2.3 Research Scope
2.4 Research Methodology
2.4.1 Data Mining
2.4.2 Data Analysis
2.4.3 Data Validation
2.4.4 Research Approach
2.5 Research Sources
2.5.1 Primary Research Sources
2.5.2 Secondary Research Sources
2.5.3 Assumptions
3 Market Trend Analysis
3.1 Introduction
3.2 Drivers
3.3 Restraints
3.4 Opportunities
3.5 Threats
3.6 Application Analysis
3.7 Emerging Markets
3.8 Impact of Covid-19
4 Porters Five Force Analysis
4.1 Bargaining power of suppliers
4.2 Bargaining power of buyers
4.3 Threat of substitutes
4.4 Threat of new entrants
4.5 Competitive rivalry
5 Global Pea Processed Ingredients Market, By Type
5.1 Introduction
5.2 Protein
5.2.1 Isolates
5.2.2 Concentrates
5.2.3 Textured
5.3 Starch
5.4 Flour
5.5 Fiber
6 Global Pea Processed Ingredients Market, By Source
6.1 Introduction
6.2 Yellow Split Peas
6.3 Chickpeas
6.4 Lentils
7 Global Pea Processed Ingredients Market, By Function
7.1 Introduction
7.2 Binding & Thickening
7.3 Film Forming
7.4 Gelling
7.5 Texturizing
8 Global Pea Processed Ingredients Market, By Application
8.1 Introduction
8.2 Food
8.2.1 Bakery
8.2.2 Confectionery
8.2.3 Fucntional Foods
8.2.4 Meat & Meat Substitutes
8.2.5 Performance Nutrition
8.2.6 Snacks
8.3 Beverage
9 Global Pea Processed Ingredients Market, By Geography
9.1 Introduction
9.2 North America
9.2.1 US
9.2.2 Canada
9.2.3 Mexico
9.3 Europe
9.3.1 Germany
9.3.2 UK
9.3.3 Italy
9.3.4 France
9.3.5 Spain
9.3.6 Rest of Europe
9.4 Asia Pacific
9.4.1 Japan
9.4.2 China
9.4.3 India
9.4.4 Australia
9.4.5 New Zealand
9.4.6 South Korea
9.4.7 Rest of Asia Pacific
9.5 South America
9.5.1 Argentina
9.5.2 Brazil
9.5.3 Chile
9.5.4 Rest of South America
9.6 Middle East & Africa
9.6.1 Saudi Arabia
9.6.2 UAE
9.6.3 Qatar
9.6.4 South Africa
9.6.5 Rest of Middle East & Africa
10 Key Developments
10.1 Agreements, Partnerships, Collaborations and Joint Ventures
10.2 Acquisitions & Mergers
10.3 New Product Launch
10.4 Expansions
10.5 Other Key Strategies
11 Company Profiling
11.1 A&B Ingredients Inc.
11.2 Agridient B.V.
11.3 Agt Food and Ingredients
11.4 American Key Food Products
11.5 Axiom Foods Inc.
11.6 Batory Foods
11.7 Burcon Nutrascience Corp
11.8 Cosucra Groupe Warcoing Sa
11.9 Dupont
11.10 Emsland Group
11.11 Felleskjopet Rogaland Agder
11.12 Ingredion Incorporated
11.13 Kerry
11.14 Meelunie B.V.
11.15 Parrheim Foods
11.16 Puris Foods
11.17 Roquette Freres
11.18 Shandong Jianyuan Group
11.19 The Scoular Company
11.20 Vestkorn Milling As
11.21 Yantai Oriental Protein Tech Co., Ltd.
List of Tables
1 Global Pea Processed Ingredients Market Outlook, By Region (2020-2028) (US $MN)
2 Global Pea Processed Ingredients Market Outlook, By Type (2020-2028) (US $MN)
3 Global Pea Processed Ingredients Market Outlook, By Protein (2020-2028) (US $MN)
4 Global Pea Processed Ingredients Market Outlook, By Isolates (2020-2028) (US $MN)
5 Global Pea Processed Ingredients Market Outlook, By Concentrates (2020-2028) (US $MN)
6 Global Pea Processed Ingredients Market Outlook, By Textured (2020-2028) (US $MN)
7 Global Pea Processed Ingredients Market Outlook, By Starch (2020-2028) (US $MN)
8 Global Pea Processed Ingredients Market Outlook, By Flour (2020-2028) (US $MN)
9 Global Pea Processed Ingredients Market Outlook, By Fiber (2020-2028) (US $MN)
10 Global Pea Processed Ingredients Market Outlook, By Source (2020-2028) (US $MN)
11 Global Pea Processed Ingredients Market Outlook, By Yellow Split Peas (2020-2028) (US $MN)
12 Global Pea Processed Ingredients Market Outlook, By Chickpeas (2020-2028) (US $MN)
13 Global Pea Processed Ingredients Market Outlook, By Lentils (2020-2028) (US $MN)
14 Global Pea Processed Ingredients Market Outlook, By Function (2020-2028) (US $MN)
15 Global Pea Processed Ingredients Market Outlook, By Binding & Thickening (2020-2028) (US $MN)
16 Global Pea Processed Ingredients Market Outlook, By Film Forming (2020-2028) (US $MN)
17 Global Pea Processed Ingredients Market Outlook, By Gelling (2020-2028) (US $MN)
18 Global Pea Processed Ingredients Market Outlook, By Texturizing (2020-2028) (US $MN)
19 Global Pea Processed Ingredients Market Outlook, By Application (2020-2028) (US $MN)
20 Global Pea Processed Ingredients Market Outlook, By Food (2020-2028) (US $MN)
21 Global Pea Processed Ingredients Market Outlook, By Bakery (2020-2028) (US $MN)
22 Global Pea Processed Ingredients Market Outlook, By Confectionery (2020-2028) (US $MN)
23 Global Pea Processed Ingredients Market Outlook, By Fucntional Foods (2020-2028) (US $MN)
24 Global Pea Processed Ingredients Market Outlook, By Meat & Meat Substitutes (2020-2028) (US $MN)
25 Global Pea Processed Ingredients Market Outlook, By Performance Nutrition (2020-2028) (US $MN)
26 Global Pea Processed Ingredients Market Outlook, By Snacks (2020-2028) (US $MN)
27 Global Pea Processed Ingredients Market Outlook, By Beverage (2020-2028) (US $MN)
28 North America Pea Processed Ingredients Market Outlook, By Country (2020-2028) (US $MN)
29 North America Pea Processed Ingredients Market Outlook, By Type (2020-2028) (US $MN)
30 North America Pea Processed Ingredients Market Outlook, By Protein (2020-2028) (US $MN)
31 North America Pea Processed Ingredients Market Outlook, By Isolates (2020-2028) (US $MN)
32 North America Pea Processed Ingredients Market Outlook, By Concentrates (2020-2028) (US $MN)
33 North America Pea Processed Ingredients Market Outlook, By Textured (2020-2028) (US $MN)
34 North America Pea Processed Ingredients Market Outlook, By Starch (2020-2028) (US $MN)
35 North America Pea Processed Ingredients Market Outlook, By Flour (2020-2028) (US $MN)
36 North America Pea Processed Ingredients Market Outlook, By Fiber (2020-2028) (US $MN)
37 North America Pea Processed Ingredients Market Outlook, By Source (2020-2028) (US $MN)
38 North America Pea Processed Ingredients Market Outlook, By Yellow Split Peas (2020-2028) (US $MN)
39 North America Pea Processed Ingredients Market Outlook, By Chickpeas (2020-2028) (US $MN)
40 North America Pea Processed Ingredients Market Outlook, By Lentils (2020-2028) (US $MN)
41 North America Pea Processed Ingredients Market Outlook, By Function (2020-2028) (US $MN)
42 North America Pea Processed Ingredients Market Outlook, By Binding & Thickening (2020-2028) (US $MN)
43 North America Pea Processed Ingredients Market Outlook, By Film Forming (2020-2028) (US $MN)
44 North America Pea Processed Ingredients Market Outlook, By Gelling (2020-2028) (US $MN)
45 North America Pea Processed Ingredients Market Outlook, By Texturizing (2020-2028) (US $MN)
46 North America Pea Processed Ingredients Market Outlook, By Application (2020-2028) (US $MN)
47 North America Pea Processed Ingredients Market Outlook, By Food (2020-2028) (US $MN)
48 North America Pea Processed Ingredients Market Outlook, By Bakery (2020-2028) (US $MN)
49 North America Pea Processed Ingredients Market Outlook, By Confectionery (2020-2028) (US $MN)
50 North America Pea Processed Ingredients Market Outlook, By Fucntional Foods (2020-2028) (US $MN)
51 North America Pea Processed Ingredients Market Outlook, By Meat & Meat Substitutes (2020-2028) (US $MN)
52 North America Pea Processed Ingredients Market Outlook, By Performance Nutrition (2020-2028) (US $MN)
53 North America Pea Processed Ingredients Market Outlook, By Snacks (2020-2028) (US $MN)
54 North America Pea Processed Ingredients Market Outlook, By Beverage (2020-2028) (US $MN)
55 Europe Pea Processed Ingredients Market Outlook, By Country (2020-2028) (US $MN)
56 Europe Pea Processed Ingredients Market Outlook, By Type (2020-2028) (US $MN)
57 Europe Pea Processed Ingredients Market Outlook, By Protein (2020-2028) (US $MN)
58 Europe Pea Processed Ingredients Market Outlook, By Isolates (2020-2028) (US $MN)
59 Europe Pea Processed Ingredients Market Outlook, By Concentrates (2020-2028) (US $MN)
60 Europe Pea Processed Ingredients Market Outlook, By Textured (2020-2028) (US $MN)
61 Europe Pea Processed Ingredients Market Outlook, By Starch (2020-2028) (US $MN)
62 Europe Pea Processed Ingredients Market Outlook, By Flour (2020-2028) (US $MN)
63 Europe Pea Processed Ingredients Market Outlook, By Fiber (2020-2028) (US $MN)
64 Europe Pea Processed Ingredients Market Outlook, By Source (2020-2028) (US $MN)
65 Europe Pea Processed Ingredients Market Outlook, By Yellow Split Peas (2020-2028) (US $MN)
66 Europe Pea Processed Ingredients Market Outlook, By Chickpeas (2020-2028) (US $MN)
67 Europe Pea Processed Ingredients Market Outlook, By Lentils (2020-2028) (US $MN)
68 Europe Pea Processed Ingredients Market Outlook, By Function (2020-2028) (US $MN)
69 Europe Pea Processed Ingredients Market Outlook, By Binding & Thickening (2020-2028) (US $MN)
70 Europe Pea Processed Ingredients Market Outlook, By Film Forming (2020-2028) (US $MN)
71 Europe Pea Processed Ingredients Market Outlook, By Gelling (2020-2028) (US $MN)
72 Europe Pea Processed Ingredients Market Outlook, By Texturizing (2020-2028) (US $MN)
73 Europe Pea Processed Ingredients Market Outlook, By Application (2020-2028) (US $MN)
74 Europe Pea Processed Ingredients Market Outlook, By Food (2020-2028) (US $MN)
75 Europe Pea Processed Ingredients Market Outlook, By Bakery (2020-2028) (US $MN)
76 Europe Pea Processed Ingredients Market Outlook, By Confectionery (2020-2028) (US $MN)
77 Europe Pea Processed Ingredients Market Outlook, By Fucntional Foods (2020-2028) (US $MN)
78 Europe Pea Processed Ingredients Market Outlook, By Meat & Meat Substitutes (2020-2028) (US $MN)
79 Europe Pea Processed Ingredients Market Outlook, By Performance Nutrition (2020-2028) (US $MN)
80 Europe Pea Processed Ingredients Market Outlook, By Snacks (2020-2028) (US $MN)
81 Europe Pea Processed Ingredients Market Outlook, By Beverage (2020-2028) (US $MN)
82 Asia Pacific Pea Processed Ingredients Market Outlook, By Country (2020-2028) (US $MN)
83 Asia Pacific Pea Processed Ingredients Market Outlook, By Type (2020-2028) (US $MN)
84 Asia Pacific Pea Processed Ingredients Market Outlook, By Protein (2020-2028) (US $MN)
85 Asia Pacific Pea Processed Ingredients Market Outlook, By Isolates (2020-2028) (US $MN)
86 Asia Pacific Pea Processed Ingredients Market Outlook, By Concentrates (2020-2028) (US $MN)
87 Asia Pacific Pea Processed Ingredients Market Outlook, By Textured (2020-2028) (US $MN)
88 Asia Pacific Pea Processed Ingredients Market Outlook, By Starch (2020-2028) (US $MN)
89 Asia Pacific Pea Processed Ingredients Market Outlook, By Flour (2020-2028) (US $MN)
90 Asia Pacific Pea Processed Ingredients Market Outlook, By Fiber (2020-2028) (US $MN)
91 Asia Pacific Pea Processed Ingredients Market Outlook, By Source (2020-2028) (US $MN)
92 Asia Pacific Pea Processed Ingredients Market Outlook, By Yellow Split Peas (2020-2028) (US $MN)
93 Asia Pacific Pea Processed Ingredients Market Outlook, By Chickpeas (2020-2028) (US $MN)
94 Asia Pacific Pea Processed Ingredients Market Outlook, By Lentils (2020-2028) (US $MN)
95 Asia Pacific Pea Processed Ingredients Market Outlook, By Function (2020-2028) (US $MN)
96 Asia Pacific Pea Processed Ingredients Market Outlook, By Binding & Thickening (2020-2028) (US $MN)
97 Asia Pacific Pea Processed Ingredients Market Outlook, By Film Forming (2020-2028) (US $MN)
98 Asia Pacific Pea Processed Ingredients Market Outlook, By Gelling (2020-2028) (US $MN)
99 Asia Pacific Pea Processed Ingredients Market Outlook, By Texturizing (2020-2028) (US $MN)
100 Asia Pacific Pea Processed Ingredients Market Outlook, By Application (2020-2028) (US $MN)
101 Asia Pacific Pea Processed Ingredients Market Outlook, By Food (2020-2028) (US $MN)
102 Asia Pacific Pea Processed Ingredients Market Outlook, By Bakery (2020-2028) (US $MN)
103 Asia Pacific Pea Processed Ingredients Market Outlook, By Confectionery (2020-2028) (US $MN)
104 Asia Pacific Pea Processed Ingredients Market Outlook, By Fucntional Foods (2020-2028) (US $MN)
105 Asia Pacific Pea Processed Ingredients Market Outlook, By Meat & Meat Substitutes (2020-2028) (US $MN)
106 Asia Pacific Pea Processed Ingredients Market Outlook, By Performance Nutrition (2020-2028) (US $MN)
107 Asia Pacific Pea Processed Ingredients Market Outlook, By Snacks (2020-2028) (US $MN)
108 Asia Pacific Pea Processed Ingredients Market Outlook, By Beverage (2020-2028) (US $MN)
109 South America Pea Processed Ingredients Market Outlook, By Country (2020-2028) (US $MN)
110 South America Pea Processed Ingredients Market Outlook, By Type (2020-2028) (US $MN)
111 South America Pea Processed Ingredients Market Outlook, By Protein (2020-2028) (US $MN)
112 South America Pea Processed Ingredients Market Outlook, By Isolates (2020-2028) (US $MN)
113 South America Pea Processed Ingredients Market Outlook, By Concentrates (2020-2028) (US $MN)
114 South America Pea Processed Ingredients Market Outlook, By Textured (2020-2028) (US $MN)
115 South America Pea Processed Ingredients Market Outlook, By Starch (2020-2028) (US $MN)
116 South America Pea Processed Ingredients Market Outlook, By Flour (2020-2028) (US $MN)
117 South America Pea Processed Ingredients Market Outlook, By Fiber (2020-2028) (US $MN)
118 South America Pea Processed Ingredients Market Outlook, By Source (2020-2028) (US $MN)
119 South America Pea Processed Ingredients Market Outlook, By Yellow Split Peas (2020-2028) (US $MN)
120 South America Pea Processed Ingredients Market Outlook, By Chickpeas (2020-2028) (US $MN)
121 South America Pea Processed Ingredients Market Outlook, By Lentils (2020-2028) (US $MN)
122 South America Pea Processed Ingredients Market Outlook, By Function (2020-2028) (US $MN)
123 South America Pea Processed Ingredients Market Outlook, By Binding & Thickening (2020-2028) (US $MN)
124 South America Pea Processed Ingredients Market Outlook, By Film Forming (2020-2028) (US $MN)
125 South America Pea Processed Ingredients Market Outlook, By Gelling (2020-2028) (US $MN)
126 South America Pea Processed Ingredients Market Outlook, By Texturizing (2020-2028) (US $MN)
127 South America Pea Processed Ingredients Market Outlook, By Application (2020-2028) (US $MN)
128 South America Pea Processed Ingredients Market Outlook, By Food (2020-2028) (US $MN)
129 South America Pea Processed Ingredients Market Outlook, By Bakery (2020-2028) (US $MN)
130 South America Pea Processed Ingredients Market Outlook, By Confectionery (2020-2028) (US $MN)
131 South America Pea Processed Ingredients Market Outlook, By Fucntional Foods (2020-2028) (US $MN)
132 South America Pea Processed Ingredients Market Outlook, By Meat & Meat Substitutes (2020-2028) (US $MN)
133 South America Pea Processed Ingredients Market Outlook, By Performance Nutrition (2020-2028) (US $MN)
134 South America Pea Processed Ingredients Market Outlook, By Snacks (2020-2028) (US $MN)
135 South America Pea Processed Ingredients Market Outlook, By Beverage (2020-2028) (US $MN)
136 Middle East & AFrica Pea Processed Ingredients Market Outlook, By Country (2020-2028) (US $MN)
137 Middle East & AFrica Pea Processed Ingredients Market Outlook, By Type (2020-2028) (US $MN)
138 Middle East & AFrica Pea Processed Ingredients Market Outlook, By Protein (2020-2028) (US $MN)
139 Middle East & AFrica Pea Processed Ingredients Market Outlook, By Isolates (2020-2028) (US $MN)
140 Middle East & AFrica Pea Processed Ingredients Market Outlook, By Concentrates (2020-2028) (US $MN)
141 Middle East & AFrica Pea Processed Ingredients Market Outlook, By Textured (2020-2028) (US $MN)
142 Middle East & AFrica Pea Processed Ingredients Market Outlook, By Starch (2020-2028) (US $MN)
143 Middle East & AFrica Pea Processed Ingredients Market Outlook, By Flour (2020-2028) (US $MN)
144 Middle East & AFrica Pea Processed Ingredients Market Outlook, By Fiber (2020-2028) (US $MN)
145 Middle East & AFrica Pea Processed Ingredients Market Outlook, By Source (2020-2028) (US $MN)
146 Middle East & AFrica Pea Processed Ingredients Market Outlook, By Yellow Split Peas (2020-2028) (US $MN)
147 Middle East & AFrica Pea Processed Ingredients Market Outlook, By Chickpeas (2020-2028) (US $MN)
148 Middle East & AFrica Pea Processed Ingredients Market Outlook, By Lentils (2020-2028) (US $MN)
149 Middle East & AFrica Pea Processed Ingredients Market Outlook, By Function (2020-2028) (US $MN)
150 Middle East & AFrica Pea Processed Ingredients Market Outlook, By Binding & Thickening (2020-2028) (US $MN)
151 Middle East & AFrica Pea Processed Ingredients Market Outlook, By Film Forming (2020-2028) (US $MN)
152 Middle East & AFrica Pea Processed Ingredients Market Outlook, By Gelling (2020-2028) (US $MN)
153 Middle East & AFrica Pea Processed Ingredients Market Outlook, By Texturizing (2020-2028) (US $MN)
154 Middle East & AFrica Pea Processed Ingredients Market Outlook, By Application (2020-2028) (US $MN)
155 Middle East & AFrica Pea Processed Ingredients Market Outlook, By Food (2020-2028) (US $MN)
156 Middle East & AFrica Pea Processed Ingredients Market Outlook, By Bakery (2020-2028) (US $MN)
157 Middle East & AFrica Pea Processed Ingredients Market Outlook, By Confectionery (2020-2028) (US $MN)
158 Middle East & AFrica Pea Processed Ingredients Market Outlook, By Fucntional Foods (2020-2028) (US $MN)
159 Middle East & AFrica Pea Processed Ingredients Market Outlook, By Meat & Meat Substitutes (2020-2028) (US $MN)
160 Middle East & AFrica Pea Processed Ingredients Market Outlook, By Performance Nutrition (2020-2028) (US $MN)
161 Middle East & AFrica Pea Processed Ingredients Market Outlook, By Snacks (2020-2028) (US $MN)
162 Middle East & AFrica Pea Processed Ingredients Market Outlook, By Beverage (2020-2028) (US $MN)
List of Figures
RESEARCH METHODOLOGY

We at ‘Stratistics’ opt for an extensive research approach which involves data mining, data validation, and data analysis. The various research sources include in-house repository, secondary research, competitor’s sources, social media research, client internal data, and primary research.
Our team of analysts prefers the most reliable and authenticated data sources in order to perform the comprehensive literature search. With access to most of the authenticated data bases our team highly considers the best mix of information through various sources to obtain extensive and accurate analysis.
Each report takes an average time of a month and a team of 4 industry analysts. The time may vary depending on the scope and data availability of the desired market report. The various parameters used in the market assessment are standardized in order to enhance the data accuracy.
Data Mining
The data is collected from several authenticated, reliable, paid and unpaid sources and is filtered depending on the scope & objective of the research. Our reports repository acts as an added advantage in this procedure. Data gathering from the raw material suppliers, distributors and the manufacturers is performed on a regular basis, this helps in the comprehensive understanding of the products value chain. Apart from the above mentioned sources the data is also collected from the industry consultants to ensure the objective of the study is in the right direction.
Market trends such as technological advancements, regulatory affairs, market dynamics (Drivers, Restraints, Opportunities and Challenges) are obtained from scientific journals, market related national & international associations and organizations.
Data Analysis
From the data that is collected depending on the scope & objective of the research the data is subjected for the analysis. The critical steps that we follow for the data analysis include:
- Product Lifecycle Analysis
- Competitor analysis
- Risk analysis
- Porters Analysis
- PESTEL Analysis
- SWOT Analysis
The data engineering is performed by the core industry experts considering both the Marketing Mix Modeling and the Demand Forecasting. The marketing mix modeling makes use of multiple-regression techniques to predict the optimal mix of marketing variables. Regression factor is based on a number of variables and how they relate to an outcome such as sales or profits.
Data Validation
The data validation is performed by the exhaustive primary research from the expert interviews. This includes telephonic interviews, focus groups, face to face interviews, and questionnaires to validate our research from all aspects. The industry experts we approach come from the leading firms, involved in the supply chain ranging from the suppliers, distributors to the manufacturers and consumers so as to ensure an unbiased analysis.
We are in touch with more than 15,000 industry experts with the right mix of consultants, CEO's, presidents, vice presidents, managers, experts from both supply side and demand side, executives and so on.
The data validation involves the primary research from the industry experts belonging to:
- Leading Companies
- Suppliers & Distributors
- Manufacturers
- Consumers
- Industry/Strategic Consultants
Apart from the data validation the primary research also helps in performing the fill gap research, i.e. providing solutions for the unmet needs of the research which helps in enhancing the reports quality.
For more details about research methodology, kindly write to us at info@strategymrc.com
Frequently Asked Questions
In case of any queries regarding this report, you can contact the customer service by filing the “Inquiry Before Buy” form available on the right hand side. You may also contact us through email: info@strategymrc.com or phone: +1-301-202-5929
Yes, the samples are available for all the published reports. You can request them by filling the “Request Sample” option available in this page.
Yes, you can request a sample with your specific requirements. All the customized samples will be provided as per the requirement with the real data masked.
All our reports are available in Digital PDF format. In case if you require them in any other formats, such as PPT, Excel etc you can submit a request through “Inquiry Before Buy” form available on the right hand side. You may also contact us through email: info@strategymrc.com or phone: +1-301-202-5929
We offer a free 15% customization with every purchase. This requirement can be fulfilled for both pre and post sale. You may send your customization requirements through email at info@strategymrc.com or call us on +1-301-202-5929.
We have 3 different licensing options available in electronic format.
- Single User Licence: Allows one person, typically the buyer, to have access to the ordered product. The ordered product cannot be distributed to anyone else.
- 2-5 User Licence: Allows the ordered product to be shared among a maximum of 5 people within your organisation.
- Corporate License: Allows the product to be shared among all employees of your organisation regardless of their geographical location.
All our reports are typically be emailed to you as an attachment.
To order any available report you need to register on our website. The payment can be made either through CCAvenue or PayPal payments gateways which accept all international cards.
We extend our support to 6 months post sale. A post sale customization is also provided to cover your unmet needs in the report.
Request Customization
We offer complimentary customization of up to 15% with every purchase. To share your customization requirements, feel free to email us at info@strategymrc.com or call us on +1-301-202-5929. .
Please Note: Customization within the 15% threshold is entirely free of charge. If your request exceeds this limit, we will conduct a feasibility assessment. Following that, a detailed quote and timeline will be provided.
WHY CHOOSE US ?

Assured Quality
Best in class reports with high standard of research integrity

24X7 Research Support
Continuous support to ensure the best customer experience.

Free Customization
Adding more values to your product of interest.

Safe & Secure Access
Providing a secured environment for all online transactions.

Trusted by 600+ Brands
Serving the most reputed brands across the world.