
Power Trading Market
Power Trading Market Forecasts to 2034 – Global Analysis By Trading Product (Day-Ahead Market, Intraday Market, Real-Time Market, Term-Ahead and Forward Market, Ancillary Services Market, Renewable Energy and Green Power Contracts, and Capacity and Congestion Products), Transaction Type, Trading Platform, Market Participant, and By Geography

Market Dynamics:
Driver:
More frequent balancing of variable generation and changing loads
Electricity portfolios require adjustment as weather, equipment availability, and consumption deviate from earlier expectations. Greater participation by variable renewable generation increases the commercial importance of updating positions closer to delivery. Utilities and generators need products that reflect when and where power is available, while large buyers seek procurement arrangements suited to their demand profiles. These needs support trading platforms, market data, and tools that coordinate execution with operational forecasts. Demand is particularly strong where market arrangements enable participants to correct imbalances efficiently. The resulting activity rewards dependable systems and clear price formation across the relevant delivery periods and locations.
Restraint:
Fragmented market access and substantial operating requirements
Power markets differ in product design, settlement intervals, access rules, collateral requirements, and treatment of network constraints. Participants expanding into additional regions must adapt systems and procedures rather than assuming one trading model applies everywhere. Smaller organizations may find the required credit support, specialist staff, and integration work difficult to justify. Thin liquidity in some products can also make execution costly or leave exposures only partly hedged. These barriers restrain participation even when customers recognize the value of flexible procurement. Platform providers must make connectivity and operational control practical while respecting the distinct requirements of each market they serve.
Opportunity:
Trading services for storage and flexible consumption
Storage operators and flexible electricity consumers create opportunities for services that coordinate physical operation with market participation. Forecasting, optimization, and automated execution can help these assets respond to changing prices within defined technical limits. Corporate buyers also need support for renewable procurement, contract management, and the residual exposure that remains when generation does not match consumption. Providers can combine these functions with transparent reporting and risk controls. The opportunity is strongest when software translates complex market arrangements into dependable operating decisions, allowing customers to participate without building every capability internally or losing visibility into how their positions are managed.
Threat:
Extreme price movements and disruption of trading infrastructure
Abrupt changes in fuel availability, weather, generation outages, or network conditions can produce rapid price movements and large collateral demands. Participants with inadequate liquidity or poorly matched hedges may be forced to reduce activity at unfavorable times. Trading-platform outages and cyber incidents add operational threats because missed execution or incorrect positions can have immediate consequences. Market-design changes can also alter the economics of established strategies and products. These risks create pressure for resilient systems, disciplined exposure limits, and reliable reconciliation. Suppliers face reputational and commercial damage if their tools conceal material risks or fail when customers most need dependable access.
Covid-19 Impact:
COVID-19 altered electricity consumption patterns as commercial and industrial activity declined while more people remained at home. Trading teams had to reassess demand assumptions and operate under unfamiliar market conditions. Remote working also increased reliance on dependable electronic access, communications, and internal controls. Changes in generation mix and load profiles reinforced the importance of updating forecasts rather than relying on historical routines. The longer-term effect was a stronger operational focus on continuity and adaptable analytics. Market participants learned that unexpected demand shifts can affect scheduling and exposure even when the underlying electricity infrastructure remains available and functioning.
The Day-Ahead Market segment is expected to be the largest during the forecast period
Day-Ahead Market is expected to be the largest trading-product segment because advance scheduling provides a central reference for electricity production, consumption, and commercial positions. Generators can plan resource availability, while suppliers and buyers organize expected requirements before the operating day. Prices established through these arrangements also inform subsequent adjustments and portfolio analysis. The segment benefits from recurring participation by organizations with ongoing physical obligations. Its anticipated leadership reflects the foundational role of advance procurement and scheduling within organized markets, while differences between jurisdictions mean that the precise relationship with bilateral contracts and real-time settlement continues to vary by market design.
The Intraday Market segment is expected to have the highest CAGR during the forecast period
Intraday Market is forecast to register the highest product CAGR as participants refine positions after day-ahead commitments and before physical delivery. Updated weather forecasts, equipment status, and consumption information can materially change a portfolio's needs during this interval. More granular products and improved electronic connectivity make closer matching of commercial positions and physical conditions possible. Storage and flexible demand may add further participation where rules permit. Growth is expected to depend on sufficient liquidity and dependable execution, with platform design helping users manage frequent updates without losing control of exposure, settlement obligations, or the operating limits of connected assets.
Region with largest share:
Europe is expected to account for the largest regional share, reflecting its established exchanges, cross-border market arrangements, and active short-term trading environment. Participants use linked products and platforms to coordinate commercial positions across interconnected electricity systems. Expanding renewable generation and greater product granularity reinforce the value of intraday adjustment, market data, and portfolio optimization. Competition among exchanges and service providers supports continued development of execution and clearing capabilities. The regional outlook remains sensitive to network limitations and differences in national arrangements, but the depth of its trading infrastructure provides a strong foundation for sustained commercial activity across the forecast period.
Region with highest CAGR:
Asia Pacific is anticipated to achieve the highest regional CAGR as electricity procurement and market arrangements evolve across large and diverse power systems. Industrial consumers, renewable generators, and utilities can create additional demand for transparent pricing and flexible contracting where participation is permitted. Digital platforms can improve execution and position management as markets add products or widen access. Progress will differ substantially between countries because the role of organized exchanges and bilateral procurement is not uniform. The projected acceleration therefore reflects opportunities for market development and improved services, conditioned on practical access, sufficient liquidity, and integration with physical system operation.
Key players in the market
Some of the key players in the Power Trading Market include Indian Energy Exchange Limited, European Energy Exchange AG, EPEX SPOT SE, Nord Pool AS, Nasdaq Commodities, Intercontinental Exchange, Inc., Nodal Exchange, LLC, PJM Interconnection, L.L.C., California Independent System Operator Corporation, MISO Energy, Inc., CME Group Inc., Trayport Limited, Hitachi Energy Ltd., SAP SE, and Open Access Technology International, Inc..
Key Developments:
In February 2026, Nodal Exchange launched power daily futures contracts for block and electronic trading. The products extended its offering beyond monthly contracts and enabled participants to manage positions within the current month, adding greater precision to short-term power risk management.
In November 2025, Lithuania's transmission operator Litgrid confirmed that EPEX SPOT had started operating in the intraday markets of Estonia, Latvia, and Lithuania. The launch followed implementation of a Multi-NEMO arrangement, increasing exchange choice while retaining the existing principles of European market coupling.
In March 2025, Nord Pool announced the extension of fifteen-minute intraday trading, including intraday auctions in Norway and Poland and continuous products in Norway. The change enabled more detailed matching of supply and demand, supporting the adjustment of positions closer to physical delivery.
Trading Products Covered:
• Day-Ahead Market
• Intraday Market
• Real-Time Market
• Term-Ahead and Forward Market
• Ancillary Services Market
• Renewable Energy and Green Power Contracts
• Capacity and Congestion Products
Transaction Types Covered:
• Exchange-Traded Transactions
• Bilateral Physical Contracts
• Financial Derivatives and Hedging
• Retail and Direct Procurement
Trading Platforms Covered:
• Power Exchanges
• Independent System Operator and Regional Transmission Organization Markets
• Electronic Brokerage and Over-the-Counter Platforms
• Energy Trading and Risk Management Platforms
Market Participants Covered:
• Generators and Independent Power Producers
• Utilities and Retail Suppliers
• Commercial and Industrial Buyers
• Energy Traders and Financial Institutions
Regions Covered:
• North America
o United States
o Canada
o Mexico
• Europe
o United Kingdom
o Germany
o France
o Italy
o Spain
o Netherlands
o Belgium
o Sweden
o Switzerland
o Poland
o Rest of Europe
• Asia Pacific
o China
o Japan
o India
o South Korea
o Australia
o Indonesia
o Thailand
o Malaysia
o Singapore
o Vietnam
o Rest of Asia Pacific
• South America
o Brazil
o Argentina
o Colombia
o Chile
o Peru
o Rest of South America
• Rest of the World (RoW)
o Middle East
Saudi Arabia
United Arab Emirates
Qatar
Israel
Rest of Middle East
o Africa
South Africa
Egypt
Morocco
Rest of Africa
What our report offers:
- Assessment of power trading market shares by region and country
- Recommendations for new entrants selecting products, platforms, and participant groups
- Market data across 2023, 2024, 2025, 2026, 2027, 2028, 2030, 2032 and 2034
- Evaluation of drivers, constraints, opportunities, threats, challenges, investment opportunities, and recommendations
- Strategic guidance for key trading business segments drawn from the market estimations
- Competitive landscaping that maps common trends in product access and trading services
- Profiles covering company strategies, financials, and recent market developments
- Supply-chain and technology analysis spanning trading connectivity, data, and execution systems
Free Customization Offerings:
Purchasers of the power trading report are eligible to select one of these complimentary customization options:
• Company Profiling
o Comprehensive profiles of additional relevant market players (up to 3)
o SWOT analysis for key companies chosen by the purchaser (up to 3)
• Regional Segmentation
o Market estimations, forecasts, and CAGR for a prominent country aligned with the client’s interest (Note: Depends on feasibility check)
• Competitive Benchmarking
o Benchmarking of key players using product portfolio, geographical presence, and strategic alliances
Table of Contents
1 Executive Summary1.1 Market Snapshot and Key Highlights
1.2 Growth Drivers, Challenges, and Opportunities
1.3 Competitive Landscape Overview
1.4 Strategic Insights and Recommendations
2 Research Framework
2.1 Study Objectives and Scope
2.2 Stakeholder Analysis
2.3 Research Assumptions and Limitations
2.4 Research Methodology
2.4.1 Data Collection (Primary and Secondary)
2.4.2 Data Modeling and Estimation Techniques
2.4.3 Data Validation and Triangulation
2.4.4 Analytical and Forecasting Approach
3 Market Dynamics and Trend Analysis
3.1 Market Definition and Structure
3.2 Key Market Drivers
3.3 Market Restraints and Challenges
3.4 Growth Opportunities and Investment Hotspots
3.5 Industry Threats and Risk Assessment
3.6 Technology and Innovation Landscape
3.7 Emerging and High-Growth Markets
3.8 Regulatory and Policy Environment
3.9 Impact of COVID-19 and Recovery Outlook
4 Competitive and Strategic Assessment
4.1 Porter's Five Forces Analysis
4.1.1 Supplier Bargaining Power
4.1.2 Buyer Bargaining Power
4.1.3 Threat of Substitutes
4.1.4 Threat of New Entrants
4.1.5 Competitive Rivalry
4.2 Market Share Analysis of Key Players
4.3 Product Benchmarking and Performance Comparison
5 Global Power Trading Market, By Trading Product
5.1 Day-Ahead Market
5.2 Intraday Market
5.3 Real-Time Market
5.4 Term-Ahead and Forward Market
5.5 Ancillary Services Market
5.6 Renewable Energy and Green Power Contracts
5.7 Capacity and Congestion Products
6 Global Power Trading Market, By Transaction Type
6.1 Exchange-Traded Transactions
6.2 Bilateral Physical Contracts
6.3 Financial Derivatives and Hedging
6.4 Retail and Direct Procurement
7 Global Power Trading Market, By Trading Platform
7.1 Power Exchanges
7.2 Independent System Operator and Regional Transmission Organization Markets
7.3 Electronic Brokerage and Over-the-Counter Platforms
7.4 Energy Trading and Risk Management Platforms
8 Global Power Trading Market, By Market Participant
8.1 Generators and Independent Power Producers
8.2 Utilities and Retail Suppliers
8.3 Commercial and Industrial Buyers
8.4 Energy Traders and Financial Institutions
9 Global Power Trading Market, By Geography
9.1 North America
9.1.1 United States
9.1.2 Canada
9.1.3 Mexico
9.2 Europe
9.2.1 United Kingdom
9.2.2 Germany
9.2.3 France
9.2.4 Italy
9.2.5 Spain
9.2.6 Netherlands
9.2.7 Belgium
9.2.8 Sweden
9.2.9 Switzerland
9.2.10 Poland
9.2.11 Rest of Europe
9.3 Asia Pacific
9.3.1 China
9.3.2 Japan
9.3.3 India
9.3.4 South Korea
9.3.5 Australia
9.3.6 Indonesia
9.3.7 Thailand
9.3.8 Malaysia
9.3.9 Singapore
9.3.10 Vietnam
9.3.11 Rest of Asia Pacific
9.4 South America
9.4.1 Brazil
9.4.2 Argentina
9.4.3 Colombia
9.4.4 Chile
9.4.5 Peru
9.4.6 Rest of South America
9.5 Rest of the World (RoW)
9.5.1 Middle East
9.5.1.1 Saudi Arabia
9.5.1.2 United Arab Emirates
9.5.1.3 Qatar
9.5.1.4 Israel
9.5.1.5 Rest of Middle East
9.5.2 Africa
9.5.2.1 South Africa
9.5.2.2 Egypt
9.5.2.3 Morocco
9.5.2.4 Rest of Africa
10 Strategic Market Intelligence
10.1 Industry Value Network and Supply Chain Assessment
10.2 White-Space and Opportunity Mapping
10.3 Product Evolution and Market Life Cycle Analysis
10.4 Channel, Distributor, and Go-to-Market Assessment
11 Industry Developments and Strategic Initiatives
11.1 Mergers and Acquisitions
11.2 Partnerships, Alliances, and Joint Ventures
11.3 New Product Launches and Certifications
11.4 Capacity Expansion and Investments
11.5 Other Strategic Initiatives
12 Company Profiles
12.1 Indian Energy Exchange Limited
12.2 European Energy Exchange AG
12.3 EPEX SPOT SE
12.4 Nord Pool AS
12.5 Nasdaq Commodities
12.6 Intercontinental Exchange, Inc.
12.7 Nodal Exchange, LLC
12.8 PJM Interconnection, L.L.C.
12.9 California Independent System Operator Corporation
12.10 MISO Energy, Inc.
12.11 CME Group Inc.
12.12 Trayport Limited
12.13 Hitachi Energy Ltd.
12.14 SAP SE
12.15 Open Access Technology International, Inc.
List of Tables
1 Global Power Trading Market Outlook, By Region (2023–2034) ($MN)
2 Global Power Trading Market Outlook, By Trading Product (2023–2034) ($MN)
3 Global Power Trading Market Outlook, By Day-Ahead Market (2023–2034) ($MN)
4 Global Power Trading Market Outlook, By Intraday Market (2023–2034) ($MN)
5 Global Power Trading Market Outlook, By Real-Time Market (2023–2034) ($MN)
6 Global Power Trading Market Outlook, By Term-Ahead and Forward Market (2023–2034) ($MN)
7 Global Power Trading Market Outlook, By Ancillary Services Market (2023–2034) ($MN)
8 Global Power Trading Market Outlook, By Renewable Energy and Green Power Contracts (2023–2034) ($MN)
9 Global Power Trading Market Outlook, By Capacity and Congestion Products (2023–2034) ($MN)
10 Global Power Trading Market Outlook, By Transaction Type (2023–2034) ($MN)
11 Global Power Trading Market Outlook, By Exchange-Traded Transactions (2023–2034) ($MN)
12 Global Power Trading Market Outlook, By Bilateral Physical Contracts (2023–2034) ($MN)
13 Global Power Trading Market Outlook, By Financial Derivatives and Hedging (2023–2034) ($MN)
14 Global Power Trading Market Outlook, By Retail and Direct Procurement (2023–2034) ($MN)
15 Global Power Trading Market Outlook, By Trading Platform (2023–2034) ($MN)
16 Global Power Trading Market Outlook, By Power Exchanges (2023–2034) ($MN)
17 Global Power Trading Market Outlook, By Independent System Operator and Regional Transmission Organization Markets (2023–2034) ($MN)
18 Global Power Trading Market Outlook, By Electronic Brokerage and Over-the-Counter Platforms (2023–2034) ($MN)
19 Global Power Trading Market Outlook, By Energy Trading and Risk Management Platforms (2023–2034) ($MN)
20 Global Power Trading Market Outlook, By Market Participant (2023–2034) ($MN)
21 Global Power Trading Market Outlook, By Generators and Independent Power Producers (2023–2034) ($MN)
22 Global Power Trading Market Outlook, By Utilities and Retail Suppliers (2023–2034) ($MN)
23 Global Power Trading Market Outlook, By Commercial and Industrial Buyers (2023–2034) ($MN)
24 Global Power Trading Market Outlook, By Energy Traders and Financial Institutions (2023–2034) ($MN)
Note: Tables for North America, Europe, APAC, South America, and Rest of the World (RoW) Regions are also represented in the same manner as above.
List of Figures
RESEARCH METHODOLOGY
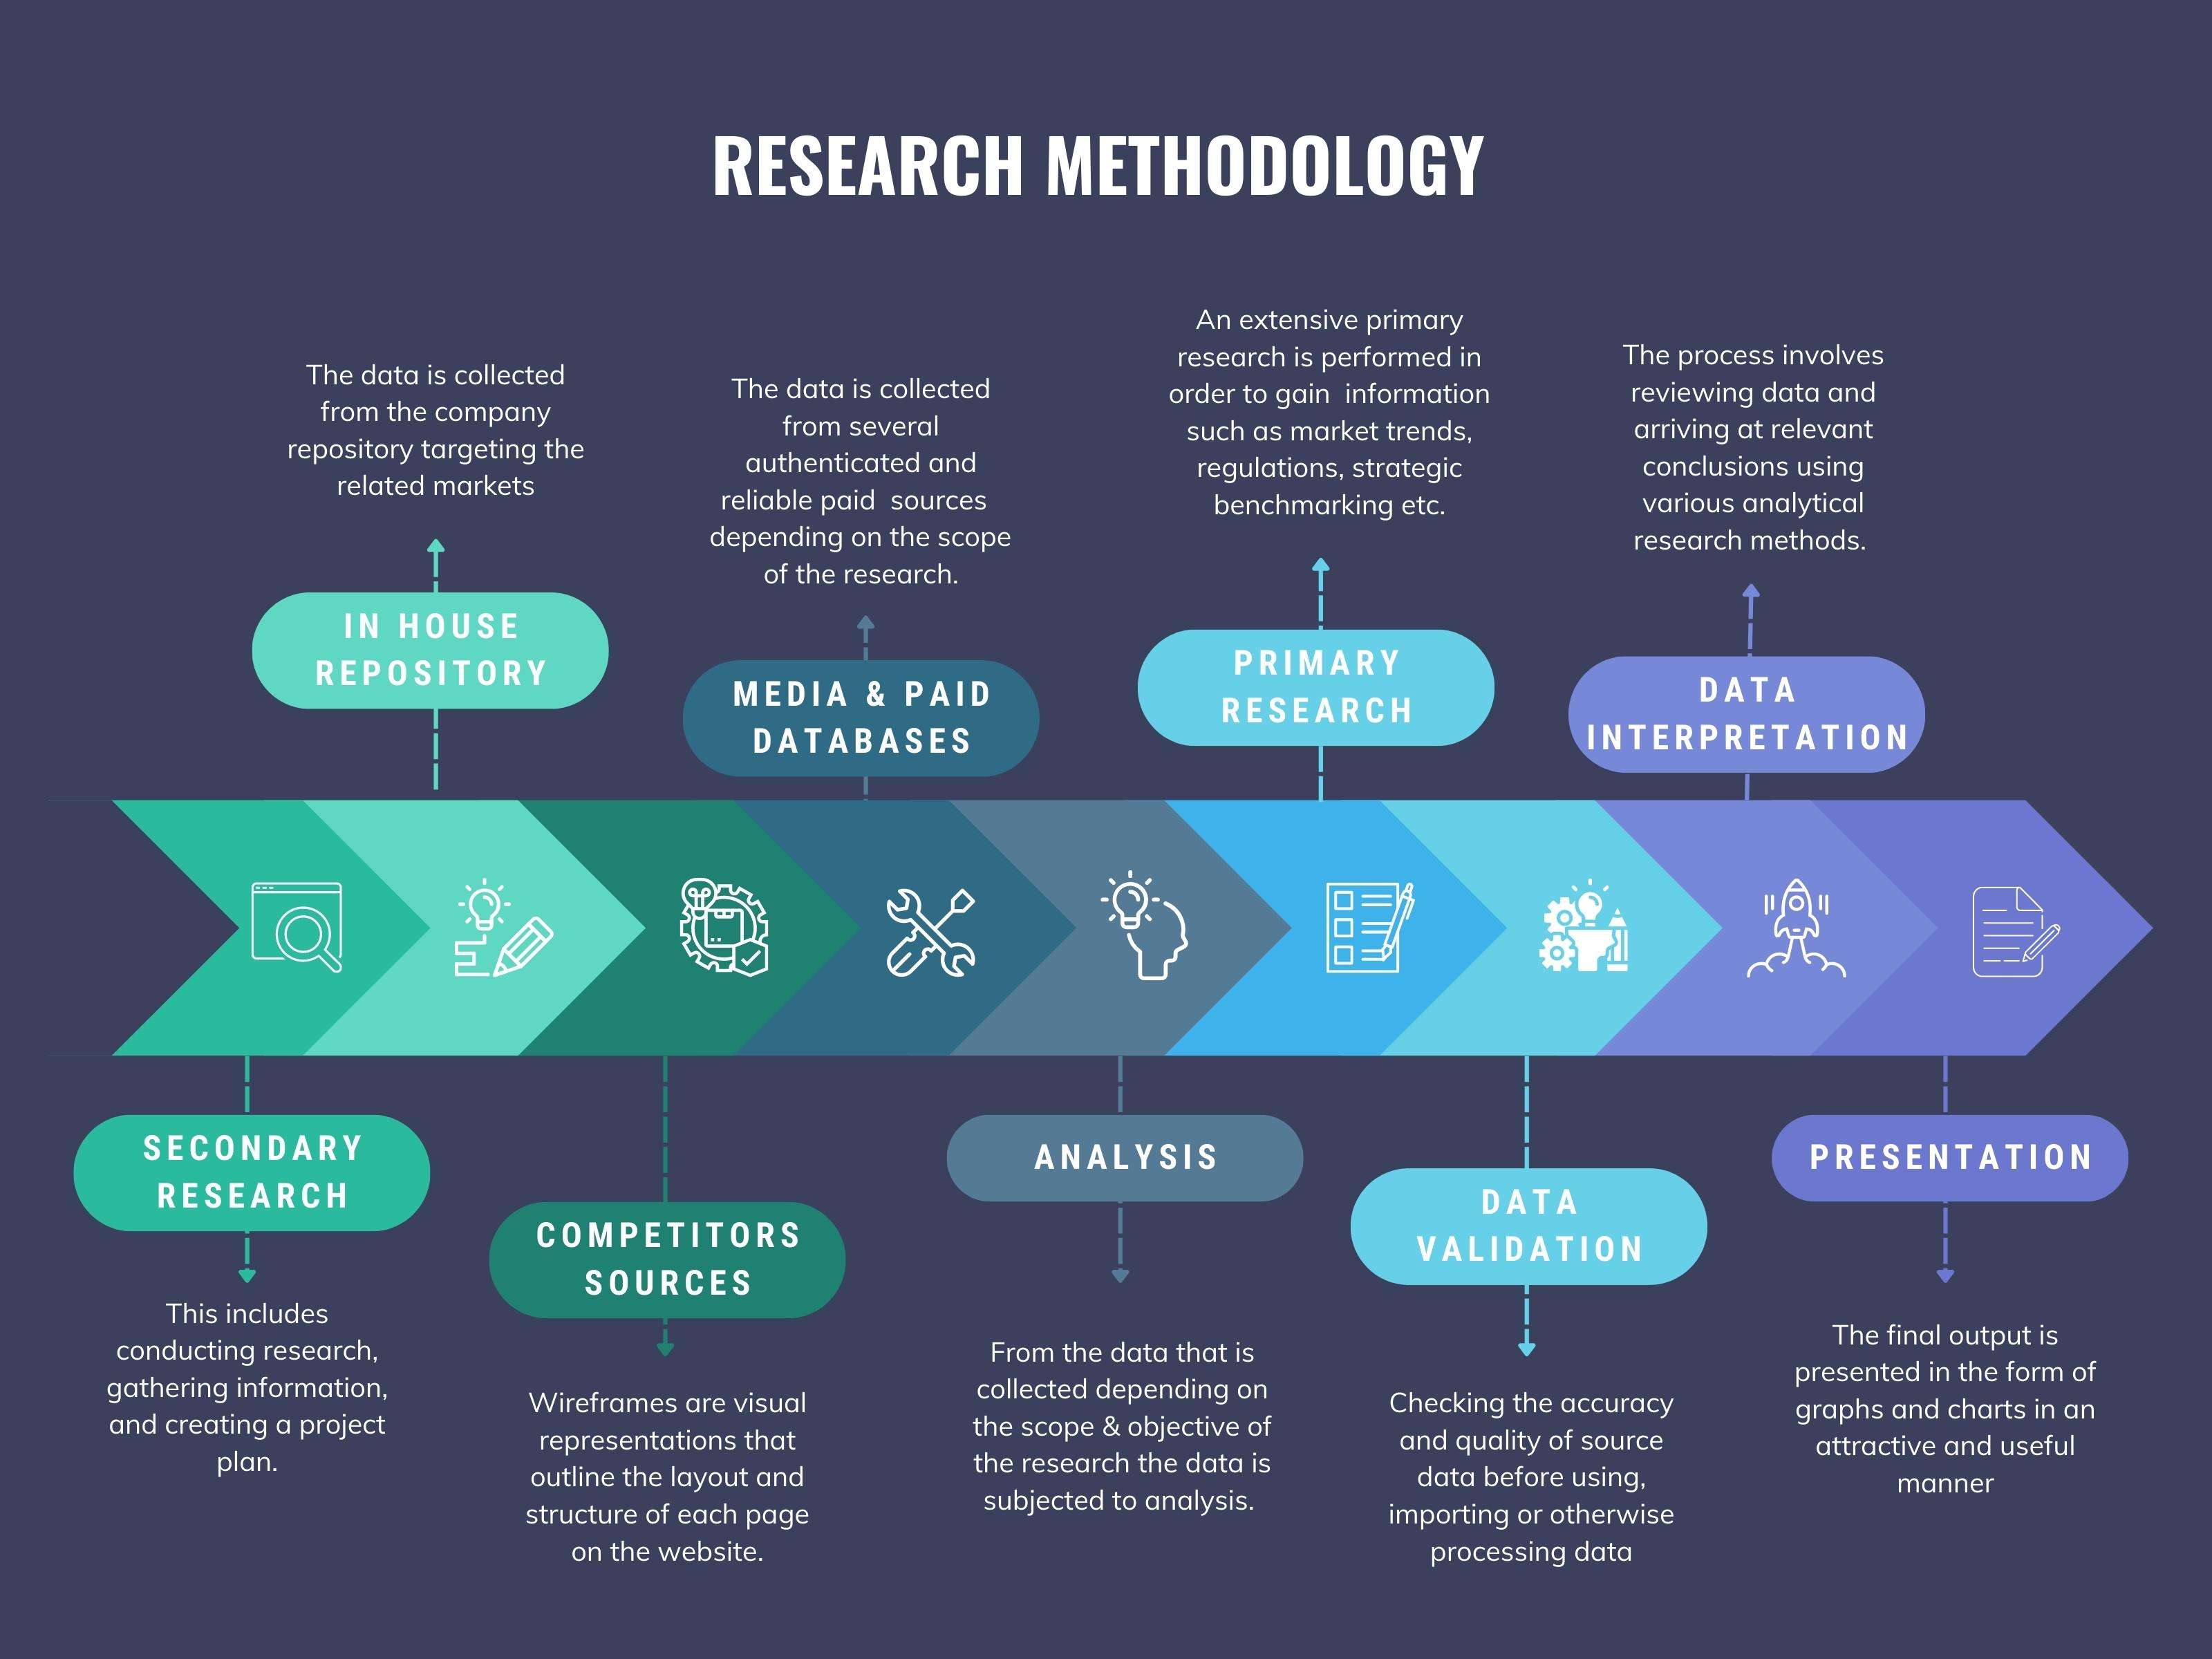
We at ‘Stratistics’ opt for an extensive research approach which involves data mining, data validation, and data analysis. The various research sources include in-house repository, secondary research, competitor’s sources, social media research, client internal data, and primary research.
Our team of analysts prefers the most reliable and authenticated data sources in order to perform the comprehensive literature search. With access to most of the authenticated data bases our team highly considers the best mix of information through various sources to obtain extensive and accurate analysis.
Each report takes an average time of a month and a team of 4 industry analysts. The time may vary depending on the scope and data availability of the desired market report. The various parameters used in the market assessment are standardized in order to enhance the data accuracy.
Data Mining
The data is collected from several authenticated, reliable, paid and unpaid sources and is filtered depending on the scope & objective of the research. Our reports repository acts as an added advantage in this procedure. Data gathering from the raw material suppliers, distributors and the manufacturers is performed on a regular basis, this helps in the comprehensive understanding of the products value chain. Apart from the above mentioned sources the data is also collected from the industry consultants to ensure the objective of the study is in the right direction.
Market trends such as technological advancements, regulatory affairs, market dynamics (Drivers, Restraints, Opportunities and Challenges) are obtained from scientific journals, market related national & international associations and organizations.
Data Analysis
From the data that is collected depending on the scope & objective of the research the data is subjected for the analysis. The critical steps that we follow for the data analysis include:
- Product Lifecycle Analysis
- Competitor analysis
- Risk analysis
- Porters Analysis
- PESTEL Analysis
- SWOT Analysis
The data engineering is performed by the core industry experts considering both the Marketing Mix Modeling and the Demand Forecasting. The marketing mix modeling makes use of multiple-regression techniques to predict the optimal mix of marketing variables. Regression factor is based on a number of variables and how they relate to an outcome such as sales or profits.
Data Validation
The data validation is performed by the exhaustive primary research from the expert interviews. This includes telephonic interviews, focus groups, face to face interviews, and questionnaires to validate our research from all aspects. The industry experts we approach come from the leading firms, involved in the supply chain ranging from the suppliers, distributors to the manufacturers and consumers so as to ensure an unbiased analysis.
We are in touch with more than 15,000 industry experts with the right mix of consultants, CEO's, presidents, vice presidents, managers, experts from both supply side and demand side, executives and so on.
The data validation involves the primary research from the industry experts belonging to:
- Leading Companies
- Suppliers & Distributors
- Manufacturers
- Consumers
- Industry/Strategic Consultants
Apart from the data validation the primary research also helps in performing the fill gap research, i.e. providing solutions for the unmet needs of the research which helps in enhancing the reports quality.
For more details about research methodology, kindly write to us at info@strategymrc.com
Frequently Asked Questions
In case of any queries regarding this report, you can contact the customer service by filing the “Inquiry Before Buy” form available on the right hand side. You may also contact us through email: info@strategymrc.com or phone: +1-301-202-5929
Yes, the samples are available for all the published reports. You can request them by filling the “Request Sample” option available in this page.
Yes, you can request a sample with your specific requirements. All the customized samples will be provided as per the requirement with the real data masked.
All our reports are available in Digital PDF format. In case if you require them in any other formats, such as PPT, Excel etc you can submit a request through “Inquiry Before Buy” form available on the right hand side. You may also contact us through email: info@strategymrc.com or phone: +1-301-202-5929
We offer a free 15% customization with every purchase. This requirement can be fulfilled for both pre and post sale. You may send your customization requirements through email at info@strategymrc.com or call us on +1-301-202-5929.
We have 3 different licensing options available in electronic format.
- Single User Licence: Allows one person, typically the buyer, to have access to the ordered product. The ordered product cannot be distributed to anyone else.
- 2-5 User Licence: Allows the ordered product to be shared among a maximum of 5 people within your organisation.
- Corporate License: Allows the product to be shared among all employees of your organisation regardless of their geographical location.
All our reports are typically be emailed to you as an attachment.
To order any available report you need to register on our website. The payment can be made either through CCAvenue or PayPal payments gateways which accept all international cards.
We extend our support to 6 months post sale. A post sale customization is also provided to cover your unmet needs in the report.
Request Customization
We offer complimentary customization of up to 15% with every purchase. To share your customization requirements, feel free to email us at info@strategymrc.com or call us on +1-301-202-5929. .
Please Note: Customization within the 15% threshold is entirely free of charge. If your request exceeds this limit, we will conduct a feasibility assessment. Following that, a detailed quote and timeline will be provided.
WHY CHOOSE US ?

Assured Quality
Best in class reports with high standard of research integrity

24X7 Research Support
Continuous support to ensure the best customer experience.

Free Customization
Adding more values to your product of interest.

Safe & Secure Access
Providing a secured environment for all online transactions.

Trusted by 600+ Brands
Serving the most reputed brands across the world.