
Ready To Drink Shakes Market
Ready To Drink Shakes Market Forecasts to 2030 - Global Analysis By Source (Soy, Whey, Casein and Other Sources), Nature (Organic, Conventional and Other Natures), Packaging Type (Bottles, Tetra packs, Carton, Cans and Other Packaging Types), Flavor (Chocolate, Banana, Strawberry, Vanilla, Citrus, Berries and Other Flavors), Distribution Channel and By Geography

|
Years Covered |
2021-2030 |
|
Estimated Year Value (2023) |
US $12.04 BN |
|
Projected Year Value (2030) |
US $22.73 BN |
|
CAGR (2023 - 2030) |
9.5% |
|
Regions Covered |
North America, Europe, Asia Pacific, South America, and Middle East & Africa |
|
Countries Covered |
US, Canada, Mexico, Germany, UK, Italy, France, Spain, Japan, China, India, Australia, New Zealand, South Korea, Rest of Asia Pacific, South America, Argentina, Brazil, Chile, Middle East & Africa, Saudi Arabia, UAE, Qatar, and South Africa |
|
Largest Market |
North America |
|
Highest Growing Market |
Asia Pacific |
According to Stratistics MRC, the Global Ready To Drink Shakes Market is accounted for $12.04 billion in 2023 and is expected to reach $22.73 billion by 2030 growing at a CAGR of 9.5% during the forecast period. Ready-to-drink shakes are fast food beverages made by combining ice cream, milk, fruit syrups, whole fruits, and sweeteners into a thick, cold, and sweet concoction. They are frequently marketed as healthy beverages and have their nutritional profiles improved by adding essential vitamins, minerals, and proteins. Moreover, ready-to-drink shakes are beverages that are prepared and ready to drink. They can be consumed anytime, including during meals and post-workout etc.
According to the National Institutes of Health (NIH), around 30 to 50 million Americans are estimated to be lactose intolerant. Due to the potential health benefits a vegan diet offers, the rising vegan population may act as a significant driver for the Plant-based Ready-to-Drink Protein Beverages Market.
Market Dynamics:
Driver:
Increasing the culture of fitness
A greater need for diets high in protein has arisen as a result of the expanding fitness and sports cultures, which support muscle growth and recovery. RTD shakes are a popular choice among athletes, fitness enthusiasts, and people looking to gain or maintain muscle mass because they offer a convenient way to satisfy these protein needs. Moreover, these shakes are frequently packed with high-quality protein sources like whey, casein, or plant-based alternatives.
Restraint:
Nutrition-related issues
RTD shakes can face concerns about their nutritional value despite being marketed as convenient sources of nutrition. Consumers are becoming more and more cautious about products that contain additives, artificial flavors, and hidden sugars. Additionally, these shakes may be perceived by health-conscious people as supplemental rather than full-meal replacements because they may not contain the variety of nutrients found in whole foods.
Opportunity:
Innovation with functional ingredients
Manufacturers have the chance to investigate cutting-edge functional ingredients that provide distinct health advantages over and above basic nutrition. Additionally, researching and utilizing ingredients such as adaptogens for stress management, probiotics for gut health, and antioxidant-rich super foods can give businesses a competitive edge by satisfying customers' needs for holistic well-being in a practical way.
Threat:
Competition with fresh foods
The RTD shakes market is seriously threatened by the accessibility of fresh, whole foods in stores, eateries, and meal delivery services. Customers who value a variety of tastes, the sensory experience, and the experience of eating a freshly prepared meal may choose substitutes that provide a more satisfying and varied eating experience. Moreover, customers may turn away from RTD shakes due to the allure of customizable ingredients and the perception that freshly prepared meals have higher nutritional value.
Covid-19 Impact:
The market for ready-to-drink (RTD) shakes was significantly impacted by the COVID-19 pandemic. Lockdowns, limitations, and changes in consumer behaviour caused changes in consumption patterns and a rise in demand for options that were convenient and focused on health. Others benefited as consumers sought out products that would boost their immunity and be shelf-stable, while some segments encountered production and supply chain difficulties. However, RTD shake manufacturers adjusted by providing functional ingredients and online ordering options in response to the pandemic's increased focus on health and wellness.
The supermarkets/hypermarkets segment is expected to be the largest during the forecast period
During the forecast period, it is anticipated that supermarkets and hypermarkets will hold the largest market share. Due to the availability of a large selection of options and the ability to scan product details prior to any purchase, customers prefer using these channels to make their product purchases. Additionally, sales volumes in supermarkets and hypermarkets have also increased as a result of store layout and advertising campaigns by well-known brands. The segment has been driven by growth in the organized retail sector, which has given existing and local brands plenty of room and visibility to sell their goods.
The Tetra packs segment is expected to have the highest CAGR during the forecast period
The highest CAGR is anticipated for the Tetra Packs segment during the forecasting period. The segment is also being significantly driven by rising consumer demand for packaged goods that can be used on the go. The tetra pack is a popular choice among manufacturers because it is inexpensive. Moreover, tetra packs are easily recyclable because they are made of paperboard, polyethylene, and aluminum. Due to their strength and lightness, consumers favor them. Most of the time, seals are integrated into the caps, making them more practical for the consumer.
Region with largest share:
In the market for ready-to-drink (RTD) shakes, North America held the largest share during the forecast period. This pre-eminence could be attributed to elements like hectic lifestyles, rising health consciousness, and convenience-driven consumer preferences, which have fuelled the demand for portable, wholesome foods. Moreover, the region's sizeable market share in RTD shakes was also boosted by the presence of well-known competitors, aggressive marketing plans, and a strong distribution network.
Region with highest CAGR:
During the anticipated period, Asia Pacific is anticipated to have the highest CAGR. The market is anticipated to grow more quickly as disposable income rises, particularly in developing nations like China and India. The large millennial population in Asia Pacific is a further factor in the market's expansion. The largest market in Asia Pacific is expected to be China, which will generate USD 0.91 billion in 2025. Moreover, the demand for the product has been greatly fuelled by the fact that a sizable portion of the population is employed.

Key players in the market
Some of the key players in Ready To Drink Shakes market include Nestle S.A, Orgain, Inc, Labrada Nutrition, Hormel Foods Corporation, The J.M Smucker Company, Kellogg Company, Arla Foods, Nutrineo, Amerpharma, Starbucks Corporation, Atkin Nutritionals Inc., Pure Protein, CytoSport, Inc., Vega, The Coca-Cola Company, Post Holdings Inc., Campbell Soup Company, Bolthouse Farms Inc., PepsiCo, Inc. and Abbott Laboratories.
Key Developments:
In June 2023, Nestlé Vietnam on Tuesday signed an agreement with the Vietnamese Ministry of Agriculture and Rural Development (MARD) to support the country’s transition to regenerative and low-emission agriculture.
In March 2023, Labrada Nutrition has announced a drink distribution agreement with the All Points Network to cover the state of Michigan.
In February 2023, The J.M. Smucker Co. announced that it has entered into a definitive agreement to sell several pet food brands to Post Holdings, Inc., a consumer-packaged goods holding company headquartered in St. Louis, Missouri. The transaction is valued at approximately $1.2 billion, consisting of $700 million in cash and approximately 5.39 million shares of common stock of Post Holdings, Inc.
Sources Covered:
• Soy
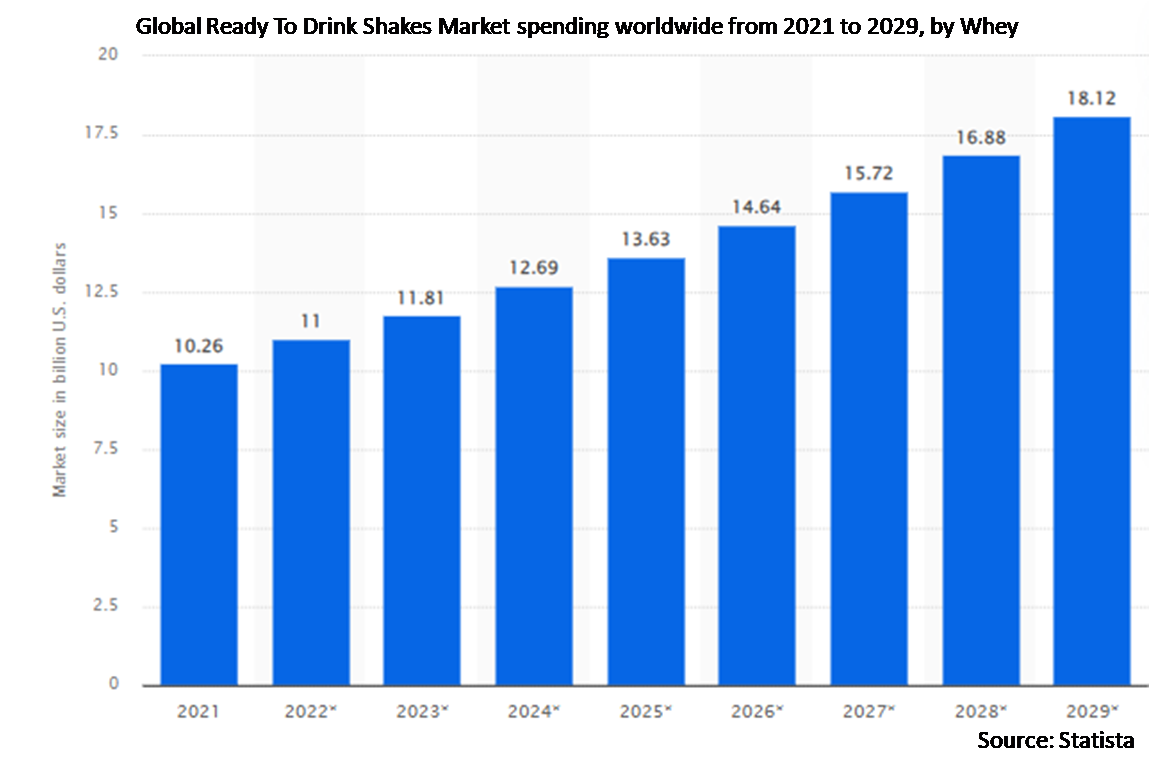
• Whey
• Casein
• Other Sources
Natures Covered:
• Organic
• Conventional
• Other Natures
Packaging Types Covered:
• Bottles
• Tetra packs
• Carton
• Cans
• Other Packaging Types
Flavors Covered:
• Chocolate
• Banana
• Strawberry
• Vanilla
• Citrus
• Berries
• Other Flavors
Distribution Channels Covered:
• Hypermarket/Supermarket
• Pharmacies/Drugstores
• Specialist Retailers
• Pharmacies
• Convenience Store
• Online Channels
• Other Distribution Channels
Regions Covered:
• North America
o US
o Canada
o Mexico
• Europe
o Germany
o UK
o Italy
o France
o Spain
o Rest of Europe
• Asia Pacific
o Japan
o China
o India
o Australia
o New Zealand
o South Korea
o Rest of Asia Pacific
• South America
o Argentina
o Brazil
o Chile
o Rest of South America
• Middle East & Africa
o Saudi Arabia
o UAE
o Qatar
o South Africa
o Rest of Middle East & Africa
What our report offers:
- Market share assessments for the regional and country-level segments
- Strategic recommendations for the new entrants
- Covers Market data for the years 2021, 2022, 2023, 2026, and 2030
- Market Trends (Drivers, Constraints, Opportunities, Threats, Challenges, Investment Opportunities, and recommendations)
- Strategic recommendations in key business segments based on the market estimations
- Competitive landscaping mapping the key common trends
- Company profiling with detailed strategies, financials, and recent developments
- Supply chain trends mapping the latest technological advancements
Free Customization Offerings:
All the customers of this report will be entitled to receive one of the following free customization options:
• Company Profiling
o Comprehensive profiling of additional market players (up to 3)
o SWOT Analysis of key players (up to 3)
• Regional Segmentation
o Market estimations, Forecasts and CAGR of any prominent country as per the client's interest (Note: Depends on feasibility check)
• Competitive Benchmarking
Benchmarking of key players based on product portfolio, geographical presence, and strategic alliances
Table of Contents
1 Executive Summary
2 Preface
2.1 Abstract
2.2 Stake Holders
2.3 Research Scope
2.4 Research Methodology
2.4.1 Data Mining
2.4.2 Data Analysis
2.4.3 Data Validation
2.4.4 Research Approach
2.5 Research Sources
2.5.1 Primary Research Sources
2.5.2 Secondary Research Sources
2.5.3 Assumptions
3 Market Trend Analysis
3.1 Introduction
3.2 Drivers
3.3 Restraints
3.4 Opportunities
3.5 Threats
3.6 Emerging Markets
3.7 Impact of Covid-19
4 Porters Five Force Analysis
4.1 Bargaining power of suppliers
4.2 Bargaining power of buyers
4.3 Threat of substitutes
4.4 Threat of new entrants
4.5 Competitive rivalry
5 Global Ready To Drink Shakes Market, By Source
5.1 Introduction
5.2 Soy
5.3 Whey
5.4 Casein
5.5 Other Sources
6 Global Ready To Drink Shakes Market, By Nature
6.1 Introduction
6.2 Organic
6.3 Conventional
6.4 Other Natures
7 Global Ready To Drink Shakes Market, By Packaging Type
7.1 Introduction
7.2 Bottles
7.3 Tetra packs
7.4 Carton
7.5 Cans
7.6 Other Packaging Types
8 Global Ready To Drink Shakes Market, By Flavor
8.1 Introduction
8.2 Chocolate
8.3 Banana
8.4 Strawberry
8.5 Vanilla
8.6 Citrus
8.7 Berries
8.8 Other Flavors
9 Global Ready To Drink Shakes Market, By Distribution Channel
9.1 Introduction
9.2 Hypermarket/Supermarket
9.3 Pharmacies/Drugstores
9.4 Specialist Retailers
9.5 Pharmacies
9.6 Convenience Store
9.7 Online Channels
9.8 Other Distribution Channels
10 Global Ready To Drink Shakes Market, By Geography
10.1 Introduction
10.2 North America
10.2.1 US
10.2.2 Canada
10.2.3 Mexico
10.3 Europe
10.3.1 Germany
10.3.2 UK
10.3.3 Italy
10.3.4 France
10.3.5 Spain
10.3.6 Rest of Europe
10.4 Asia Pacific
10.4.1 Japan
10.4.2 China
10.4.3 India
10.4.4 Australia
10.4.5 New Zealand
10.4.6 South Korea
10.4.7 Rest of Asia Pacific
10.5 South America
10.5.1 Argentina
10.5.2 Brazil
10.5.3 Chile
10.5.4 Rest of South America
10.6 Middle East & Africa
10.6.1 Saudi Arabia
10.6.2 UAE
10.6.3 Qatar
10.6.4 South Africa
10.6.5 Rest of Middle East & Africa
11 Key Developments
11.1 Agreements, Partnerships, Collaborations and Joint Ventures
11.2 Acquisitions & Mergers
11.3 New Product Launch
11.4 Expansions
11.5 Other Key Strategies
12 Company Profiling
12.1 Nestle S.A
12.2 Orgain, Inc
12.3 Labrada Nutrition
12.4 Hormel Foods Corporation
12.5 The J.M Smucker Company
12.6 Kellogg Company
12.7 Arla Foods
12.8 Nutrineo
12.9 Amerpharma
12.10 Starbucks Corporation
12.11 Atkin Nutritionals Inc.
12.12 Pure Protein
12.13 CytoSport, Inc.
12.14 Vega
12.15 The Coca-Cola Company
12.16 Post Holdings Inc.
12.17 Campbell Soup Company
12.18 Bolthouse Farms Inc.,
12.19 PepsiCo, Inc.
12.20 Abbott Laboratories
List of Tables
1 Global Ready To Drink Shakes Market Outlook, By Region (2021-2030) ($MN)
2 Global Ready To Drink Shakes Market Outlook, By Source (2021-2030) ($MN)
3 Global Ready To Drink Shakes Market Outlook, By Soy (2021-2030) ($MN)
4 Global Ready To Drink Shakes Market Outlook, By Whey (2021-2030) ($MN)
5 Global Ready To Drink Shakes Market Outlook, By Casein (2021-2030) ($MN)
6 Global Ready To Drink Shakes Market Outlook, By Other Sources (2021-2030) ($MN)
7 Global Ready To Drink Shakes Market Outlook, By Nature (2021-2030) ($MN)
8 Global Ready To Drink Shakes Market Outlook, By Organic (2021-2030) ($MN)
9 Global Ready To Drink Shakes Market Outlook, By Conventional (2021-2030) ($MN)
10 Global Ready To Drink Shakes Market Outlook, By Other Natures (2021-2030) ($MN)
11 Global Ready To Drink Shakes Market Outlook, By Packaging Type (2021-2030) ($MN)
12 Global Ready To Drink Shakes Market Outlook, By Bottles (2021-2030) ($MN)
13 Global Ready To Drink Shakes Market Outlook, By Tetra packs (2021-2030) ($MN)
14 Global Ready To Drink Shakes Market Outlook, By Carton (2021-2030) ($MN)
15 Global Ready To Drink Shakes Market Outlook, By Cans (2021-2030) ($MN)
16 Global Ready To Drink Shakes Market Outlook, By Other Packaging Types (2021-2030) ($MN)
17 Global Ready To Drink Shakes Market Outlook, By Flavor (2021-2030) ($MN)
18 Global Ready To Drink Shakes Market Outlook, By Chocolate (2021-2030) ($MN)
19 Global Ready To Drink Shakes Market Outlook, By Banana (2021-2030) ($MN)
20 Global Ready To Drink Shakes Market Outlook, By Strawberry (2021-2030) ($MN)
21 Global Ready To Drink Shakes Market Outlook, By Vanilla (2021-2030) ($MN)
22 Global Ready To Drink Shakes Market Outlook, By Citrus (2021-2030) ($MN)
23 Global Ready To Drink Shakes Market Outlook, By Berries (2021-2030) ($MN)
24 Global Ready To Drink Shakes Market Outlook, By Other Flavors (2021-2030) ($MN)
25 Global Ready To Drink Shakes Market Outlook, By Distribution Channel (2021-2030) ($MN)
26 Global Ready To Drink Shakes Market Outlook, By Hypermarket/Supermarket (2021-2030) ($MN)
27 Global Ready To Drink Shakes Market Outlook, By Pharmacies/Drugstores (2021-2030) ($MN)
28 Global Ready To Drink Shakes Market Outlook, By Specialist Retailers (2021-2030) ($MN)
29 Global Ready To Drink Shakes Market Outlook, By Pharmacies (2021-2030) ($MN)
30 Global Ready To Drink Shakes Market Outlook, By Convenience Store (2021-2030) ($MN)
31 Global Ready To Drink Shakes Market Outlook, By Online Channels (2021-2030) ($MN)
32 Global Ready To Drink Shakes Market Outlook, By Other Distribution Channels (2021-2030) ($MN)
Note: Tables for North America, Europe, APAC, South America, and Middle East & Africa Regions are also represented in the same manner as above.
List of Figures
RESEARCH METHODOLOGY

We at ‘Stratistics’ opt for an extensive research approach which involves data mining, data validation, and data analysis. The various research sources include in-house repository, secondary research, competitor’s sources, social media research, client internal data, and primary research.
Our team of analysts prefers the most reliable and authenticated data sources in order to perform the comprehensive literature search. With access to most of the authenticated data bases our team highly considers the best mix of information through various sources to obtain extensive and accurate analysis.
Each report takes an average time of a month and a team of 4 industry analysts. The time may vary depending on the scope and data availability of the desired market report. The various parameters used in the market assessment are standardized in order to enhance the data accuracy.
Data Mining
The data is collected from several authenticated, reliable, paid and unpaid sources and is filtered depending on the scope & objective of the research. Our reports repository acts as an added advantage in this procedure. Data gathering from the raw material suppliers, distributors and the manufacturers is performed on a regular basis, this helps in the comprehensive understanding of the products value chain. Apart from the above mentioned sources the data is also collected from the industry consultants to ensure the objective of the study is in the right direction.
Market trends such as technological advancements, regulatory affairs, market dynamics (Drivers, Restraints, Opportunities and Challenges) are obtained from scientific journals, market related national & international associations and organizations.
Data Analysis
From the data that is collected depending on the scope & objective of the research the data is subjected for the analysis. The critical steps that we follow for the data analysis include:
- Product Lifecycle Analysis
- Competitor analysis
- Risk analysis
- Porters Analysis
- PESTEL Analysis
- SWOT Analysis
The data engineering is performed by the core industry experts considering both the Marketing Mix Modeling and the Demand Forecasting. The marketing mix modeling makes use of multiple-regression techniques to predict the optimal mix of marketing variables. Regression factor is based on a number of variables and how they relate to an outcome such as sales or profits.
Data Validation
The data validation is performed by the exhaustive primary research from the expert interviews. This includes telephonic interviews, focus groups, face to face interviews, and questionnaires to validate our research from all aspects. The industry experts we approach come from the leading firms, involved in the supply chain ranging from the suppliers, distributors to the manufacturers and consumers so as to ensure an unbiased analysis.
We are in touch with more than 15,000 industry experts with the right mix of consultants, CEO's, presidents, vice presidents, managers, experts from both supply side and demand side, executives and so on.
The data validation involves the primary research from the industry experts belonging to:
- Leading Companies
- Suppliers & Distributors
- Manufacturers
- Consumers
- Industry/Strategic Consultants
Apart from the data validation the primary research also helps in performing the fill gap research, i.e. providing solutions for the unmet needs of the research which helps in enhancing the reports quality.
For more details about research methodology, kindly write to us at info@strategymrc.com
Frequently Asked Questions
In case of any queries regarding this report, you can contact the customer service by filing the “Inquiry Before Buy” form available on the right hand side. You may also contact us through email: info@strategymrc.com or phone: +1-301-202-5929
Yes, the samples are available for all the published reports. You can request them by filling the “Request Sample” option available in this page.
Yes, you can request a sample with your specific requirements. All the customized samples will be provided as per the requirement with the real data masked.
All our reports are available in Digital PDF format. In case if you require them in any other formats, such as PPT, Excel etc you can submit a request through “Inquiry Before Buy” form available on the right hand side. You may also contact us through email: info@strategymrc.com or phone: +1-301-202-5929
We offer a free 15% customization with every purchase. This requirement can be fulfilled for both pre and post sale. You may send your customization requirements through email at info@strategymrc.com or call us on +1-301-202-5929.
We have 3 different licensing options available in electronic format.
- Single User Licence: Allows one person, typically the buyer, to have access to the ordered product. The ordered product cannot be distributed to anyone else.
- 2-5 User Licence: Allows the ordered product to be shared among a maximum of 5 people within your organisation.
- Corporate License: Allows the product to be shared among all employees of your organisation regardless of their geographical location.
All our reports are typically be emailed to you as an attachment.
To order any available report you need to register on our website. The payment can be made either through CCAvenue or PayPal payments gateways which accept all international cards.
We extend our support to 6 months post sale. A post sale customization is also provided to cover your unmet needs in the report.
Request Customization
We offer complimentary customization of up to 15% with every purchase. To share your customization requirements, feel free to email us at info@strategymrc.com or call us on +1-301-202-5929. .
Please Note: Customization within the 15% threshold is entirely free of charge. If your request exceeds this limit, we will conduct a feasibility assessment. Following that, a detailed quote and timeline will be provided.
WHY CHOOSE US ?

Assured Quality
Best in class reports with high standard of research integrity

24X7 Research Support
Continuous support to ensure the best customer experience.

Free Customization
Adding more values to your product of interest.

Safe & Secure Access
Providing a secured environment for all online transactions.

Trusted by 600+ Brands
Serving the most reputed brands across the world.