
Retail Analytics Market
Retail Analytics Market Forecasts to 2032 - Global Analysis By Solution (Software and Service), Deployment, Retail Store Type, Field Crowdsourcing, Application and By Geography

|
Years Covered |
2022-2032 |
|
Estimated Year Value (2025) |
US $5.1 BN |
|
Projected Year Value (2032) |
US $20.4 BN |
|
CAGR (2025 - 2032) |
21.7% |
|
Regions Covered |
North America, Europe, Asia Pacific, South America, and Middle East & Africa |
|
Countries Covered |
US, Canada, Mexico, Germany, UK, Italy, France, Spain, Japan, China, India, Australia, New Zealand, South Korea, Rest of Asia Pacific, South America, Argentina, Brazil, Chile, Middle East & Africa, Saudi Arabia, UAE, Qatar, and South Africa |
|
Largest Market |
Asia Pacific |
|
Highest Growing Market |
North America |
According to Stratistics MRC, the Global Retail Analytics Market is accounted for $5.1 billion in 2025 and is expected to reach $20.4 billion by 2032 growing at a CAGR of 21.7% during the forecast period. Retail Analytics involves the use of data and quantitative methods to gain insights into customer behavior, sales trends, and operational efficiency within the retail sector. It encompasses analyzing point-of-sale data, inventory levels, customer demographics, marketing campaign effectiveness, and supply chain performance. By leveraging tools like business intelligence platforms and machine learning, retailers can optimize pricing strategies, personalize customer experiences, forecast demand, manage stock more efficiently, and make data-driven decisions to boost profitability and competitiveness.
According to Google's Zero Moment Of Truth (ZMOT) research, 70% of consumers research online before purchasing in-store.
Market Dynamics:
Driver:
Proliferation of data from diverse channels
The retail analytics market is propelled by the explosion of data generated from online, in-store, and mobile channels, enabling data-driven decision-making. E-commerce platforms and social media interactions provide rich datasets for customer behavior analysis. The integration of IoT devices in retail environments captures real-time data on inventory and foot traffic. Growing consumer demand for personalized shopping experiences drives the adoption of analytics tools. Retailers leverage these insights to optimize pricing, promotions, and supply chain operations.
Restraint:
Integration challenges with legacy systems
Many retailers face difficulties integrating modern analytics platforms with outdated legacy systems, hindering adoption. The complexity of migrating large datasets to cloud-based solutions increases implementation costs. Inconsistent data formats across legacy systems lead to inefficiencies in analytics processes. SMEs often lack the technical expertise to manage integration, limiting market growth. The need for customized integration solutions further escalates expenses for retailers. These challenges slow the deployment of advanced analytics tools in traditional retail settings.
Opportunity:
Advancements in AI and machine learning (ML)
The integration of AI and ML in retail analytics offers opportunities to enhance predictive modeling and customer segmentation. AI-driven tools enable real-time demand forecasting, optimizing inventory management. Machine learning algorithms improve recommendation engines, boosting customer engagement and sales. The growing availability of cloud-based AI platforms makes advanced analytics accessible to smaller retailers. These advancements are expected to create new revenue streams and enhance operational efficiency.
Threat:
Data silos and poor data quality
Data silos across departments prevent retailers from achieving a unified view of customer and operational data. Poor data quality, such as incomplete or inaccurate datasets, undermines the reliability of analytics insights. The lack of standardized data governance practices complicates data integration efforts. Retailers risk making flawed decisions based on inconsistent or outdated information. The high cost of data cleansing and management poses challenges for smaller firms. These issues threaten the effectiveness of analytics solutions and market growth.
Covid-19 Impact:
The COVID-19 pandemic accelerated the adoption of retail analytics as retailers pivoted to online and omnichannel strategies. Lockdowns increased reliance on e-commerce, driving demand for analytics to track online consumer behavior. Supply chain disruptions prompted retailers to use analytics for inventory optimization and demand forecasting. However, reduced in-store traffic initially limited data collection from physical channels. Post-pandemic, the focus on personalized customer experiences continues to fuel market expansion.
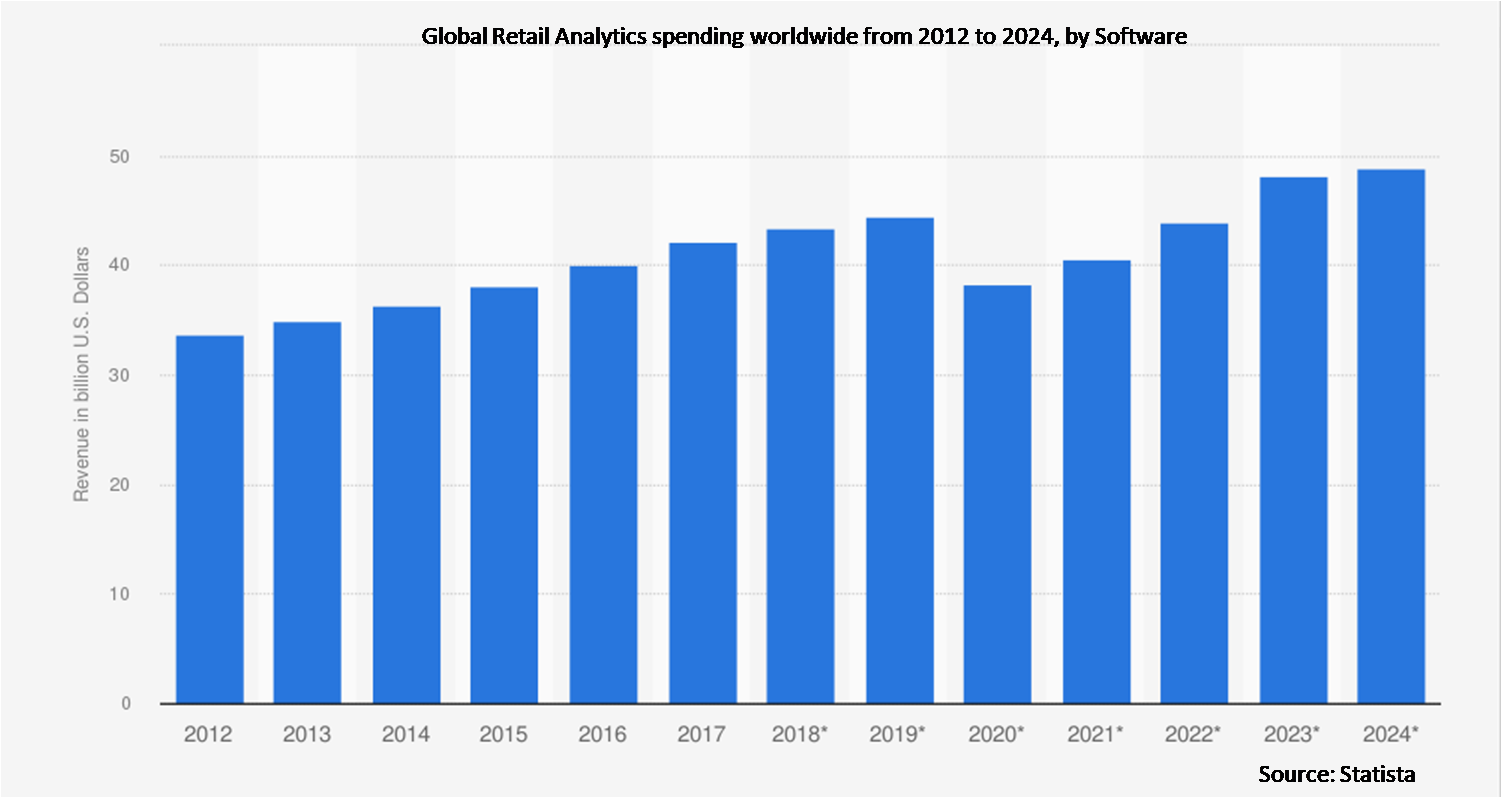
The software segment is expected to be the largest during the forecast period
The software segment is expected to account for the largest market share during the forecast period propelled by the growing demand for advanced analytics platforms to process omnichannel data. Tools like Tableau and Power BI enable retailers to visualize and analyze complex datasets effectively. Scalable cloud-based platforms make analytics accessible to retailers of all sizes. The need for real-time insights to optimize pricing and promotions drives software adoption. Continuous updates and integrations with e-commerce platforms further boost this segment’s dominance.
The documentation & reporting segment is expected to have the highest CAGR during the forecast period
Over the forecast period, the documentation & reporting segment is predicted to witness the highest growth rate, influenced by the increasing use of AI and ML for forecasting consumer trends. The integration of predictive analytics with CRM systems enhances personalized marketing strategies. Growing investments in big data technologies support the development of advanced predictive models. Retailers are leveraging these insights to optimize supply chains and improve customer retention. The segment’s growth is further driven by the need for competitive differentiation in a crowded market.
Region with largest share:
During the forecast period, the Asia Pacific region is expected to hold the largest market share, fueled by rapid digitalization and the expansion of e-commerce in countries like China and India. The growing middle class and increasing smartphone penetration drive online retail growth. Retailers in the region are adopting analytics to enhance customer experiences and optimize operations. The rise of tech-savvy startups in the region fuels demand for cost-effective analytics solutions. High internet connectivity and cloud adoption further accelerate market growth.
Region with highest CAGR:
Over the forecast period, the North America region is anticipated to exhibit the highest CAGR, driven by its advanced technological infrastructure and widespread adoption of analytics solutions. The presence of major players like IBM and Microsoft fosters innovation in retail analytics. The region’s strong retail sector, particularly in the U.S., supports rapid adoption of analytics platforms. Investments in cloud computing and big data technologies enhance the scalability of solutions. The focus on omnichannel strategies and data-driven decision-making accelerates market growth.

Key players in the market
Some of the key players in Retail Analytics Market include SAP SE, IBM Corporation, Oracle Corporation, Salesforce Inc. (Tableau), SAS Institute Inc., QlikTech International AB, Microsoft Corp. (Power BI, Dynamics 365), Amazon Web Services Inc. (QuickSight), Google LLC (Looker), Blue Yonder Inc., Dunnhumby Ltd., Teradata Corp., RetailNext Inc., Zebra Technologies Corp., Altair Engineering Inc., Alteryx Inc., MicroStrategy Inc., ThoughtSpot Inc., and Infor Inc.
Key Developments:
In June 2025, SAP SE launched SAP Retail Cloud Insights, a real-time analytics dashboard offering AI-driven demand sensing and dynamic pricing tools for omnichannel retailers.
In May 2025, Salesforce Inc. (Tableau) announced native integration of Einstein AI within Tableau to enhance predictive analytics for inventory and customer engagement.
In April 2025, Microsoft Corp. expanded Power BI retail templates for supply chain visibility and in-store analytics, optimized for Dynamics 365 users.
In March 2025, QlikTech International AB introduced Qlik AutoML for retailers, helping non-technical users build and deploy machine learning models to optimize shelf placement and promotions.
Solutions Covered:
• Software
• Service
Deployments Covered:
• On-Premise
• Cloud
Retail Store Types Covered:
• Hypermarkets & Supermarkets
• Retail Chains
Field Crowdsourcings Covered:
• On-shelf Availability
• Documentation & Reporting
• Promotion Campaign Management
• Customer Insights
Applications Covered:
• Customer Management
• In-store Operation
• Strategy & Planning
• Supply Chain Management
• Marketing & Merchandizing
• Other Applications
Regions Covered:
• North America
o US
o Canada
o Mexico
• Europe
o Germany
o UK
o Italy
o France
o Spain
o Rest of Europe
• Asia Pacific
o Japan
o China
o India
o Australia
o New Zealand
o South Korea
o Rest of Asia Pacific
• South America
o Argentina
o Brazil
o Chile
o Rest of South America
• Middle East & Africa
o Saudi Arabia
o UAE
o Qatar
o South Africa
o Rest of Middle East & Africa
What our report offers:
- Market share assessments for the regional and country-level segments
- Strategic recommendations for the new entrants
- Covers Market data for the years 2024, 2025, 2026, 2028, and 2032
- Market Trends (Drivers, Constraints, Opportunities, Threats, Challenges, Investment Opportunities, and recommendations)
- Strategic recommendations in key business segments based on the market estimations
- Competitive landscaping mapping the key common trends
- Company profiling with detailed strategies, financials, and recent developments
- Supply chain trends mapping the latest technological advancements
Free Customization Offerings:
All the customers of this report will be entitled to receive one of the following free customization options:
• Company Profiling
o Comprehensive profiling of additional market players (up to 3)
o SWOT Analysis of key players (up to 3)
• Regional Segmentation
o Market estimations, Forecasts and CAGR of any prominent country as per the client's interest (Note: Depends on feasibility check)
• Competitive Benchmarking
o Benchmarking of key players based on product portfolio, geographical presence, and strategic alliances
Table of Contents
1 Executive Summary
2 Preface
2.1 Abstract
2.2 Stake Holders
2.3 Research Scope
2.4 Research Methodology
2.4.1 Data Mining
2.4.2 Data Analysis
2.4.3 Data Validation
2.4.4 Research Approach
2.5 Research Sources
2.5.1 Primary Research Sources
2.5.2 Secondary Research Sources
2.5.3 Assumptions
3 Market Trend Analysis
3.1 Introduction
3.2 Drivers
3.3 Restraints
3.4 Opportunities
3.5 Threats
3.6 Application Analysis
3.7 Emerging Markets
3.8 Impact of Covid-19
4 Porters Five Force Analysis
4.1 Bargaining power of suppliers
4.2 Bargaining power of buyers
4.3 Threat of substitutes
4.4 Threat of new entrants
4.5 Competitive rivalry
5 Global Retail Analytics Market, By Solution
5.1 Introduction
5.2 Software
5.2.1 Software Analytics
5.2.2 Deployment Mode
5.3 Service
5.3.1 Training & Consulting
5.3.2 Integration & deployment
5.3.3 Managed Service
6 Global Retail Analytics Market, By Deployment
6.1 Introduction
6.2 On-Premise
6.3 Cloud
7 Global Retail Analytics Market, By Retail Store Type
7.1 Introduction
7.2 Hypermarkets & Supermarkets
7.3 Retail Chains
8 Global Retail Analytics Market, By Field Crowdsourcing
8.1 Introduction
8.2 On-shelf Availability
8.3 Documentation & Reporting
8.4 Promotion Campaign Management
8.5 Customer Insights
9 Global Retail Analytics Market, By Application
9.1 Introduction
9.2 Customer Management
9.3 In-store Operation
9.4 Strategy & Planning
9.5 Supply Chain Management
9.6 Marketing & Merchandizing
9.7 Other Applications
10 Global Retail Analytics Market, By Geography
10.1 Introduction
10.2 North America
10.2.1 US
10.2.2 Canada
10.2.3 Mexico
10.3 Europe
10.3.1 Germany
10.3.2 UK
10.3.3 Italy
10.3.4 France
10.3.5 Spain
10.3.6 Rest of Europe
10.4 Asia Pacific
10.4.1 Japan
10.4.2 China
10.4.3 India
10.4.4 Australia
10.4.5 New Zealand
10.4.6 South Korea
10.4.7 Rest of Asia Pacific
10.5 South America
10.5.1 Argentina
10.5.2 Brazil
10.5.3 Chile
10.5.4 Rest of South America
10.6 Middle East & Africa
10.6.1 Saudi Arabia
10.6.2 UAE
10.6.3 Qatar
10.6.4 South Africa
10.6.5 Rest of Middle East & Africa
11 Key Developments
11.1 Agreements, Partnerships, Collaborations and Joint Ventures
11.2 Acquisitions & Mergers
11.3 New Product Launch
11.4 Expansions
11.5 Other Key Strategies
12 Company Profiling
12.1 SAP SE
12.2 IBM Corporation
12.3 Oracle Corporation
12.4 Salesforce Inc. (Tableau)
12.5 SAS Institute Inc.
12.6 QlikTech International AB
12.7 Microsoft Corp. (Power BI, Dynamics 365)
12.8 Amazon Web Services Inc. (QuickSight)
12.9 Google LLC (Looker)
12.10 Blue Yonder Inc.
12.11 Dunnhumby Ltd.
12.12 Teradata Corp.
12.13 RetailNext Inc.
12.14 Zebra Technologies Corp.
12.15 Altair Engineering Inc.
12.16 Alteryx Inc.
12.17 MicroStrategy Inc.
12.18 ThoughtSpot Inc.
12.19 Infor Inc.
List of Tables
1 Global Retail Analytics Market Outlook, By Region (2024-2032) ($MN)
2 Global Retail Analytics Market Outlook, By Solution (2024-2032) ($MN)
3 Global Retail Analytics Market Outlook, By Software (2024-2032) ($MN)
4 Global Retail Analytics Market Outlook, By Software Analytics (2024-2032) ($MN)
5 Global Retail Analytics Market Outlook, By Deployment Mode (2024-2032) ($MN)
6 Global Retail Analytics Market Outlook, By Service (2024-2032) ($MN)
7 Global Retail Analytics Market Outlook, By Training & Consulting (2024-2032) ($MN)
8 Global Retail Analytics Market Outlook, By Integration & deployment (2024-2032) ($MN)
9 Global Retail Analytics Market Outlook, By Managed Service (2024-2032) ($MN)
10 Global Retail Analytics Market Outlook, By Deployment (2024-2032) ($MN)
11 Global Retail Analytics Market Outlook, By On-Premise (2024-2032) ($MN)
12 Global Retail Analytics Market Outlook, By Cloud (2024-2032) ($MN)
13 Global Retail Analytics Market Outlook, By Retail Store Type (2024-2032) ($MN)
14 Global Retail Analytics Market Outlook, By Hypermarkets & Supermarkets (2024-2032) ($MN)
15 Global Retail Analytics Market Outlook, By Retail Chains (2024-2032) ($MN)
16 Global Retail Analytics Market Outlook, By Field Crowdsourcing (2024-2032) ($MN)
17 Global Retail Analytics Market Outlook, By On-shelf Availability (2024-2032) ($MN)
18 Global Retail Analytics Market Outlook, By Documentation & Reporting (2024-2032) ($MN)
19 Global Retail Analytics Market Outlook, By Promotion Campaign Management (2024-2032) ($MN)
20 Global Retail Analytics Market Outlook, By Customer Insights (2024-2032) ($MN)
21 Global Retail Analytics Market Outlook, By Application (2024-2032) ($MN)
22 Global Retail Analytics Market Outlook, By Customer Management (2024-2032) ($MN)
23 Global Retail Analytics Market Outlook, By In-store Operation (2024-2032) ($MN)
24 Global Retail Analytics Market Outlook, By Strategy & Planning (2024-2032) ($MN)
25 Global Retail Analytics Market Outlook, By Supply Chain Management (2024-2032) ($MN)
26 Global Retail Analytics Market Outlook, By Marketing & Merchandizing (2024-2032) ($MN)
27 Global Retail Analytics Market Outlook, By Other Applications (2024-2032) ($MN)
Note: Tables for North America, Europe, APAC, South America, and Middle East & Africa Regions are also represented in the same manner as above.
List of Figures
RESEARCH METHODOLOGY

We at ‘Stratistics’ opt for an extensive research approach which involves data mining, data validation, and data analysis. The various research sources include in-house repository, secondary research, competitor’s sources, social media research, client internal data, and primary research.
Our team of analysts prefers the most reliable and authenticated data sources in order to perform the comprehensive literature search. With access to most of the authenticated data bases our team highly considers the best mix of information through various sources to obtain extensive and accurate analysis.
Each report takes an average time of a month and a team of 4 industry analysts. The time may vary depending on the scope and data availability of the desired market report. The various parameters used in the market assessment are standardized in order to enhance the data accuracy.
Data Mining
The data is collected from several authenticated, reliable, paid and unpaid sources and is filtered depending on the scope & objective of the research. Our reports repository acts as an added advantage in this procedure. Data gathering from the raw material suppliers, distributors and the manufacturers is performed on a regular basis, this helps in the comprehensive understanding of the products value chain. Apart from the above mentioned sources the data is also collected from the industry consultants to ensure the objective of the study is in the right direction.
Market trends such as technological advancements, regulatory affairs, market dynamics (Drivers, Restraints, Opportunities and Challenges) are obtained from scientific journals, market related national & international associations and organizations.
Data Analysis
From the data that is collected depending on the scope & objective of the research the data is subjected for the analysis. The critical steps that we follow for the data analysis include:
- Product Lifecycle Analysis
- Competitor analysis
- Risk analysis
- Porters Analysis
- PESTEL Analysis
- SWOT Analysis
The data engineering is performed by the core industry experts considering both the Marketing Mix Modeling and the Demand Forecasting. The marketing mix modeling makes use of multiple-regression techniques to predict the optimal mix of marketing variables. Regression factor is based on a number of variables and how they relate to an outcome such as sales or profits.
Data Validation
The data validation is performed by the exhaustive primary research from the expert interviews. This includes telephonic interviews, focus groups, face to face interviews, and questionnaires to validate our research from all aspects. The industry experts we approach come from the leading firms, involved in the supply chain ranging from the suppliers, distributors to the manufacturers and consumers so as to ensure an unbiased analysis.
We are in touch with more than 15,000 industry experts with the right mix of consultants, CEO's, presidents, vice presidents, managers, experts from both supply side and demand side, executives and so on.
The data validation involves the primary research from the industry experts belonging to:
- Leading Companies
- Suppliers & Distributors
- Manufacturers
- Consumers
- Industry/Strategic Consultants
Apart from the data validation the primary research also helps in performing the fill gap research, i.e. providing solutions for the unmet needs of the research which helps in enhancing the reports quality.
For more details about research methodology, kindly write to us at info@strategymrc.com
Frequently Asked Questions
In case of any queries regarding this report, you can contact the customer service by filing the “Inquiry Before Buy” form available on the right hand side. You may also contact us through email: info@strategymrc.com or phone: +1-301-202-5929
Yes, the samples are available for all the published reports. You can request them by filling the “Request Sample” option available in this page.
Yes, you can request a sample with your specific requirements. All the customized samples will be provided as per the requirement with the real data masked.
All our reports are available in Digital PDF format. In case if you require them in any other formats, such as PPT, Excel etc you can submit a request through “Inquiry Before Buy” form available on the right hand side. You may also contact us through email: info@strategymrc.com or phone: +1-301-202-5929
We offer a free 15% customization with every purchase. This requirement can be fulfilled for both pre and post sale. You may send your customization requirements through email at info@strategymrc.com or call us on +1-301-202-5929.
We have 3 different licensing options available in electronic format.
- Single User Licence: Allows one person, typically the buyer, to have access to the ordered product. The ordered product cannot be distributed to anyone else.
- 2-5 User Licence: Allows the ordered product to be shared among a maximum of 5 people within your organisation.
- Corporate License: Allows the product to be shared among all employees of your organisation regardless of their geographical location.
All our reports are typically be emailed to you as an attachment.
To order any available report you need to register on our website. The payment can be made either through CCAvenue or PayPal payments gateways which accept all international cards.
We extend our support to 6 months post sale. A post sale customization is also provided to cover your unmet needs in the report.
Request Customization
We offer complimentary customization of up to 15% with every purchase. To share your customization requirements, feel free to email us at info@strategymrc.com or call us on +1-301-202-5929. .
Please Note: Customization within the 15% threshold is entirely free of charge. If your request exceeds this limit, we will conduct a feasibility assessment. Following that, a detailed quote and timeline will be provided.
WHY CHOOSE US ?

Assured Quality
Best in class reports with high standard of research integrity

24X7 Research Support
Continuous support to ensure the best customer experience.

Free Customization
Adding more values to your product of interest.

Safe & Secure Access
Providing a secured environment for all online transactions.

Trusted by 600+ Brands
Serving the most reputed brands across the world.