
Retrieval Augmented Generation Market
Retrieval Augmented Generation Market Forecasts to 2032 - Global Analysis By Function (Document Retrieval, Response Generation, Summarization and Reporting, and Recommendation Engines), Deployment, Organisation Size, Technology, Application, End User, and By Geography

|
Years Covered |
2024-2032 |
|
Estimated Year Value (2025) |
US $1.81 BN |
|
Projected Year Value (2032) |
US $32.60 BN |
|
CAGR (2025-2032) |
51.1% |
|
Regions Covered |
North America, Europe, Asia Pacific, South America, and Middle East & Africa |
|
Countries Covered |
US, Canada, Mexico, Germany, UK, Italy, France, Spain, Japan, China, India, Australia, New Zealand, South Korea, Rest of Asia Pacific, South America, Argentina, Brazil, Chile, Middle East & Africa, Saudi Arabia, UAE, Qatar, and South Africa |
|
Largest Market |
Asia Pacific |
|
Highest Growing Market |
North America |
According to Stratistics MRC, the Global Retrieval Augmented Generation Market is accounted for $1.81 billion in 2025 and is expected to reach $32.60 billion by 2032 growing at a CAGR of 51.1% during the forecast period. Retrieval Augmented Generation (RAG) is an advanced natural language processing technique that combines generative AI with external information retrieval. Unlike traditional models that rely solely on pre-trained knowledge, RAG dynamically retrieves relevant data from external sources during inference to generate more accurate, context-aware responses. This approach enhances the model's ability to handle complex queries, improve factual accuracy, and adapt across domains like customer support, legal research, healthcare, and content generation.
Market Dynamics:
Driver:
Advances in natural language processing (NLP)
The rapid advancements in natural language processing (NLP) are driving the adoption of Retrieval Augmented Generation (RAG) systems. Improved language models enhance information retrieval and response accuracy, making AI-driven applications more context-aware. The integration of NLP with RAG enables more precise and human-like interactions, improving decision-making efficiency. Additionally, the rising use of AI in customer support and content creation is expanding the scope of retrieval-augmented technologies. These factors collectively contribute to the growing demand for RAG in various industries.
Restraint:
Complexity in system integration
Seamlessly combining retrieval mechanisms with generative models often requires robust orchestration, high computational resources, and careful latency management. Moreover, ensuring compatibility across legacy systems and modern APIs introduces further integration friction. Security, data privacy regulations, and scalability also compound the challenges. As organizations attempt to tailor RAG solutions to domain-specific needs, customization increases complexity, demanding skilled labour and increasing deployment costs. These factors collectively slow adoption and complicate end-to-end implementation of RAG systems in real-world settings.
Opportunity:
Growing demand for context-aware AI
Businesses are prioritizing AI models that understand complex user queries and generate relevant responses. RAG enhances contextual comprehension by integrating real-time retrieval mechanisms with generative models, improving conversational AI accuracy. Industries such as healthcare, finance, and customer service are investing in RAG-powered applications to personalize user experiences. Additionally, advancements in multimodal AI are expanding the scope of retrieval-augmented solutions beyond text-based interfaces. The continued evolution of AI-driven communication tools presents a significant opportunity for RAG adoption.
Threat:
Lack of standardization
Varying AI model architectures and retrieval techniques create inconsistencies in performance across different applications. The absence of industry-wide benchmarks makes it difficult for businesses to evaluate and compare solutions effectively. Additionally, proprietary retrieval frameworks limit interoperability, hindering cross-platform deployment. Data privacy regulations further complicate standardization efforts, as compliance requirements differ across regions. Without unified guidelines, organizations may face difficulties in optimizing RAG systems for widespread adoption.
Covid-19 Impact
The COVID-19 pandemic accelerated the adoption of AI-powered retrieval systems, including Retrieval Augmented Generation (RAG). Lockdowns and remote work scenarios increased demand for automated content generation and intelligent information retrieval. Businesses turned to AI-driven solutions to maintain operational continuity and enhance digital interactions. The post-pandemic emphasis on automation and digital transformation continues to drive investments in retrieval-augmented models.
The document retrieval segment is expected to be the largest during the forecast period
The document retrieval segment is expected to account for the largest market share during the forecast period, due to the need for efficient document processing and knowledge management is driving adoption across industries. RAG systems enhance search accuracy by integrating context-aware retrieval with generative responses. Organizations in legal, healthcare, and finance sectors are investing in retrieval automation to improve decision-making. The rising importance of AI in streamlining content access positions document retrieval as a leading segment in the market.
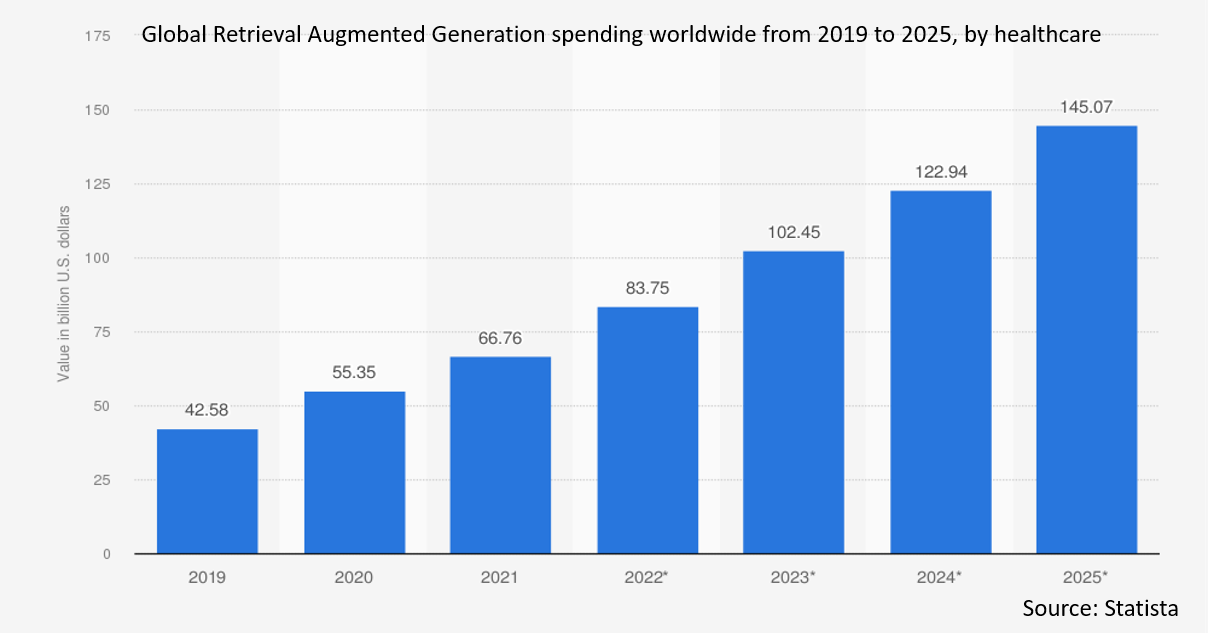
The healthcare segment is expected to have the highest CAGR during the forecast period
Over the forecast period, the healthcare segment is predicted to witness the highest growth rate, due to AI-powered retrieval solutions are revolutionizing patient data management, clinical research, and diagnostic assistance. Healthcare institutions are leveraging RAG systems to improve information accessibility and enhance medical decision-making. The increasing complexity of healthcare data necessitates efficient retrieval mechanisms, boosting RAG adoption. Regulatory compliance and the need for precision in medical content retrieval further accelerate market growth.
Region with largest share:
During the forecast period, the Asia Pacific region is expected to hold the largest market share due to the rapid expansion of AI adoption across various industries is fuelling regional growth. Countries like China, India, and Japan are heavily investing in AI-driven information retrieval systems. Government initiatives supporting AI research and digital transformation contribute to market expansion. The growing volume of unstructured data in enterprises is increasing demand for advanced retrieval technologies.
Region with highest CAGR:
Over the forecast period, the North America region is anticipated to exhibit the highest CAGR, owing to the region’s strong AI research landscape and advanced technological infrastructure support rapid adoption. Major enterprises are implementing AI-powered retrieval solutions to optimize data processing and automate information retrieval. Increasing investments in AI-driven search applications across industries such as finance and healthcare contribute to market expansion.

Key players in the market
Some of the key players profiled in the Retrieval Augmented Generation Market include Amazon Web Services, Microsoft, Google, IBM, OpenAI, Hugging Face, Meta AI, Anthropic, Cohere, Databricks, Clarifai, Informatica, NVIDIA, Vectara, Contextual AI, Nuclia, Skim AI, and Geniusee.
Key Developments:
In June 2025, NVIDIA announced a collaboration with Novo Nordisk to accelerate drug discovery efforts through innovative AI use cases. The work supports Novo Nordisk’s agreement with DCAI to use the Gefion sovereign AI supercomputer.
In February 2025, Amazon Web Services (AWS) announced Ocelot, a new quantum computing chip that can reduce the costs of implementing quantum error correction by up to 90%, compared to current approaches. Developed by the team at the AWS Center for Quantum Computing at the California Institute of Technology, Ocelot represents a breakthrough in the pursuit to build fault-tolerant quantum computers.
Functions Covered:
• Document Retrieval
• Response Generation
• Summarization and Reporting
• Recommendation Engines
Deployments Covered:
• Cloud-based
• On-premises
Organization Sizes Covered:
• Large Enterprises
• Small and Medium Enterprises (SMEs)
Technologies Covered:
• Natural Language Processing (NLP)
• Deep Learning
• Machine Learning
• Knowledge Graphs
• Semantic Search
• Vector Databases
• Other Technologies
Applications Covered:
• Customer Support and Chatbots
• Content Generation
• Knowledge Management
• Legal and Compliance
• Marketing and Sales
• Research and Development
• Search Engine Enhancement
• Healthcare Information Retrieval
• Other Applications
End Users Covered:
• Retail and E-commerce
• Healthcare
• IT and Telecommunications
• Financial Services
• Education
• Media and Entertainment
• Other End Users
Regions Covered:
• North America
o US
o Canada
o Mexico
• Europe
o Germany
o UK
o Italy
o France
o Spain
o Rest of Europe
• Asia Pacific
o Japan
o China
o India
o Australia
o New Zealand
o South Korea
o Rest of Asia Pacific
• South America
o Argentina
o Brazil
o Chile
o Rest of South America
• Middle East & Africa
o Saudi Arabia
o UAE
o Qatar
o South Africa
o Rest of Middle East & Africa
What our report offers:
- Market share assessments for the regional and country-level segments
- Strategic recommendations for the new entrants
- Covers Market data for the years 2024, 2025, 2026, 2028, and 2032
- Market Trends (Drivers, Constraints, Opportunities, Threats, Challenges, Investment Opportunities, and recommendations)
- Strategic recommendations in key business segments based on the market estimations
- Competitive landscaping mapping the key common trends
- Company profiling with detailed strategies, financials, and recent developments
- Supply chain trends mapping the latest technological advancements
Free Customization Offerings:
All the customers of this report will be entitled to receive one of the following free customization options:
• Company Profiling
o Comprehensive profiling of additional market players (up to 3)
o SWOT Analysis of key players (up to 3)
• Regional Segmentation
o Market estimations, Forecasts and CAGR of any prominent country as per the client's interest (Note: Depends on feasibility check)
• Competitive Benchmarking
o Benchmarking of key players based on product portfolio, geographical presence, and strategic alliances
Table of Contents
1 Executive Summary
2 Preface
2.1 Abstract
2.2 Stake Holders
2.3 Research Scope
2.4 Research Methodology
2.4.1 Data Mining
2.4.2 Data Analysis
2.4.3 Data Validation
2.4.4 Research Approach
2.5 Research Sources
2.5.1 Primary Research Sources
2.5.2 Secondary Research Sources
2.5.3 Assumptions
3 Market Trend Analysis
3.1 Introduction
3.2 Drivers
3.3 Restraints
3.4 Opportunities
3.5 Threats
3.6 Technology Analysis
3.7 Application Analysis
3.8 End User Analysis
3.9 Emerging Markets
3.10 Impact of Covid-19
4 Porters Five Force Analysis
4.1 Bargaining power of suppliers
4.2 Bargaining power of buyers
4.3 Threat of substitutes
4.4 Threat of new entrants
4.5 Competitive rivalry
5 Global Retrieval Augmented Generation Market, By Function
5.1 Introduction
5.2 Document Retrieval
5.3 Response Generation
5.4 Summarization and Reporting
5.5 Recommendation Engines
6 Global Retrieval Augmented Generation Market, By Deployment
6.1 Introduction
6.2 Cloud-based
6.3 On-premises
7 Global Retrieval Augmented Generation Market, By Organisation Size
7.1 Introduction
7.2 Large Enterprises
7.3 Small and Medium Enterprises (SMEs)
8 Global Retrieval Augmented Generation Market, By Technology
8.1 Introduction
8.2 Natural Language Processing (NLP)
8.3 Deep Learning
8.4 Machine Learning
8.5 Knowledge Graphs
8.6 Semantic Search
8.7 Vector Databases
8.8 Other Technologies
9 Global Retrieval Augmented Generation Market, By Application
9.1 Introduction
9.2 Customer Support and Chatbots
9.3 Content Generation
9.4 Knowledge Management
9.5 Legal and Compliance
9.6 Marketing and Sales
9.7 Research and Development
9.8 Search Engine Enhancement
9.9 Healthcare Information Retrieval
9.10 Other Applications
10 Global Retrieval Augmented Generation Market, By End User
10.1 Introduction
10.2 Retail and E-commerce
10.3 Healthcare
10.4 IT and Telecommunications
10.5 Financial Services
10.6 Education
10.7 Media and Entertainment
10.8 Other End Users
11 Global Retrieval Augmented Generation Market, By Geography
11.1 Introduction
11.2 North America
11.2.1 US
11.2.2 Canada
11.2.3 Mexico
11.3 Europe
11.3.1 Germany
11.3.2 UK
11.3.3 Italy
11.3.4 France
11.3.5 Spain
11.3.6 Rest of Europe
11.4 Asia Pacific
11.4.1 Japan
11.4.2 China
11.4.3 India
11.4.4 Australia
11.4.5 New Zealand
11.4.6 South Korea
11.4.7 Rest of Asia Pacific
11.5 South America
11.5.1 Argentina
11.5.2 Brazil
11.5.3 Chile
11.5.4 Rest of South America
11.6 Middle East & Africa
11.6.1 Saudi Arabia
11.6.2 UAE
11.6.3 Qatar
11.6.4 South Africa
11.6.5 Rest of Middle East & Africa
12 Key Developments
12.1 Agreements, Partnerships, Collaborations and Joint Ventures
12.2 Acquisitions & Mergers
12.3 New Product Launch
12.4 Expansions
12.5 Other Key Strategies
13 Company Profiling
13.1 Amazon Web Services
13.2 Microsoft
13.3 Google
13.4 IBM
13.5 OpenAI
13.6 Hugging Face
13.7 Meta AI
13.8 Anthropic
13.9 Cohere
13.10 Databricks
13.11 Clarifai
13.12 Informatica
13.13 NVIDIA
13.14 Vectara
13.15 Contextual AI
13.16 Nuclia
13.17 Skim AI
13.18 Geniusee
List of Tables
1 Global Retrieval Augmented Generation Market Outlook, By Region (2024-2032) ($MN)
2 Global Retrieval Augmented Generation Market Outlook, By Function (2024-2032) ($MN)
3 Global Retrieval Augmented Generation Market Outlook, By Document Retrieval (2024-2032) ($MN)
4 Global Retrieval Augmented Generation Market Outlook, By Response Generation (2024-2032) ($MN)
5 Global Retrieval Augmented Generation Market Outlook, By Summarization and Reporting (2024-2032) ($MN)
6 Global Retrieval Augmented Generation Market Outlook, By Recommendation Engines (2024-2032) ($MN)
7 Global Retrieval Augmented Generation Market Outlook, By Deployment (2024-2032) ($MN)
8 Global Retrieval Augmented Generation Market Outlook, By Cloud-based (2024-2032) ($MN)
9 Global Retrieval Augmented Generation Market Outlook, By On-premises (2024-2032) ($MN)
10 Global Retrieval Augmented Generation Market Outlook, By Organisation Size (2024-2032) ($MN)
11 Global Retrieval Augmented Generation Market Outlook, By Large Enterprises (2024-2032) ($MN)
12 Global Retrieval Augmented Generation Market Outlook, By Small and Medium Enterprises (SMEs) (2024-2032) ($MN)
13 Global Retrieval Augmented Generation Market Outlook, By Technology (2024-2032) ($MN)
14 Global Retrieval Augmented Generation Market Outlook, By Natural Language Processing (NLP) (2024-2032) ($MN)
15 Global Retrieval Augmented Generation Market Outlook, By Deep Learning (2024-2032) ($MN)
16 Global Retrieval Augmented Generation Market Outlook, By Machine Learning (2024-2032) ($MN)
17 Global Retrieval Augmented Generation Market Outlook, By Knowledge Graphs (2024-2032) ($MN)
18 Global Retrieval Augmented Generation Market Outlook, By Semantic Search (2024-2032) ($MN)
19 Global Retrieval Augmented Generation Market Outlook, By Vector Databases (2024-2032) ($MN)
20 Global Retrieval Augmented Generation Market Outlook, By Other Technologies (2024-2032) ($MN)
21 Global Retrieval Augmented Generation Market Outlook, By Application (2024-2032) ($MN)
22 Global Retrieval Augmented Generation Market Outlook, By Customer Support and Chatbots (2024-2032) ($MN)
23 Global Retrieval Augmented Generation Market Outlook, By Content Generation (2024-2032) ($MN)
24 Global Retrieval Augmented Generation Market Outlook, By Knowledge Management (2024-2032) ($MN)
25 Global Retrieval Augmented Generation Market Outlook, By Legal and Compliance (2024-2032) ($MN)
26 Global Retrieval Augmented Generation Market Outlook, By Marketing and Sales (2024-2032) ($MN)
27 Global Retrieval Augmented Generation Market Outlook, By Research and Development (2024-2032) ($MN)
28 Global Retrieval Augmented Generation Market Outlook, By Search Engine Enhancement (2024-2032) ($MN)
29 Global Retrieval Augmented Generation Market Outlook, By Healthcare Information Retrieval (2024-2032) ($MN)
30 Global Retrieval Augmented Generation Market Outlook, By Other Applications (2024-2032) ($MN)
31 Global Retrieval Augmented Generation Market Outlook, By End User (2024-2032) ($MN)
32 Global Retrieval Augmented Generation Market Outlook, By Retail and E-commerce (2024-2032) ($MN)
33 Global Retrieval Augmented Generation Market Outlook, By Healthcare (2024-2032) ($MN)
34 Global Retrieval Augmented Generation Market Outlook, By IT and Telecommunications (2024-2032) ($MN)
35 Global Retrieval Augmented Generation Market Outlook, By Financial Services (2024-2032) ($MN)
36 Global Retrieval Augmented Generation Market Outlook, By Education (2024-2032) ($MN)
37 Global Retrieval Augmented Generation Market Outlook, By Media and Entertainment (2024-2032) ($MN)
38 Global Retrieval Augmented Generation Market Outlook, By Other End Users (2024-2032) ($MN)
Note: Tables for North America, Europe, APAC, South America, and Middle East & Africa Regions are also represented in the same manner as above.
List of Figures
RESEARCH METHODOLOGY

We at ‘Stratistics’ opt for an extensive research approach which involves data mining, data validation, and data analysis. The various research sources include in-house repository, secondary research, competitor’s sources, social media research, client internal data, and primary research.
Our team of analysts prefers the most reliable and authenticated data sources in order to perform the comprehensive literature search. With access to most of the authenticated data bases our team highly considers the best mix of information through various sources to obtain extensive and accurate analysis.
Each report takes an average time of a month and a team of 4 industry analysts. The time may vary depending on the scope and data availability of the desired market report. The various parameters used in the market assessment are standardized in order to enhance the data accuracy.
Data Mining
The data is collected from several authenticated, reliable, paid and unpaid sources and is filtered depending on the scope & objective of the research. Our reports repository acts as an added advantage in this procedure. Data gathering from the raw material suppliers, distributors and the manufacturers is performed on a regular basis, this helps in the comprehensive understanding of the products value chain. Apart from the above mentioned sources the data is also collected from the industry consultants to ensure the objective of the study is in the right direction.
Market trends such as technological advancements, regulatory affairs, market dynamics (Drivers, Restraints, Opportunities and Challenges) are obtained from scientific journals, market related national & international associations and organizations.
Data Analysis
From the data that is collected depending on the scope & objective of the research the data is subjected for the analysis. The critical steps that we follow for the data analysis include:
- Product Lifecycle Analysis
- Competitor analysis
- Risk analysis
- Porters Analysis
- PESTEL Analysis
- SWOT Analysis
The data engineering is performed by the core industry experts considering both the Marketing Mix Modeling and the Demand Forecasting. The marketing mix modeling makes use of multiple-regression techniques to predict the optimal mix of marketing variables. Regression factor is based on a number of variables and how they relate to an outcome such as sales or profits.
Data Validation
The data validation is performed by the exhaustive primary research from the expert interviews. This includes telephonic interviews, focus groups, face to face interviews, and questionnaires to validate our research from all aspects. The industry experts we approach come from the leading firms, involved in the supply chain ranging from the suppliers, distributors to the manufacturers and consumers so as to ensure an unbiased analysis.
We are in touch with more than 15,000 industry experts with the right mix of consultants, CEO's, presidents, vice presidents, managers, experts from both supply side and demand side, executives and so on.
The data validation involves the primary research from the industry experts belonging to:
- Leading Companies
- Suppliers & Distributors
- Manufacturers
- Consumers
- Industry/Strategic Consultants
Apart from the data validation the primary research also helps in performing the fill gap research, i.e. providing solutions for the unmet needs of the research which helps in enhancing the reports quality.
For more details about research methodology, kindly write to us at info@strategymrc.com
Frequently Asked Questions
In case of any queries regarding this report, you can contact the customer service by filing the “Inquiry Before Buy” form available on the right hand side. You may also contact us through email: info@strategymrc.com or phone: +1-301-202-5929
Yes, the samples are available for all the published reports. You can request them by filling the “Request Sample” option available in this page.
Yes, you can request a sample with your specific requirements. All the customized samples will be provided as per the requirement with the real data masked.
All our reports are available in Digital PDF format. In case if you require them in any other formats, such as PPT, Excel etc you can submit a request through “Inquiry Before Buy” form available on the right hand side. You may also contact us through email: info@strategymrc.com or phone: +1-301-202-5929
We offer a free 15% customization with every purchase. This requirement can be fulfilled for both pre and post sale. You may send your customization requirements through email at info@strategymrc.com or call us on +1-301-202-5929.
We have 3 different licensing options available in electronic format.
- Single User Licence: Allows one person, typically the buyer, to have access to the ordered product. The ordered product cannot be distributed to anyone else.
- 2-5 User Licence: Allows the ordered product to be shared among a maximum of 5 people within your organisation.
- Corporate License: Allows the product to be shared among all employees of your organisation regardless of their geographical location.
All our reports are typically be emailed to you as an attachment.
To order any available report you need to register on our website. The payment can be made either through CCAvenue or PayPal payments gateways which accept all international cards.
We extend our support to 6 months post sale. A post sale customization is also provided to cover your unmet needs in the report.
Request Customization
We offer complimentary customization of up to 15% with every purchase. To share your customization requirements, feel free to email us at info@strategymrc.com or call us on +1-301-202-5929. .
Please Note: Customization within the 15% threshold is entirely free of charge. If your request exceeds this limit, we will conduct a feasibility assessment. Following that, a detailed quote and timeline will be provided.
WHY CHOOSE US ?

Assured Quality
Best in class reports with high standard of research integrity

24X7 Research Support
Continuous support to ensure the best customer experience.

Free Customization
Adding more values to your product of interest.

Safe & Secure Access
Providing a secured environment for all online transactions.

Trusted by 600+ Brands
Serving the most reputed brands across the world.