
Seafood Market
Seafood Market Forecasts to 2028 - Global Analysis By Source (Wild Caught, Farm Raised, Other Sources), Nature (Conventional, Organic, Other Natures), Form (Frozen, Fresh, Ambient, Chilled Canned, Other Forms) and By Geography

|
Years Covered |
2020-2028 |
|
Estimated Year Value (2022) |
US $344.68 BN |
|
Projected Year Value (2028) |
US $641.91 BN |
|
CAGR (2022 - 2028) |
10.92% |
|
Regions Covered |
North America, Europe, Asia Pacific, South America, and Middle East & Africa |
|
Countries Covered |
US, Canada, Mexico, Germany, UK, Italy, France, Spain, Japan, China, India, Australia, New Zealand, South Korea, Rest of Asia Pacific, South America, Argentina, Brazil, Chile, Middle East & Africa, Saudi Arabia, UAE, Qatar, and South Africa |
|
Largest Market |
Asia Pacific |
|
Highest Growing Market |
North America |
According to Stratistics MRC, the Global Seafood Market is accounted for $344.68 billion in 2022 and is expected to reach $641.91 billion by 2028 growing at a CAGR of 10.92% during the forecast period. Seafood includes all types of crustaceans, fish, and molluscs, whether processed or fresh. Seafood is high in protein and is widely regarded as one of the healthiest foods. Seafood consumption helps to prevent heart attacks and strokes, lowers blood pressure, and is high in Omega-3 fatty acids.
According to the Food and Agriculture Organization (FAO), by 2030, and additional value of 40 million tons of sea food, which is an increment of 30%, will be required to meet the rising demand in coming years.
Market Dynamics:
Driver:
Rise in awareness of the health benefits
Over the forecast period, the seafood market will see an increase in demand. This is primarily due to increased consumer understanding of the health benefits of seafood and a considerable shift in consumer lifestyle. Non-vegetarian consumers have been gradually changing their eating habits and gravitating toward pescetarianism. Because meat and meat products frequently contain harmful chemicals and pesticides, there has been a significant shift in consumer preference toward healthy diet patterns. As a result, this factor has increased consumer demand for seafood in the coming years.
Restraint:
Changing climatic conditions
Sea species extinction is expected to stymie market growth. Shifting climatic factors such like levels of oxygen, water acidity, but instead temperatures have an impact on fish and seafood production, which is expected to impede market growth. Severe fishing disrupts marine life, limiting market growth. The lack of proper packaging regulations and the product's short shelf life are expected to stymie market growth.
Opportunity:
Rising demand for fat-free proteinaceous food around the world
Various seafood restaurants are emphasising the availability of exotic seafood options. Sustainable seafood options such as catfish and tilapia are prioritised by these restaurants and seafood service providers. These factors are propelling the seafood market forward.
Threat:
Limitations of sea foods
The product's shorter shelf life, the decrement of sea species, federal regulations on increasing and packaging seafood, and the rise of new of illnesses while going to rise and processing seafood will all impede market growth.
Covid-19 Impact
The COVID-19 epidemic has had a significant impact on the country's seafood market due to the chain disruption and government-imposed lockdown. The import of seafood is expected to resume within two years. Lockdowns around the world, supply chain disruptions, and fluctuating raw material supplies forced producers to shut down production, resulting in a disappointing decline in market growth. The introduction of vaccines to confront the Covid-19 public health crisis is expected to increase market growth during the forecast period.
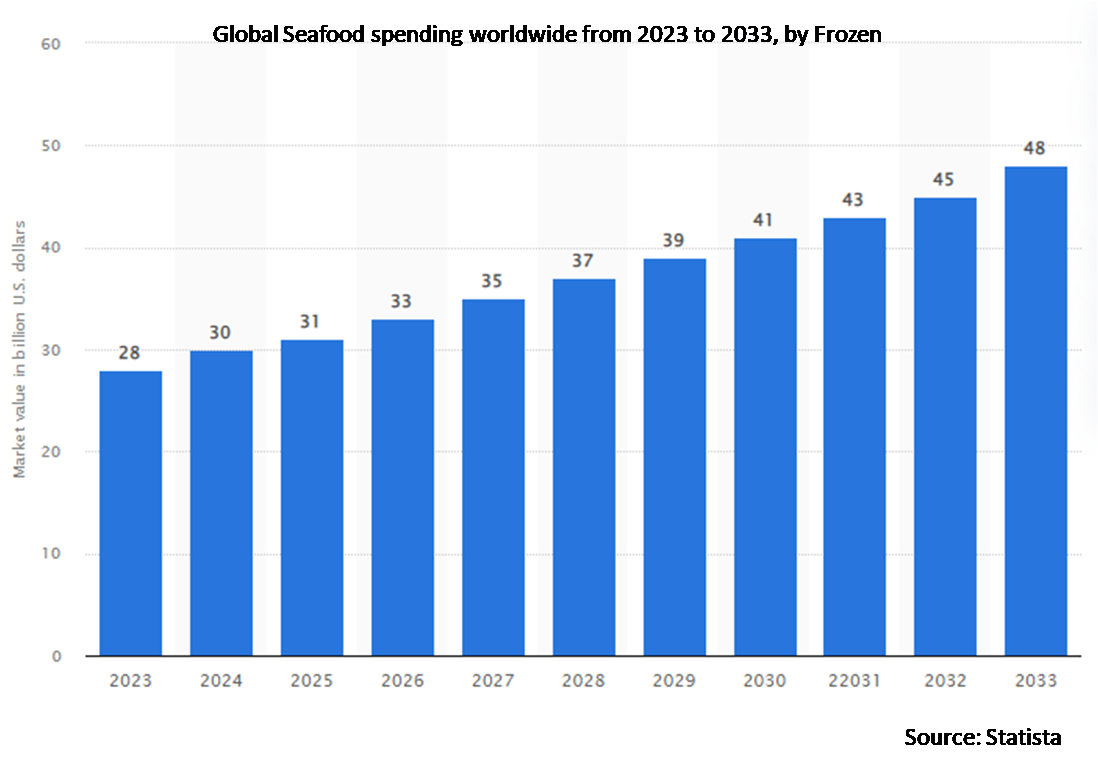
The Frozen segment is expected to be the largest during the forecast period
The Frozen segment is estimated to have a lucrative growth. Under three-quarters among all seafood consumed worldwide is frozen, with freshwater fish species reporting for a little more than half of all frozen goods. Shrimp is the most popular shellfish, accounting for less than half of the total. Frozen fish products are becoming more popular as a result of their comfort ability, ease of order to prepare, and nutritional value.
The fish segment is expected to have the highest CAGR during the forecast period
The fish segment is anticipated to witness the fastest CAGR growth due to fish is becoming more popular as a high-protein alternative to meat. As the amount of meat eaters grows, so does the demand for fish, owing to the wellbeing advantages of consuming it. Fish is a low fat diet that is very beneficial because it contains omega-3 fatty acids. Many countries with prevalent heart conditions are increasing their consumption of fish. Omega-3 fatty acids seem to be extremely beneficial to people suffering from cardiovascular disease. Fish is high in protein and low in saturated fat. Vitamin AB and omega-3 fatty acids are critical for overall health, particularly the eyes and brain.
Region with highest share:
Asia Pacific is projected to hold the largest market share during the forecast period owing to increasing disposable income and then a rising prevalence of fast-food eateries that serve fish. In past years, the amount of online ordering from restaurants has increased at an unprecedented rate, creating multiple chances for restaurant owners to improve their sales channels and revenue. Developing countries in this region are becoming the epicentres of some of the world's most popular fish-related cuisines.
Region with highest CAGR:
North America is projected to have the highest CAGR over the forecast period, owing to the increasing customer propensity forward toward different cuisines as well as the increasing popularity of seafood. Manufacturers are working to expand their manufacturing units in developed countries, which present lucrative opportunities for domestic players to collaborate. Moreover, rising global demand for seafood has increased per capita consumption, implying significant growth during the forecast period.

Key players in the market
Some of the key players profiled in the Seafood Market include Thai Union Group PCL, Trident Seafoods Corporation, Phillips Foods, Inc., Pacific Seafood, Nueva Pescanova USA, SeaPak, American Seafoods Company, Stolt Sea Farm, Lee Fishing Company, Shanghai Fisheries Group Co., Ltd., Royal Greenland Seafood A/S and Marine Harvest ASA.
Key Developments:
In May 2022, Nueva Pescanova, announced the submission of their proposal of building a new commercial octopus, in Puerto Las Palmas, Spain. The firm has been intensively working toward developing a method of octopus farming, and lately, announced its successful raising, hatching, and incubation of O. vulgaris octopus’ five generations in a test facility.
Sources Covered:
• Wild Caught
• Farm Raised
• Other Sources
Natures Covered:
• Conventional
• Organic
• Other Natures
Forms Covered:
• Frozen
• Fresh
• Ambient
• Chilled
• Canned
• Salted
• Dried
• Smoked
• Other Forms
Production Processes Covered:
• Extrusion
• Blow Molding
• Co-Extrusion
• Thermoforming (Thermo Fill Seal)
• Injection Molding
• Other Production Processes
Product Types Covered:
• Lobsters
• Ground Fish
• Pelagics
• Salmonids
• Fishes
• Molluscs
• Crustaceans
• Cephalopods
• Other Product Types
Sales Channels Covered:
• Indirect
• Direct
• Other Sales Channels
End Users Covered:
• Biotechnology
• Food
• Cosmetics
• Industrial
• Pharmaceutical
• Household Retail
• Other End Users
Regions Covered:
• North America
o US
o Canada
o Mexico
• Europe
o Germany
o UK
o Italy
o France
o Spain
o Rest of Europe
• Asia Pacific
o Japan
o China
o India
o Australia
o New Zealand
o South Korea
o Rest of Asia Pacific
• South America
o Argentina
o Brazil
o Chile
o Rest of South America
• Middle East & Africa
o Saudi Arabia
o UAE
o Qatar
o South Africa
o Rest of Middle East & Africa
What our report offers:
- Market share assessments for the regional and country-level segments
- Strategic recommendations for the new entrants
- Covers Market data for the years 2020, 2021, 2022, 2025, and 2028
- Market Trends (Drivers, Constraints, Opportunities, Threats, Challenges, Investment Opportunities, and recommendations)
- Strategic recommendations in key business segments based on the market estimations
- Competitive landscaping mapping the key common trends
- Company profiling with detailed strategies, financials, and recent developments
- Supply chain trends mapping the latest technological advancements
Free Customization Offerings:
All the customers of this report will be entitled to receive one of the following free customization options:
• Company Profiling
o Comprehensive profiling of additional market players (up to 3)
o SWOT Analysis of key players (up to 3)
• Regional Segmentation
o Market estimations, Forecasts and CAGR of any prominent country as per the client's interest (Note: Depends on feasibility check)
• Competitive Benchmarking
o Benchmarking of key players based on product portfolio, geographical presence, and strategic alliances
Table of Contents
1 Executive Summary
2 Preface
2.1 Abstract
2.2 Stake Holders
2.3 Research Scope
2.4 Research Methodology
2.4.1 Data Mining
2.4.2 Data Analysis
2.4.3 Data Validation
2.4.4 Research Approach
2.5 Research Sources
2.5.1 Primary Research Sources
2.5.2 Secondary Research Sources
2.5.3 Assumptions
3 Market Trend Analysis
3.1 Introduction
3.2 Drivers
3.3 Restraints
3.4 Opportunities
3.5 Threats
3.6 Product Analysis
3.7 End User Analysis
3.8 Emerging Markets
3.9 Impact of Covid-19
4 Porters Five Force Analysis
4.1 Bargaining power of suppliers
4.2 Bargaining power of buyers
4.3 Threat of substitutes
4.4 Threat of new entrants
4.5 Competitive rivalry
5 Global Seafood Market, By Source
5.1 Introduction
5.2 Wild Caught
5.3 Farm Raised
5.4 Other Sources
6 Global Seafood Market, By Nature
6.1 Introduction
6.2 Conventional
6.3 Organic
6.4 Other Natures
7 Global Seafood Market, By Form
7.1 Introduction
7.2 Frozen
7.3 Fresh
7.4 Ambient
7.5 Chilled
7.6 Canned
7.7 Salted
7.8 Dried
7.9 Smoked
7.10 Other Forms
8 Global Seafood Market, By Product Type
8.1 Introduction
8.2 Lobsters
8.3 Ground Fish
8.4 Pelagics
8.5 Salmonids
8.6 Fishes
8.6.1 Pollock
8.6.2 Salmon
8.6.3 Tuna
8.7 Molluscs
8.7.1 Scallops
8.7.2 Oysters
8.8 Crustaceans
8.8.1 Crabs
8.8.2 Shrimp
8.8.3 Prawns
8.9 Cephalopods
8.10 Other Product Types
8.10.1 Trouts
9 Global Seafood Market, By Sales Channel
9.1 Introduction
9.2 Indirect
9.2.1 Wholesale Stores
9.2.2 Modern Trade
9.2.3 Specialty Food Stores
9.2.4 Convenience Stores
9.2.5 Online Retail
9.2.6 Discount Stores
9.3 Direct
9.4 Other Sales Channels
10 Global Seafood Market, By End User
10.1 Introduction
10.2 Biotechnology
10.3 Food
10.4 Cosmetics
10.5 Industrial
10.6 Pharmaceutical
10.7 Household Retail
10.8 Other End Users
11 Global Seafood Market, By Geography
11.1 Introduction
11.2 North America
11.2.1 US
11.2.2 Canada
11.2.3 Mexico
11.3 Europe
11.3.1 Germany
11.3.2 UK
11.3.3 Italy
11.3.4 France
11.3.5 Spain
11.3.6 Rest of Europe
11.4 Asia Pacific
11.4.1 Japan
11.4.2 China
11.4.3 India
11.4.4 Australia
11.4.5 New Zealand
11.4.6 South Korea
11.4.7 Rest of Asia Pacific
11.5 South America
11.5.1 Argentina
11.5.2 Brazil
11.5.3 Chile
11.5.4 Rest of South America
11.6 Middle East & Africa
11.6.1 Saudi Arabia
11.6.2 UAE
11.6.3 Qatar
11.6.4 South Africa
11.6.5 Rest of Middle East & Africa
12 Key Developments
12.1 Agreements, Partnerships, Collaborations and Joint Ventures
12.2 Acquisitions & Mergers
12.3 New Product Launch
12.4 Expansions
12.5 Other Key Strategies
13 Company Profiling
13.1 Thai Union Group PCL
13.2 Trident Seafoods Corporation
13.3 Phillips Foods, Inc.
13.4 Pacific Seafood
13.5 Nueva Pescanova USA
13.6 SeaPak
13.7 American Seafoods Company
13.8 Stolt Sea Farm
13.9 Lee Fishing Company
13.10 Shanghai Fisheries Group Co., Ltd.
13.11 Royal Greenland Seafood A/S
13.12 Marine Harvest ASA
List of Tables
1 Global Seafood Market Outlook, By Region (2020-2028) ($MN)
2 Global Seafood Market Outlook, By Source (2020-2028) ($MN)
3 Global Seafood Market Outlook, By Wild Caught (2020-2028) ($MN)
4 Global Seafood Market Outlook, By Farm Raised (2020-2028) ($MN)
5 Global Seafood Market Outlook, By Other Sources (2020-2028) ($MN)
6 Global Seafood Market Outlook, By Nature (2020-2028) ($MN)
7 Global Seafood Market Outlook, By Conventional (2020-2028) ($MN)
8 Global Seafood Market Outlook, By Organic (2020-2028) ($MN)
9 Global Seafood Market Outlook, By Other Natures (2020-2028) ($MN)
10 Global Seafood Market Outlook, By Form (2020-2028) ($MN)
11 Global Seafood Market Outlook, By Frozen (2020-2028) ($MN)
12 Global Seafood Market Outlook, By Fresh (2020-2028) ($MN)
13 Global Seafood Market Outlook, By Ambient (2020-2028) ($MN)
14 Global Seafood Market Outlook, By Chilled (2020-2028) ($MN)
15 Global Seafood Market Outlook, By Canned (2020-2028) ($MN)
16 Global Seafood Market Outlook, By Salted (2020-2028) ($MN)
17 Global Seafood Market Outlook, By Dried (2020-2028) ($MN)
18 Global Seafood Market Outlook, By Smoked (2020-2028) ($MN)
19 Global Seafood Market Outlook, By Other Forms (2020-2028) ($MN)
20 Global Seafood Market Outlook, By Product Type (2020-2028) ($MN)
21 Global Seafood Market Outlook, By Lobsters (2020-2028) ($MN)
22 Global Seafood Market Outlook, By Ground Fish (2020-2028) ($MN)
23 Global Seafood Market Outlook, By Pelagics (2020-2028) ($MN)
24 Global Seafood Market Outlook, By Salmonids (2020-2028) ($MN)
25 Global Seafood Market Outlook, By Fishes (2020-2028) ($MN)
26 Global Seafood Market Outlook, By Pollock (2020-2028) ($MN)
27 Global Seafood Market Outlook, By Salmon (2020-2028) ($MN)
28 Global Seafood Market Outlook, By Tuna (2020-2028) ($MN)
29 Global Seafood Market Outlook, By Molluscs (2020-2028) ($MN)
30 Global Seafood Market Outlook, By Scallops (2020-2028) ($MN)
31 Global Seafood Market Outlook, By Oysters (2020-2028) ($MN)
32 Global Seafood Market Outlook, By Crustaceans (2020-2028) ($MN)
33 Global Seafood Market Outlook, By Crabs (2020-2028) ($MN)
34 Global Seafood Market Outlook, By Shrimp (2020-2028) ($MN)
35 Global Seafood Market Outlook, By Prawns (2020-2028) ($MN)
36 Global Seafood Market Outlook, By Cephalopods (2020-2028) ($MN)
37 Global Seafood Market Outlook, By Other Product Types (2020-2028) ($MN)
38 Global Seafood Market Outlook, By Trouts (2020-2028) ($MN)
39 Global Seafood Market Outlook, By Sales Channel (2020-2028) ($MN)
40 Global Seafood Market Outlook, By Indirect (2020-2028) ($MN)
41 Global Seafood Market Outlook, By Wholesale Stores (2020-2028) ($MN)
42 Global Seafood Market Outlook, By Modern Trade (2020-2028) ($MN)
43 Global Seafood Market Outlook, By Specialty Food Stores (2020-2028) ($MN)
44 Global Seafood Market Outlook, By Convenience Stores (2020-2028) ($MN)
45 Global Seafood Market Outlook, By Online Retail (2020-2028) ($MN)
46 Global Seafood Market Outlook, By Discount Stores (2020-2028) ($MN)
47 Global Seafood Market Outlook, By Direct (2020-2028) ($MN)
48 Global Seafood Market Outlook, By Other Sales Channels (2020-2028) ($MN)
49 Global Seafood Market Outlook, By End User (2020-2028) ($MN)
50 Global Seafood Market Outlook, By Biotechnology (2020-2028) ($MN)
51 Global Seafood Market Outlook, By Food (2020-2028) ($MN)
52 Global Seafood Market Outlook, By Cosmetics (2020-2028) ($MN)
53 Global Seafood Market Outlook, By Industrial (2020-2028) ($MN)
54 Global Seafood Market Outlook, By Pharmaceutical (2020-2028) ($MN)
55 Global Seafood Market Outlook, By Household Retail (2020-2028) ($MN)
56 Global Seafood Market Outlook, By Other End Users (2020-2028) ($MN)
Note: Tables for North America, Europe, APAC, South America, and Middle East & Africa Regions are also represented in the same manner as above.
List of Figures
RESEARCH METHODOLOGY

We at ‘Stratistics’ opt for an extensive research approach which involves data mining, data validation, and data analysis. The various research sources include in-house repository, secondary research, competitor’s sources, social media research, client internal data, and primary research.
Our team of analysts prefers the most reliable and authenticated data sources in order to perform the comprehensive literature search. With access to most of the authenticated data bases our team highly considers the best mix of information through various sources to obtain extensive and accurate analysis.
Each report takes an average time of a month and a team of 4 industry analysts. The time may vary depending on the scope and data availability of the desired market report. The various parameters used in the market assessment are standardized in order to enhance the data accuracy.
Data Mining
The data is collected from several authenticated, reliable, paid and unpaid sources and is filtered depending on the scope & objective of the research. Our reports repository acts as an added advantage in this procedure. Data gathering from the raw material suppliers, distributors and the manufacturers is performed on a regular basis, this helps in the comprehensive understanding of the products value chain. Apart from the above mentioned sources the data is also collected from the industry consultants to ensure the objective of the study is in the right direction.
Market trends such as technological advancements, regulatory affairs, market dynamics (Drivers, Restraints, Opportunities and Challenges) are obtained from scientific journals, market related national & international associations and organizations.
Data Analysis
From the data that is collected depending on the scope & objective of the research the data is subjected for the analysis. The critical steps that we follow for the data analysis include:
- Product Lifecycle Analysis
- Competitor analysis
- Risk analysis
- Porters Analysis
- PESTEL Analysis
- SWOT Analysis
The data engineering is performed by the core industry experts considering both the Marketing Mix Modeling and the Demand Forecasting. The marketing mix modeling makes use of multiple-regression techniques to predict the optimal mix of marketing variables. Regression factor is based on a number of variables and how they relate to an outcome such as sales or profits.
Data Validation
The data validation is performed by the exhaustive primary research from the expert interviews. This includes telephonic interviews, focus groups, face to face interviews, and questionnaires to validate our research from all aspects. The industry experts we approach come from the leading firms, involved in the supply chain ranging from the suppliers, distributors to the manufacturers and consumers so as to ensure an unbiased analysis.
We are in touch with more than 15,000 industry experts with the right mix of consultants, CEO's, presidents, vice presidents, managers, experts from both supply side and demand side, executives and so on.
The data validation involves the primary research from the industry experts belonging to:
- Leading Companies
- Suppliers & Distributors
- Manufacturers
- Consumers
- Industry/Strategic Consultants
Apart from the data validation the primary research also helps in performing the fill gap research, i.e. providing solutions for the unmet needs of the research which helps in enhancing the reports quality.
For more details about research methodology, kindly write to us at info@strategymrc.com
Frequently Asked Questions
In case of any queries regarding this report, you can contact the customer service by filing the “Inquiry Before Buy” form available on the right hand side. You may also contact us through email: info@strategymrc.com or phone: +1-301-202-5929
Yes, the samples are available for all the published reports. You can request them by filling the “Request Sample” option available in this page.
Yes, you can request a sample with your specific requirements. All the customized samples will be provided as per the requirement with the real data masked.
All our reports are available in Digital PDF format. In case if you require them in any other formats, such as PPT, Excel etc you can submit a request through “Inquiry Before Buy” form available on the right hand side. You may also contact us through email: info@strategymrc.com or phone: +1-301-202-5929
We offer a free 15% customization with every purchase. This requirement can be fulfilled for both pre and post sale. You may send your customization requirements through email at info@strategymrc.com or call us on +1-301-202-5929.
We have 3 different licensing options available in electronic format.
- Single User Licence: Allows one person, typically the buyer, to have access to the ordered product. The ordered product cannot be distributed to anyone else.
- 2-5 User Licence: Allows the ordered product to be shared among a maximum of 5 people within your organisation.
- Corporate License: Allows the product to be shared among all employees of your organisation regardless of their geographical location.
All our reports are typically be emailed to you as an attachment.
To order any available report you need to register on our website. The payment can be made either through CCAvenue or PayPal payments gateways which accept all international cards.
We extend our support to 6 months post sale. A post sale customization is also provided to cover your unmet needs in the report.
Request Customization
We offer complimentary customization of up to 15% with every purchase. To share your customization requirements, feel free to email us at info@strategymrc.com or call us on +1-301-202-5929. .
Please Note: Customization within the 15% threshold is entirely free of charge. If your request exceeds this limit, we will conduct a feasibility assessment. Following that, a detailed quote and timeline will be provided.
WHY CHOOSE US ?

Assured Quality
Best in class reports with high standard of research integrity

24X7 Research Support
Continuous support to ensure the best customer experience.

Free Customization
Adding more values to your product of interest.

Safe & Secure Access
Providing a secured environment for all online transactions.

Trusted by 600+ Brands
Serving the most reputed brands across the world.